| Param | Original file | Final file |
|---|---|---|
| Filename | modeM0/AS1A14_083T10_9000006566_57056cztM0_level2.fits | modeM0/AS1A14_083T10_9000006566_57056cztM0_level2_quad_clean.evt |
| Size (bytes) | 435,398,400 | 93,640,320 |
| Size | 415.2 MB | 89.3 MB |
| Events in quadrant A | 3,128,735 | 627,194 |
| Events in quadrant B | 4,131,150 | 636,858 |
| Events in quadrant C | 3,422,541 | 587,877 |
| Events in quadrant D | 4,923,856 | 525,581 |
| Mode M9 | |||
|---|---|---|---|
| Quadrant | BADHDUFLAG | Total packets | Discarded packets |
| A | 0 | 13 | 0 |
| B | 0 | 14 | 0 |
| C | 0 | 14 | 0 |
| D | 0 | 14 | 0 |
| Mode M0 | |||
|---|---|---|---|
| Quadrant | BADHDUFLAG | Total packets | Discarded packets |
| A | 0 | 14063 | 2 |
| B | 0 | 16921 | 2 |
| C | 0 | 15140 | 2 |
| D | 0 | 19247 | 2 |
| Mode SS | |||
|---|---|---|---|
| Quadrant | BADHDUFLAG | Total packets | Discarded packets |
| A | 0 | 132 | 0 |
| B | 0 | 132 | 0 |
| C | 0 | 132 | 0 |
| D | 0 | 132 | 0 |
| Quadrant | Total seconds | Saturated seconds | Saturation percentage |
|---|---|---|---|
| A | 6566 | 50 | 0.761499% |
| B | 6566 | 430 | 6.548888% |
| C | 6566 | 131 | 1.995126% |
| D | 6566 | 468 | 7.127627% |
Noise dominated data is calculated using 1-second bins in cleaned event files. If a bin has >2000 counts, and if more than 50% of those come from <1% of pixels, then it is considered to be noise-dominated and hence unusable.
| Quadrant | # 1 sec bins | Bins with >0 counts | Bins with >2000 counts | High rate bins dominated by noise | Noise dominated (total time) | Noise dominated (detector-on time) | Marked lightcurve |
|---|---|---|---|---|---|---|---|
| A | 7546 | 6567 | 28 | 28 | 0.37% | 0.43% | 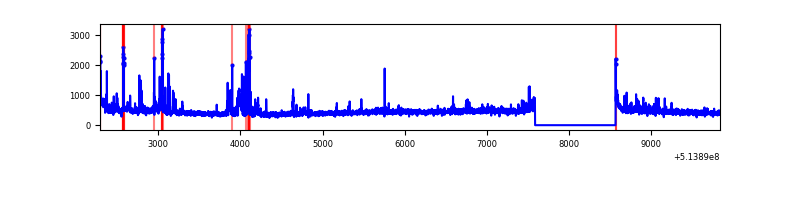 |
| B | 7546 | 6567 | 281 | 281 | 3.72% | 4.28% | 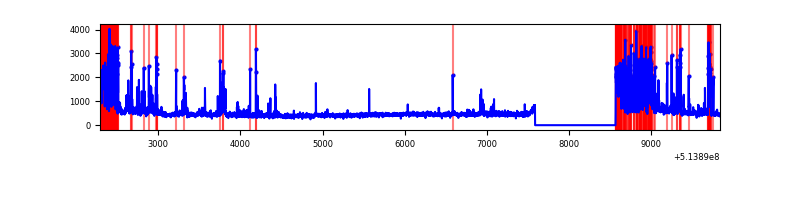 |
| C | 7546 | 6567 | 118 | 118 | 1.56% | 1.80% | 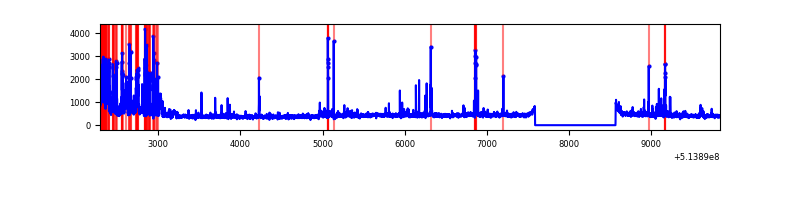 |
| D | 7546 | 6567 | 474 | 474 | 6.28% | 7.22% | 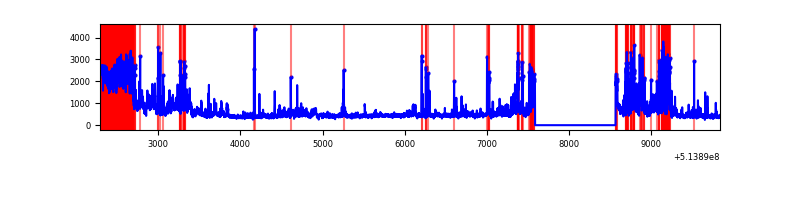 |
Top three noisy pixels from each quadrant. If the there are fewer than three noisy pixels in the level2.evt file, extra rows are filled as -1
| Pixel properties | Quadrant properties | ||||||
|---|---|---|---|---|---|---|---|
| Quadrant | DetID | PixID | Counts | Sigma | Mean | Median | Sigma |
| A | 3 | 14 | 278746 | 1581.14 | 706 | 686 | 175.9 |
| A | 13 | 248 | 28791 | 159.81 | 706 | 686 | 175.9 |
| A | 8 | 249 | 25797 | 142.79 | 706 | 686 | 175.9 |
| B | 10 | 16 | 991144 | 6865.49 | 675 | 650 | 144.3 |
| B | 0 | 63 | 265064 | 1832.75 | 675 | 650 | 144.3 |
| B | 0 | 213 | 58186 | 398.8 | 675 | 650 | 144.3 |
| C | 9 | 38 | 494386 | 2673.29 | 676 | 669 | 184.7 |
| C | 1 | 16 | 111028 | 597.55 | 676 | 669 | 184.7 |
| C | 14 | 254 | 109038 | 586.78 | 676 | 669 | 184.7 |
| D | 15 | 142 | 1215987 | 6480.25 | 659 | 629 | 187.5 |
| D | 12 | 33 | 326841 | 1739.35 | 659 | 629 | 187.5 |
| D | 2 | 249 | 297714 | 1584.05 | 659 | 629 | 187.5 |
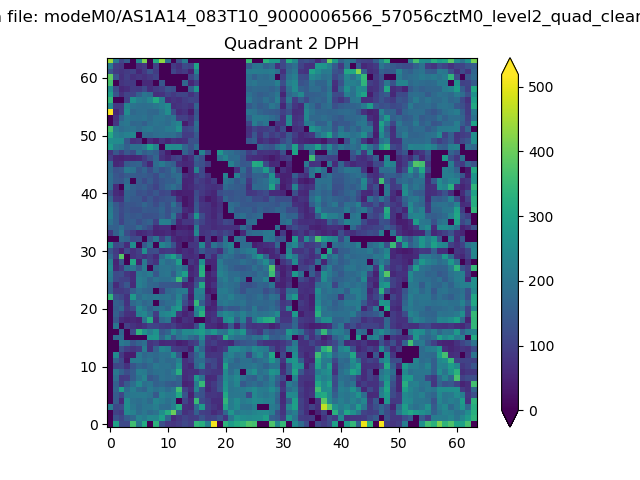
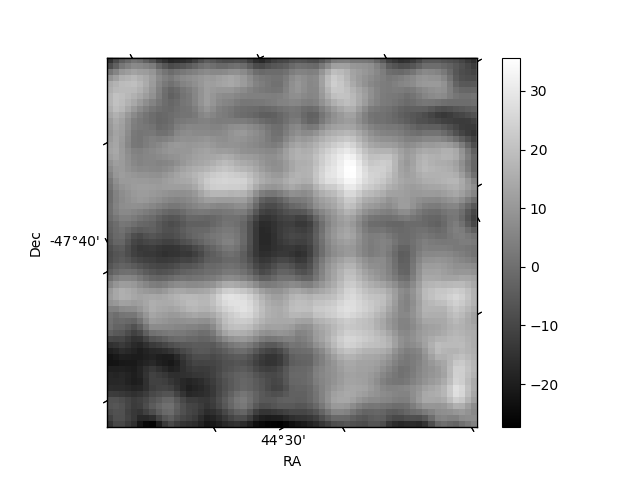
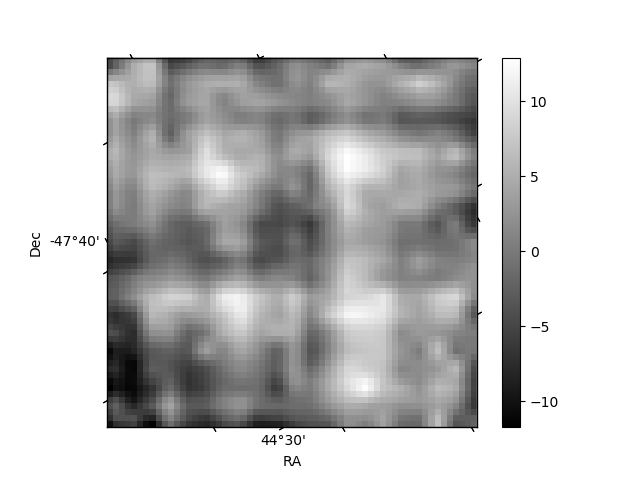
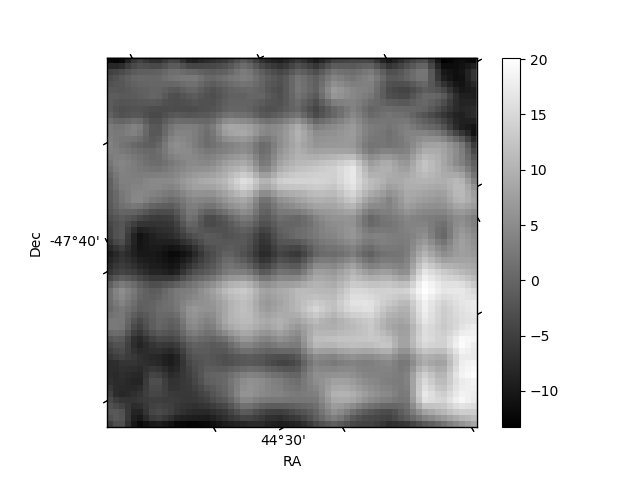
Histogram calculated using DETX and DETY for each event in the final _common_clean file
| Quadrant A | 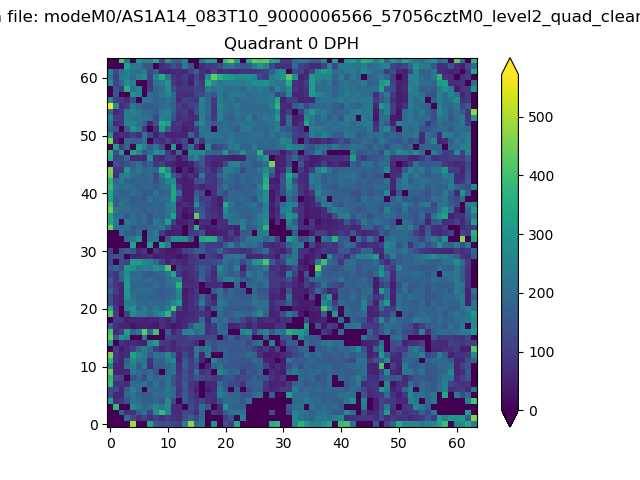 |
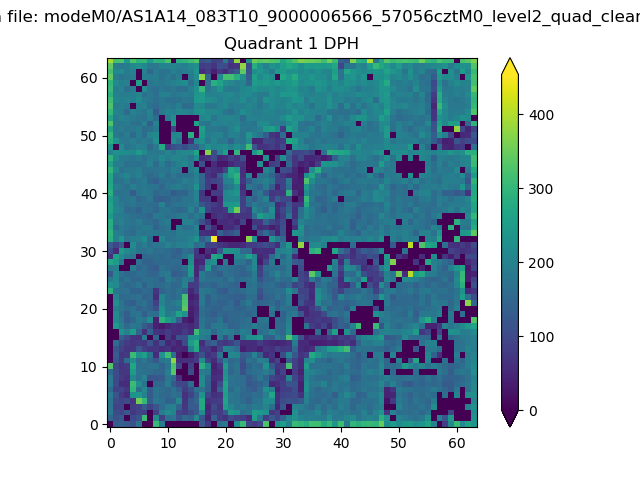 |
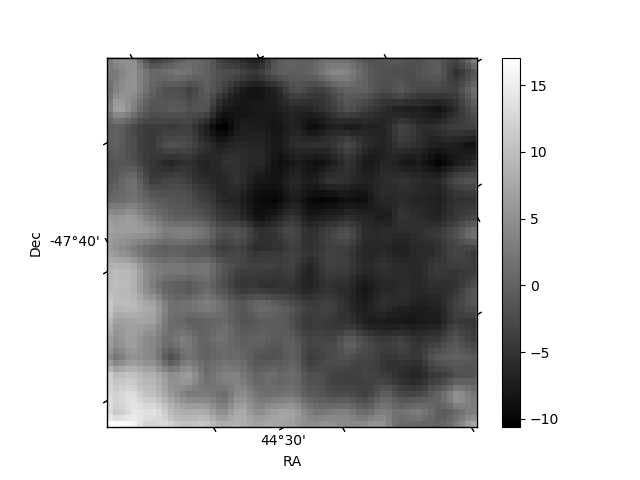
Quadrant B |
|---|---|---|---|
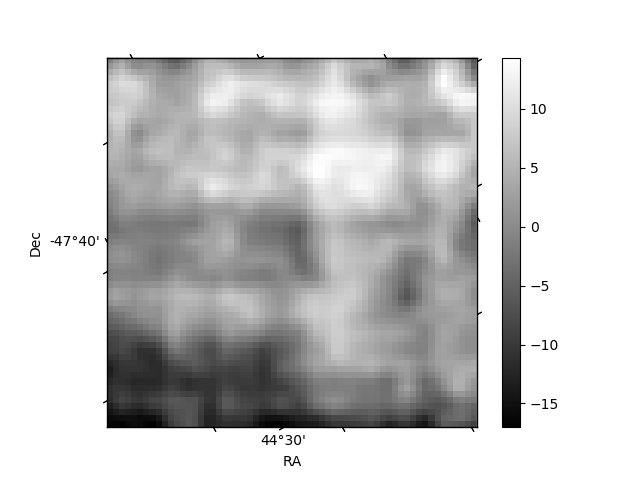
| Quadrant D | 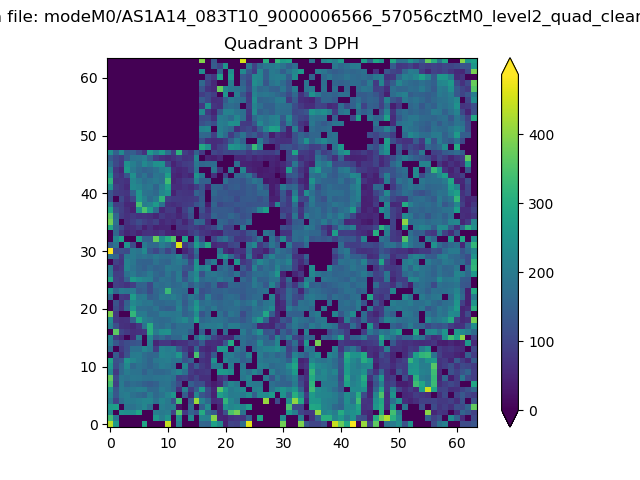 |
 |
Quadrant C |
| Plot type | Count rate plots | Images |
|---|---|---|
| Comparison with Poisson distribution Blue bars denote a histogram of data divided into 1 sec bins. Red curve is a Poisson curve with rate = median count rate of data. |
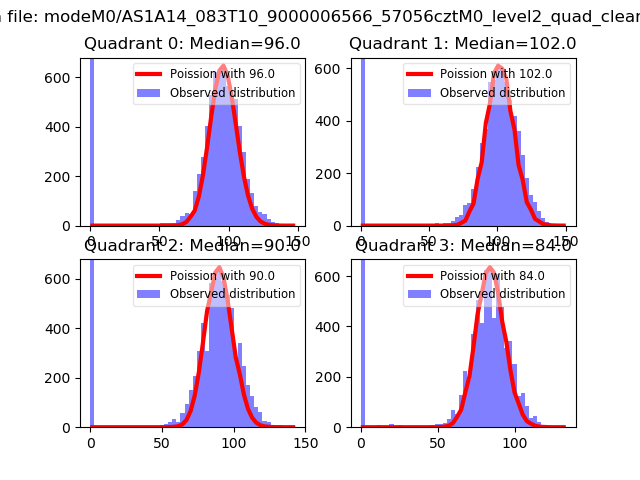 |
 |
| Quadrant-wise count rates Data is divided into 100 sec bins |
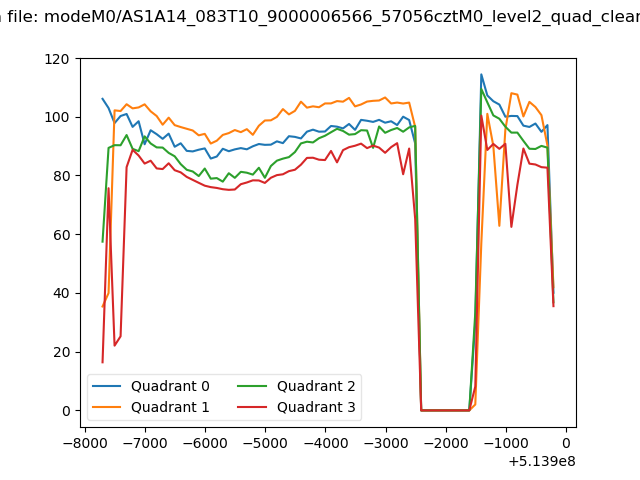 |
|
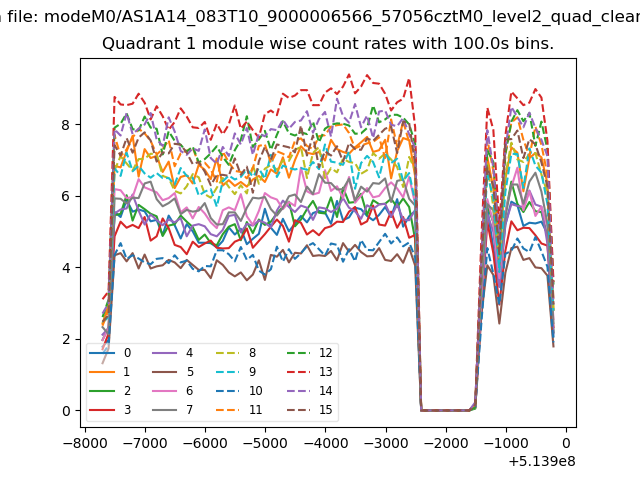
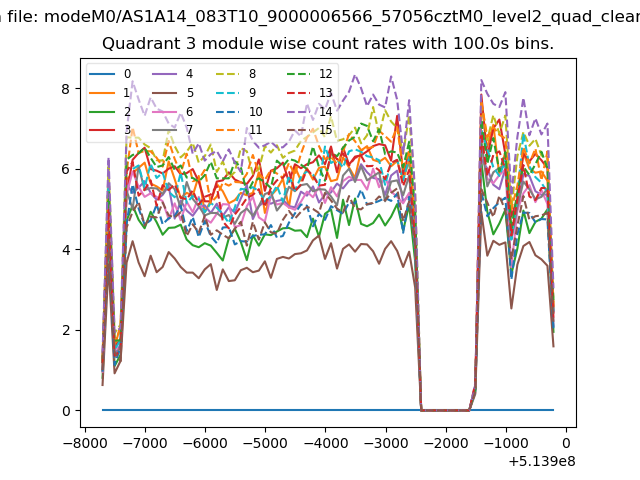
| Module-wise count rates for Quadrant A Data is divided into 100 sec bins |
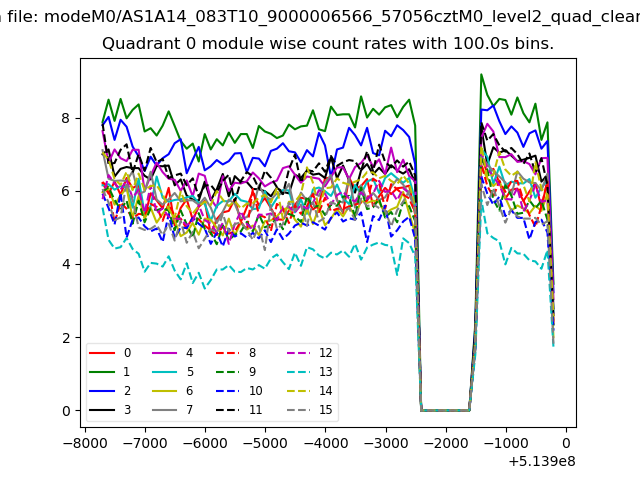 |
 |
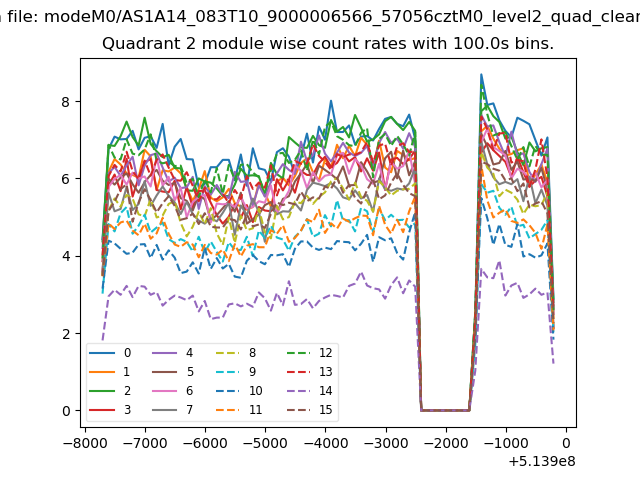
| Module-wise count rates for Quadrant B Data is divided into 100 sec bins |
 |
 |
| Module-wise count rates for Quadrant C Data is divided into 100 sec bins |
 |
 |
| Module-wise count rates for Quadrant D Data is divided into 100 sec bins |
 |
 |
| Parameter | Plot |
|---|---|
| CZT HV Monitor |  |
| D_VDD | 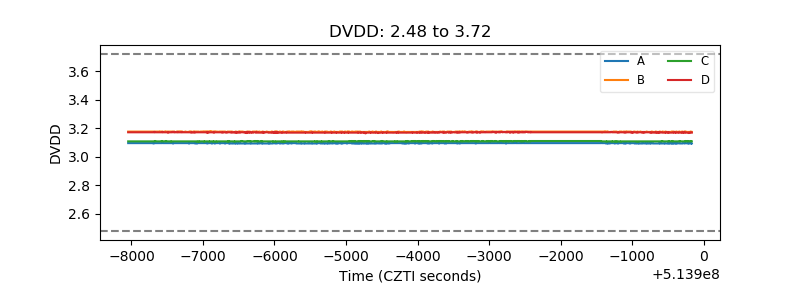 |
| Temperature 1 | 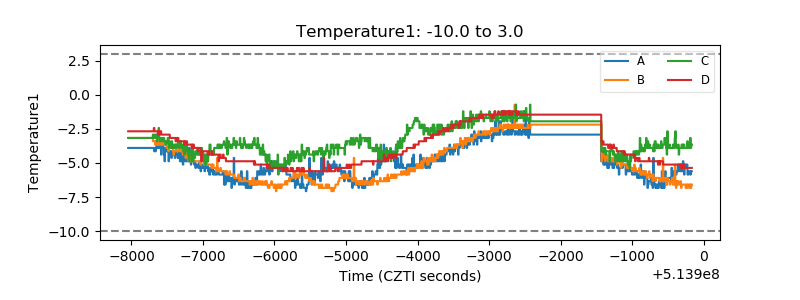 |
| Veto HV Monitor | 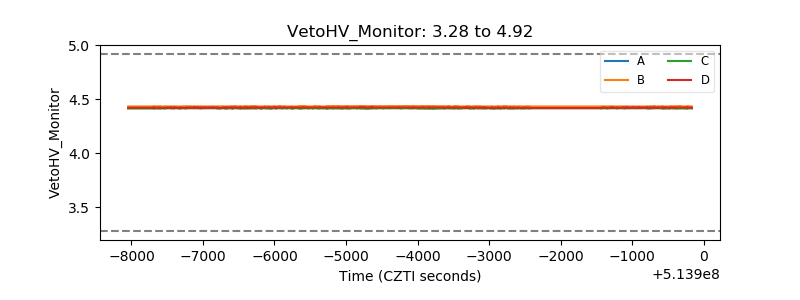 |
| Veto LLD | 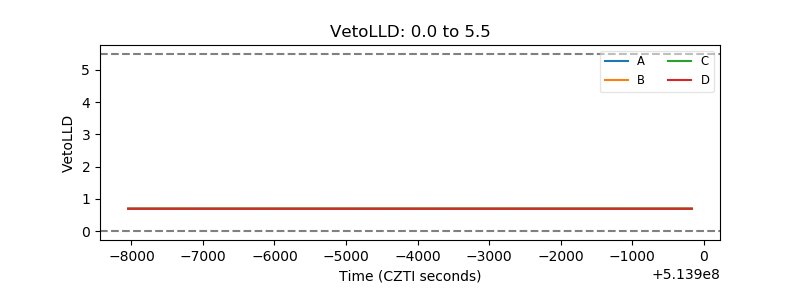 |
| Alpha Counter | 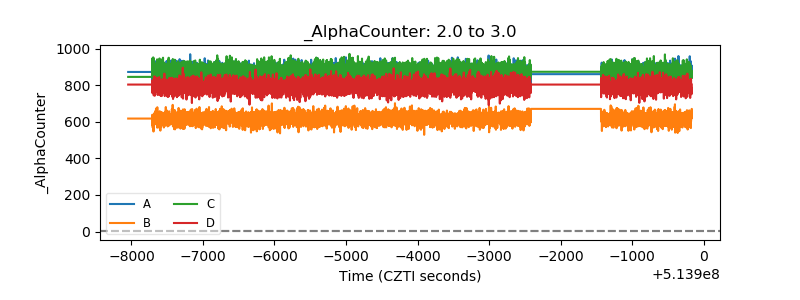 |
| _CPM_Rate | 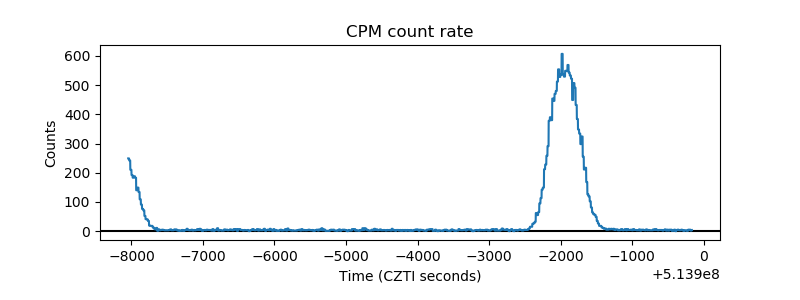 |
| CZT Counter | 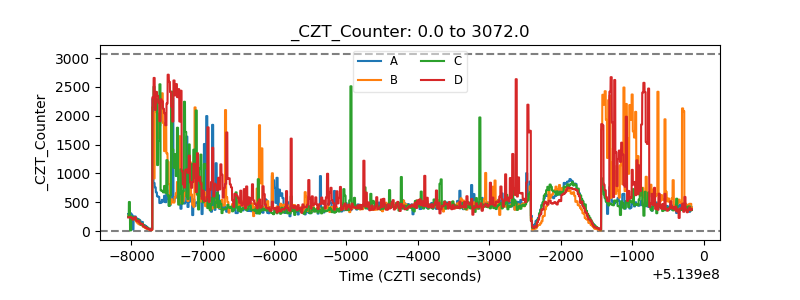 |
| +2.5 Volts monitor |  |
| +5 Volts monitor | 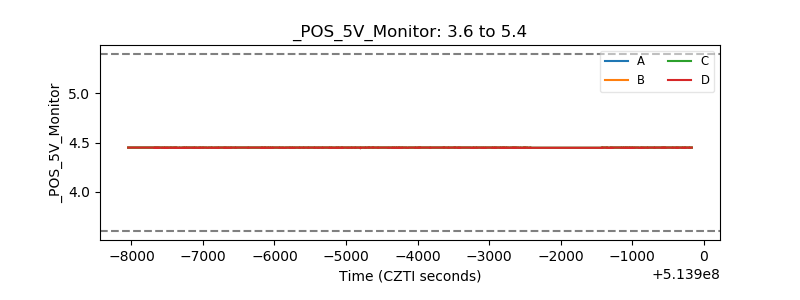 |
| _ROLL_ROT | 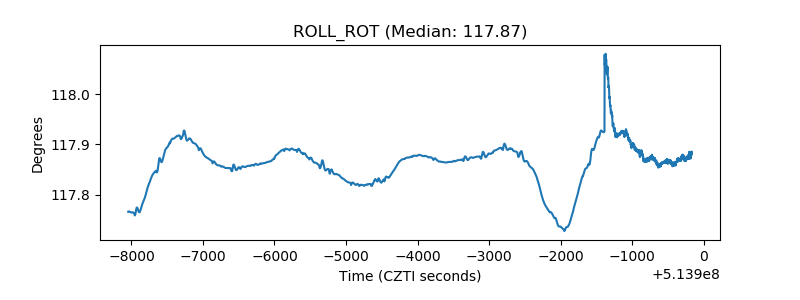 |
| _Roll_DEC | 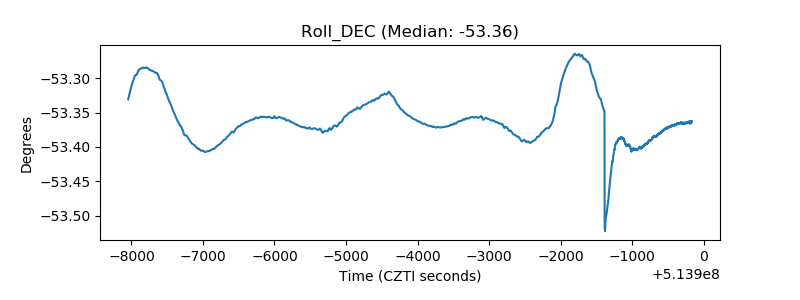 |
| _Roll_RA | 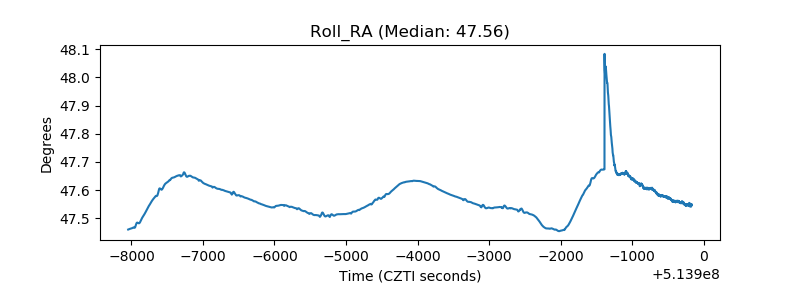 |
| Veto Counter | 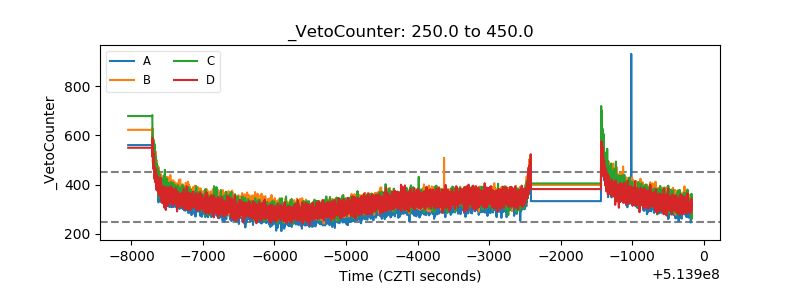 |