| Param | Original file | Final file |
|---|---|---|
| Filename | modeM0/AS1A14_083T10_9000006566_57057cztM0_level2.fits | modeM0/AS1A14_083T10_9000006566_57057cztM0_level2_quad_clean.evt |
| Size (bytes) | 402,658,560 | 94,170,240 |
| Size | 384.0 MB | 89.8 MB |
| Events in quadrant A | 2,885,280 | 631,535 |
| Events in quadrant B | 3,777,316 | 649,118 |
| Events in quadrant C | 3,073,681 | 597,449 |
| Events in quadrant D | 4,668,695 | 525,443 |
| Mode M9 | |||
|---|---|---|---|
| Quadrant | BADHDUFLAG | Total packets | Discarded packets |
| A | 0 | 15 | 0 |
| B | 0 | 16 | 0 |
| C | 0 | 16 | 0 |
| D | 0 | 16 | 0 |
| Mode M0 | |||
|---|---|---|---|
| Quadrant | BADHDUFLAG | Total packets | Discarded packets |
| A | 0 | 13272 | 2 |
| B | 0 | 15647 | 2 |
| C | 0 | 13637 | 2 |
| D | 0 | 18343 | 2 |
| Mode SS | |||
|---|---|---|---|
| Quadrant | BADHDUFLAG | Total packets | Discarded packets |
| A | 0 | 130 | 0 |
| B | 0 | 130 | 0 |
| C | 0 | 130 | 0 |
| D | 0 | 130 | 0 |
| Quadrant | Total seconds | Saturated seconds | Saturation percentage |
|---|---|---|---|
| A | 6423 | 23 | 0.358088% |
| B | 6423 | 339 | 5.277908% |
| C | 6423 | 29 | 0.451502% |
| D | 6423 | 444 | 6.912658% |
Noise dominated data is calculated using 1-second bins in cleaned event files. If a bin has >2000 counts, and if more than 50% of those come from <1% of pixels, then it is considered to be noise-dominated and hence unusable.
| Quadrant | # 1 sec bins | Bins with >0 counts | Bins with >2000 counts | High rate bins dominated by noise | Noise dominated (total time) | Noise dominated (detector-on time) | Marked lightcurve |
|---|---|---|---|---|---|---|---|
| A | 7524 | 6424 | 6 | 6 | 0.08% | 0.09% | 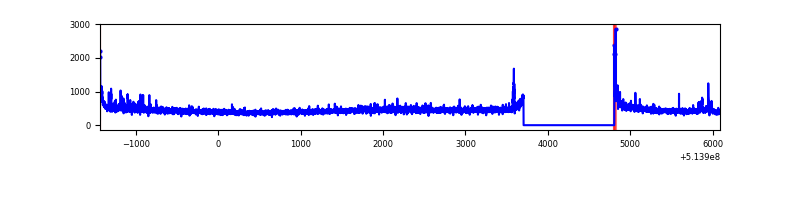 |
| B | 7524 | 6424 | 229 | 229 | 3.04% | 3.56% | 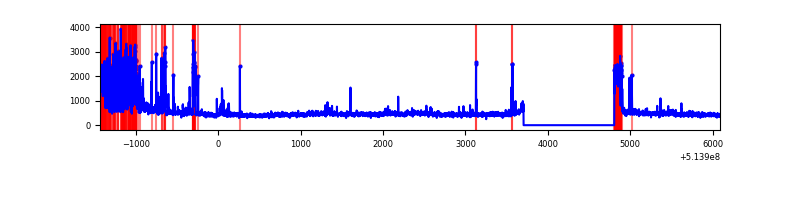 |
| C | 7524 | 6424 | 14 | 14 | 0.19% | 0.22% | 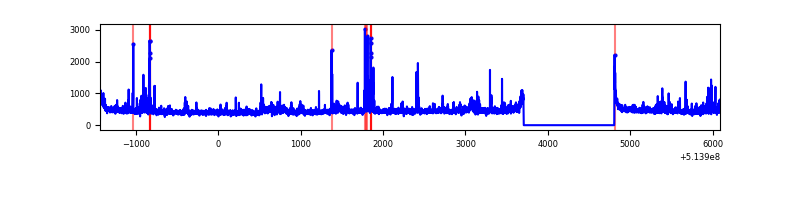 |
| D | 7524 | 6424 | 401 | 401 | 5.33% | 6.24% | 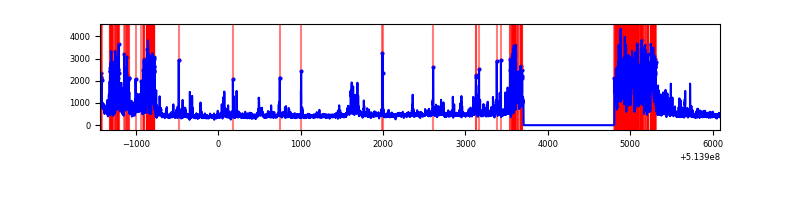 |
Top three noisy pixels from each quadrant. If the there are fewer than three noisy pixels in the level2.evt file, extra rows are filled as -1
| Pixel properties | Quadrant properties | ||||||
|---|---|---|---|---|---|---|---|
| Quadrant | DetID | PixID | Counts | Sigma | Mean | Median | Sigma |
| A | 3 | 14 | 86021 | 498.44 | 698 | 680 | 171.2 |
| A | 8 | 249 | 24561 | 139.48 | 698 | 680 | 171.2 |
| A | 4 | 3 | 19398 | 109.32 | 698 | 680 | 171.2 |
| B | 10 | 16 | 731300 | 5073.17 | 673 | 650 | 144.0 |
| B | 0 | 63 | 231458 | 1602.59 | 673 | 650 | 144.0 |
| B | 0 | 213 | 73267 | 504.21 | 673 | 650 | 144.0 |
| C | 1 | 16 | 82011 | 444.23 | 679 | 672 | 183.1 |
| C | 12 | 254 | 78684 | 426.06 | 679 | 672 | 183.1 |
| C | 15 | 209 | 64600 | 349.14 | 679 | 672 | 183.1 |
| D | 12 | 33 | 892037 | 4870.77 | 649 | 619 | 183.0 |
| D | 12 | 251 | 478882 | 2613.26 | 649 | 619 | 183.0 |
| D | 2 | 249 | 192391 | 1047.86 | 649 | 619 | 183.0 |
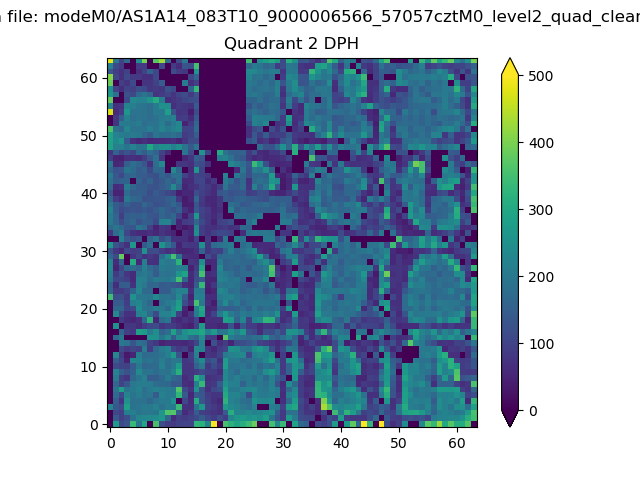
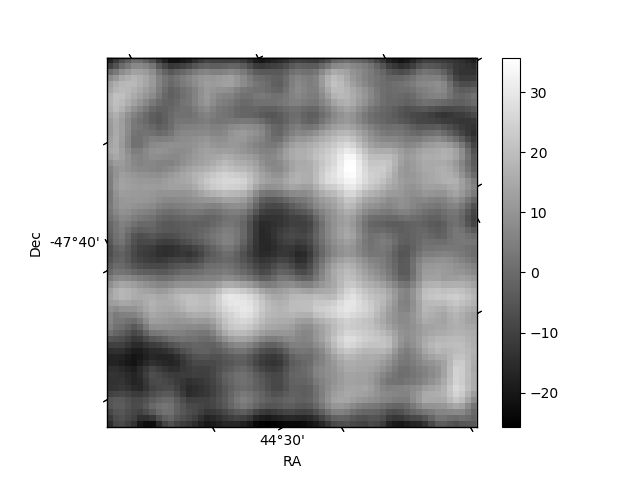
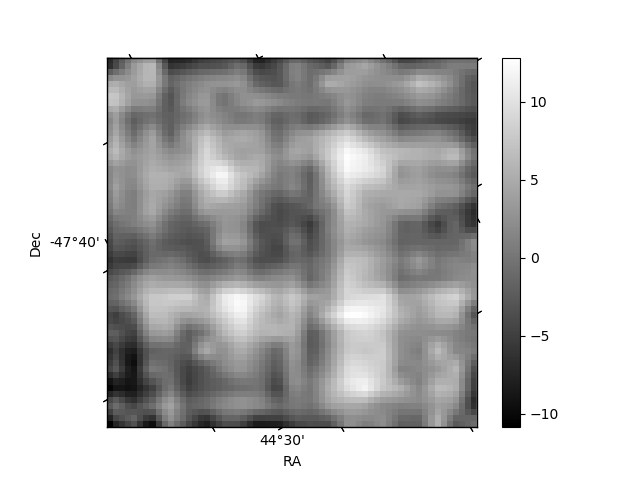
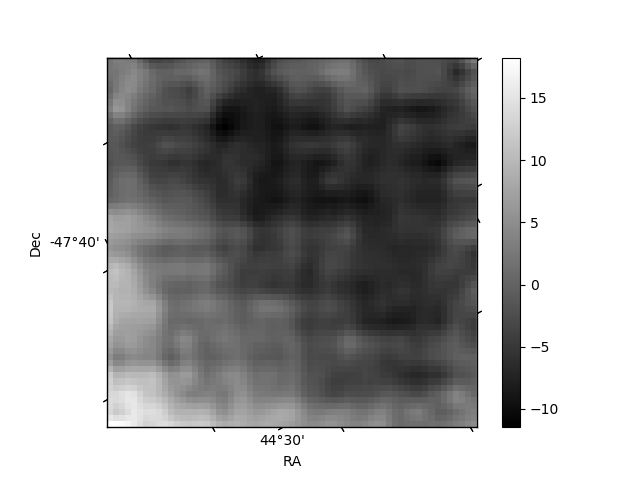
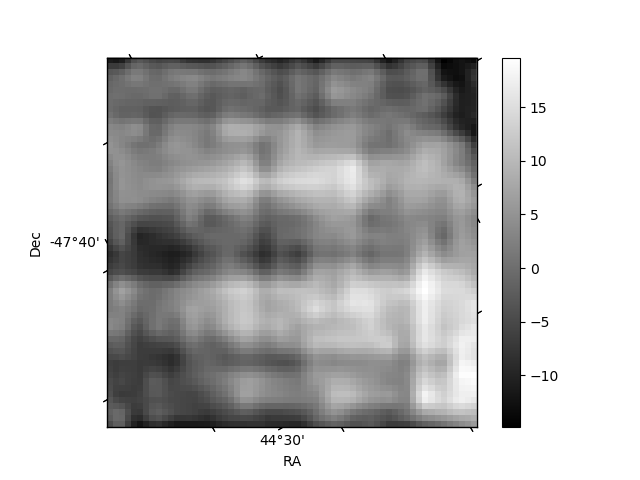
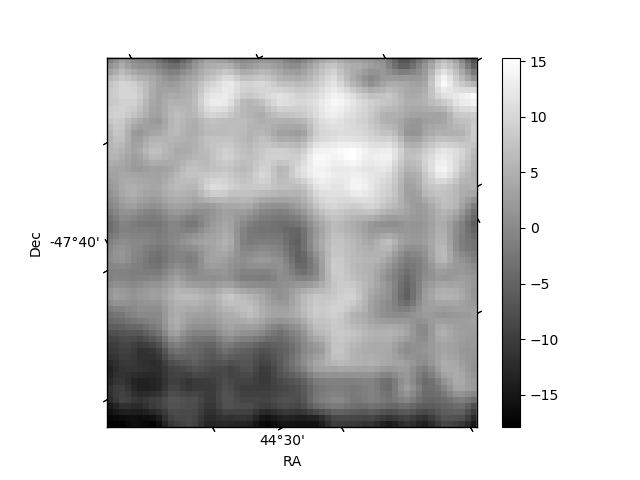
Histogram calculated using DETX and DETY for each event in the final _common_clean file
| Quadrant A | 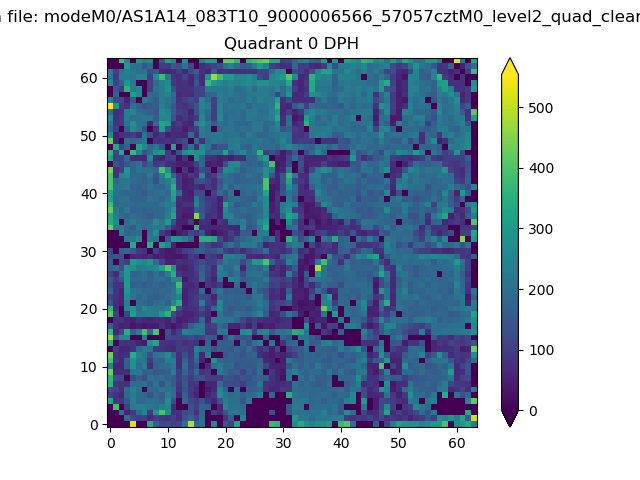 |
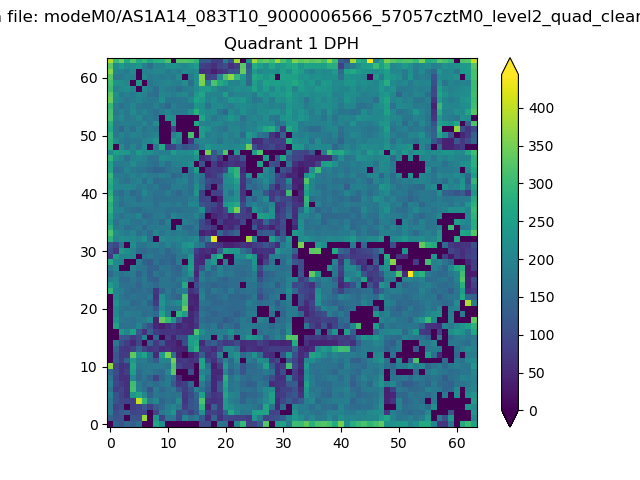 |
Quadrant B |
|---|---|---|---|
| Quadrant D | 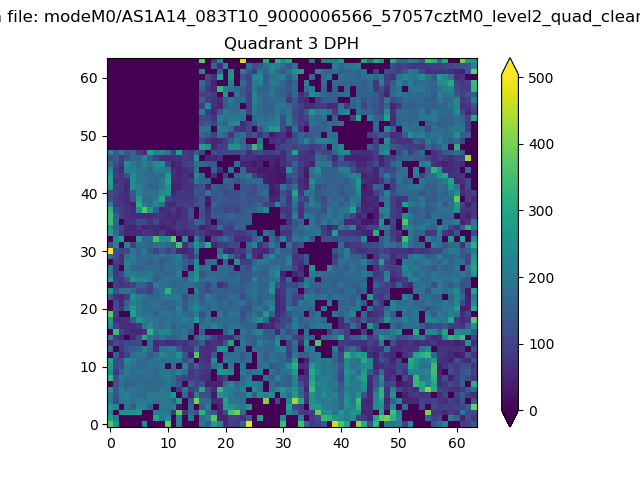 |
 |
Quadrant C |
| Plot type | Count rate plots | Images |
|---|---|---|
| Comparison with Poisson distribution Blue bars denote a histogram of data divided into 1 sec bins. Red curve is a Poisson curve with rate = median count rate of data. |
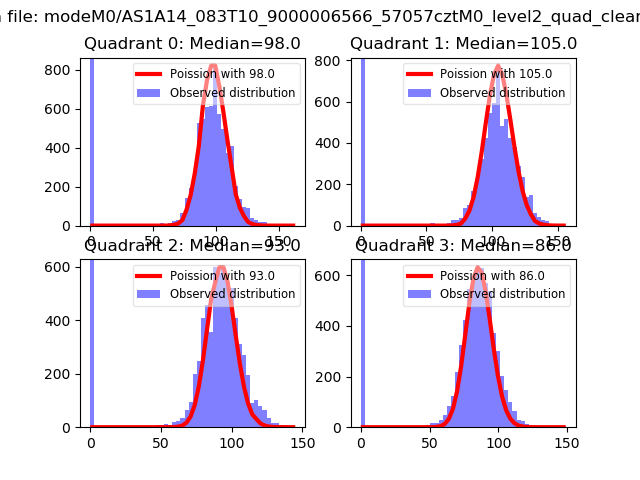 |
 |
| Quadrant-wise count rates Data is divided into 100 sec bins |
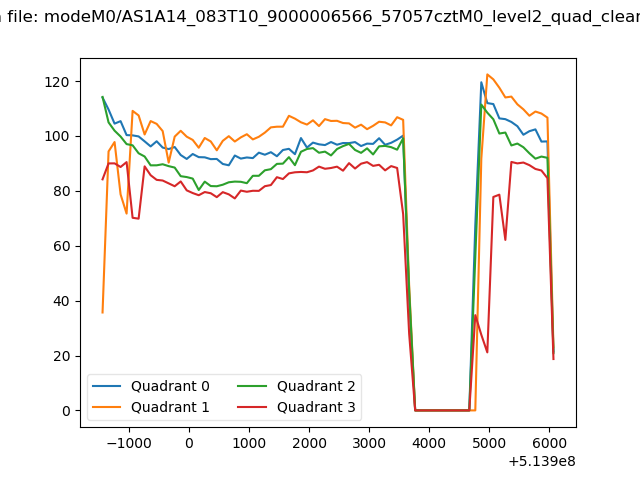 |
|
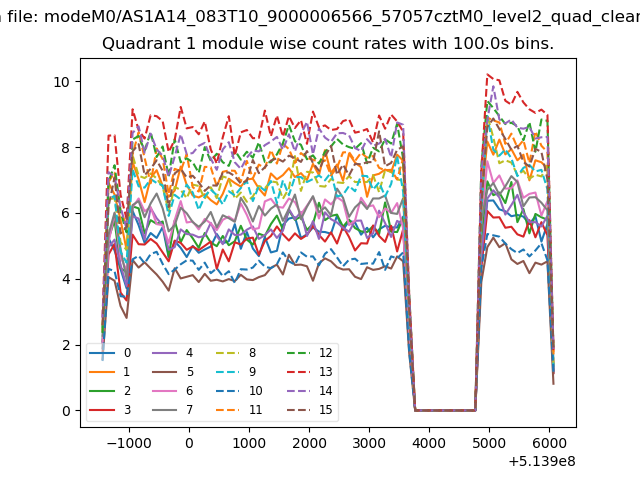
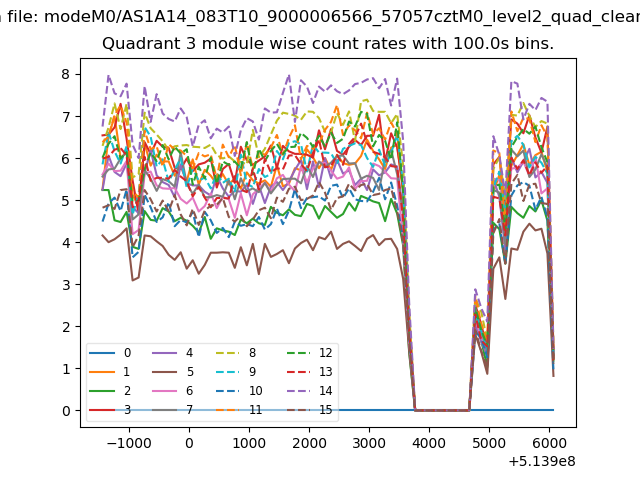
| Module-wise count rates for Quadrant A Data is divided into 100 sec bins |
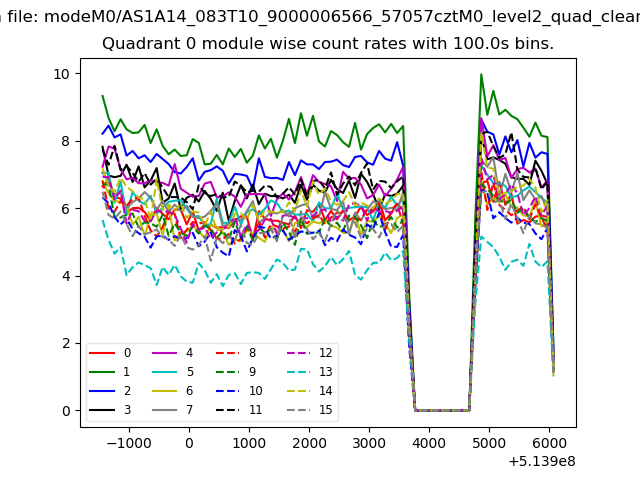 |
 |
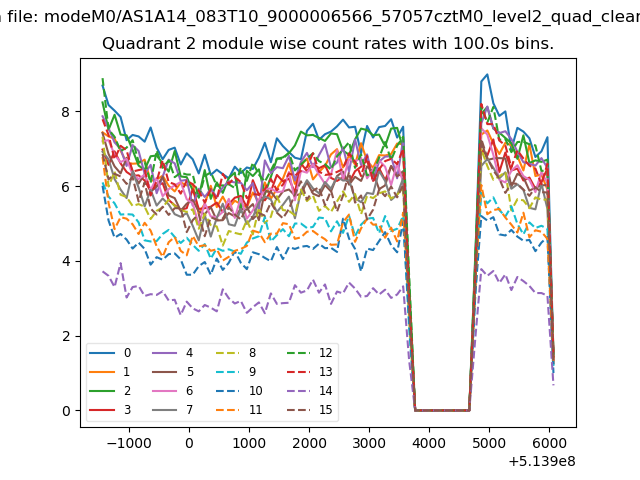
| Module-wise count rates for Quadrant B Data is divided into 100 sec bins |
 |
 |
| Module-wise count rates for Quadrant C Data is divided into 100 sec bins |
 |
 |
| Module-wise count rates for Quadrant D Data is divided into 100 sec bins |
 |
 |
| Parameter | Plot |
|---|---|
| CZT HV Monitor | 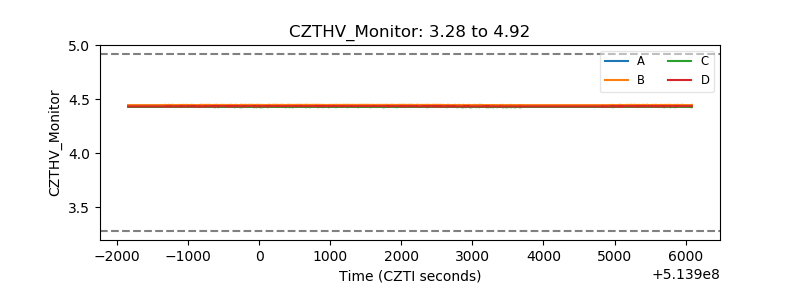 |
| D_VDD | 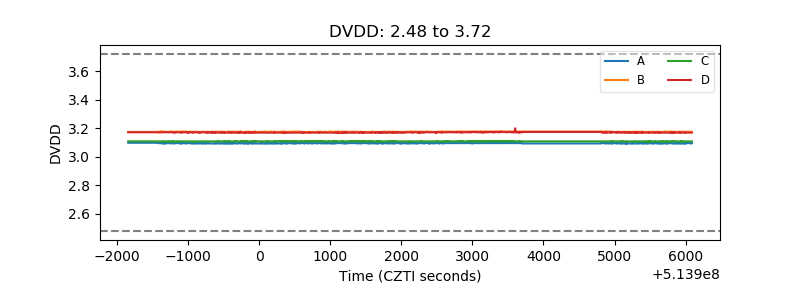 |
| Temperature 1 | 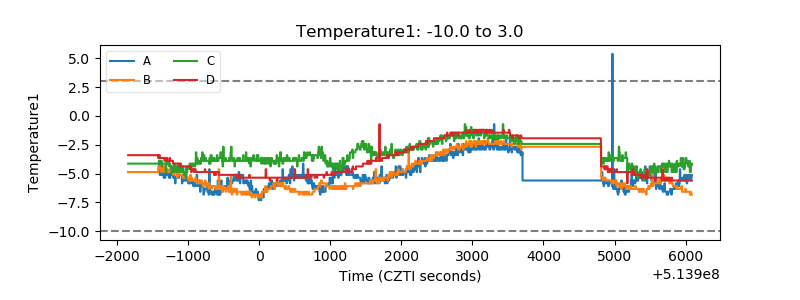 |
| Veto HV Monitor | 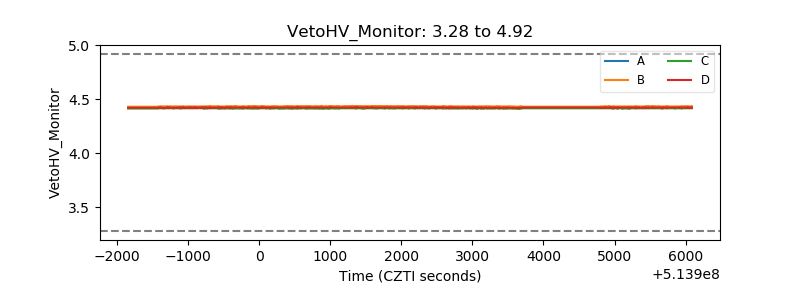 |
| Veto LLD | 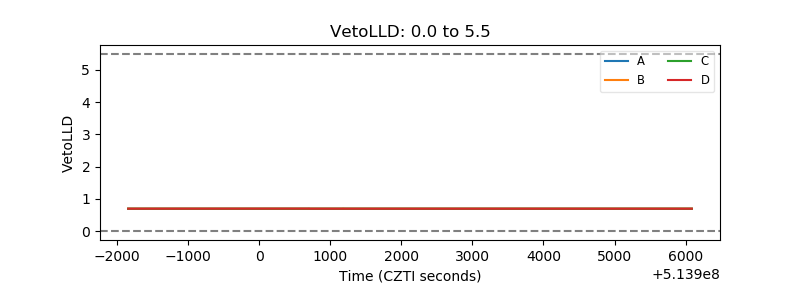 |
| Alpha Counter | 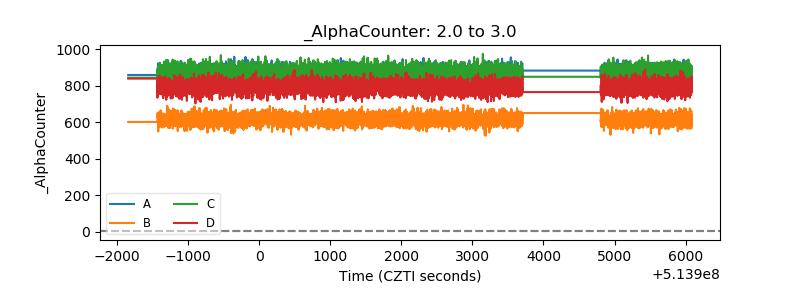 |
| _CPM_Rate | 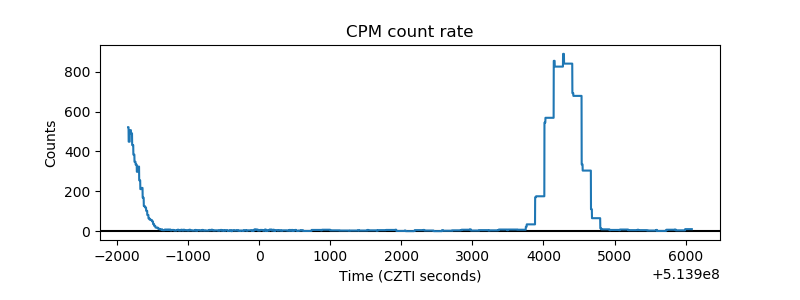 |
| CZT Counter | 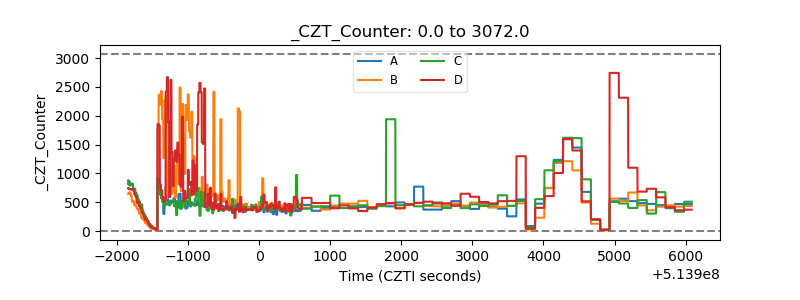 |
| +2.5 Volts monitor |  |
| +5 Volts monitor | 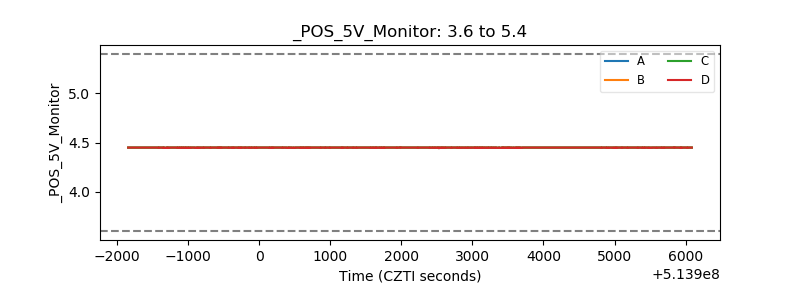 |
| _ROLL_ROT | 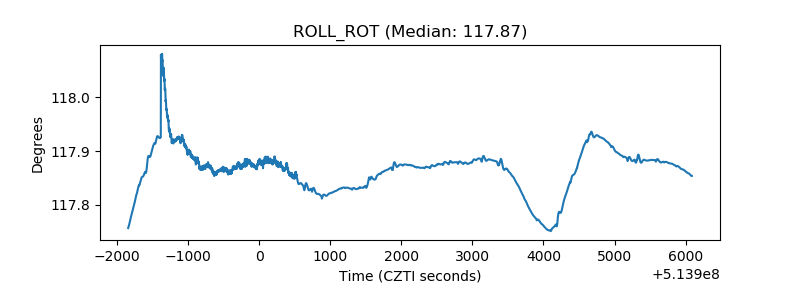 |
| _Roll_DEC | 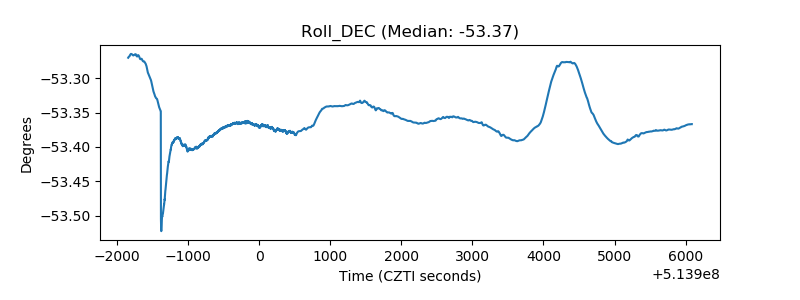 |
| _Roll_RA | 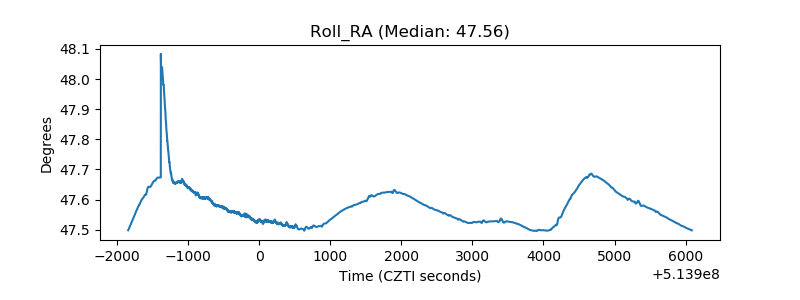 |
| Veto Counter | 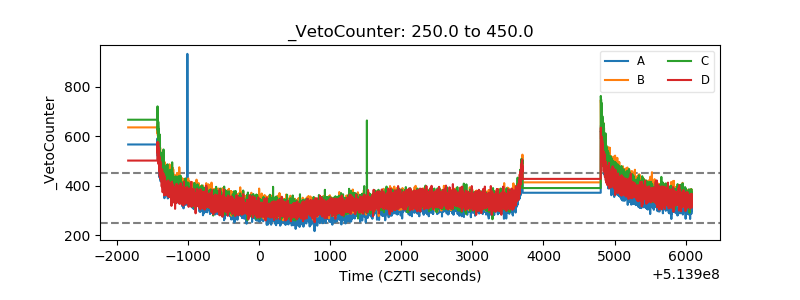 |