| Param | Original file | Final file |
|---|---|---|
| Filename | modeM0/AS1A14_083T10_9000006566_57058cztM0_level2.fits | modeM0/AS1A14_083T10_9000006566_57058cztM0_level2_quad_clean.evt |
| Size (bytes) | 408,435,840 | 101,329,920 |
| Size | 389.5 MB | 96.6 MB |
| Events in quadrant A | 3,073,627 | 677,991 |
| Events in quadrant B | 3,456,546 | 711,580 |
| Events in quadrant C | 3,264,921 | 644,355 |
| Events in quadrant D | 4,801,692 | 566,421 |
| Mode M9 | |||
|---|---|---|---|
| Quadrant | BADHDUFLAG | Total packets | Discarded packets |
| A | 0 | 22 | 0 |
| B | 0 | 22 | 0 |
| C | 0 | 22 | 0 |
| D | 0 | 22 | 0 |
| Mode M0 | |||
|---|---|---|---|
| Quadrant | BADHDUFLAG | Total packets | Discarded packets |
| A | 0 | 14001 | 2 |
| B | 0 | 14964 | 2 |
| C | 0 | 14364 | 2 |
| D | 0 | 18915 | 2 |
| Mode SS | |||
|---|---|---|---|
| Quadrant | BADHDUFLAG | Total packets | Discarded packets |
| A | 0 | 140 | 0 |
| B | 0 | 140 | 0 |
| C | 0 | 140 | 0 |
| D | 0 | 140 | 0 |
| Quadrant | Total seconds | Saturated seconds | Saturation percentage |
|---|---|---|---|
| A | 6708 | 40 | 0.596303% |
| B | 6709 | 235 | 3.502757% |
| C | 6709 | 44 | 0.655835% |
| D | 6709 | 435 | 6.483828% |
Noise dominated data is calculated using 1-second bins in cleaned event files. If a bin has >2000 counts, and if more than 50% of those come from <1% of pixels, then it is considered to be noise-dominated and hence unusable.
| Quadrant | # 1 sec bins | Bins with >0 counts | Bins with >2000 counts | High rate bins dominated by noise | Noise dominated (total time) | Noise dominated (detector-on time) | Marked lightcurve |
|---|---|---|---|---|---|---|---|
| A | 8999 | 6710 | 11 | 11 | 0.12% | 0.16% | 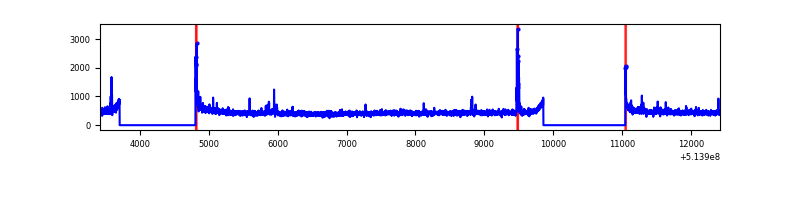 |
| B | 9000 | 6711 | 133 | 133 | 1.48% | 1.98% | 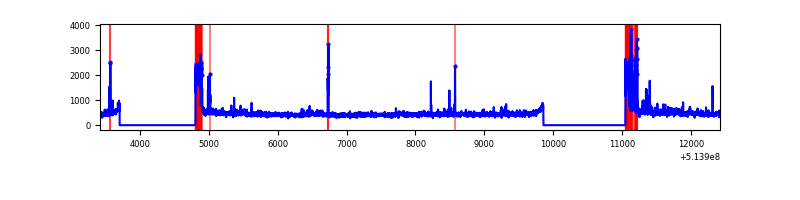 |
| C | 9000 | 6711 | 19 | 19 | 0.21% | 0.28% | 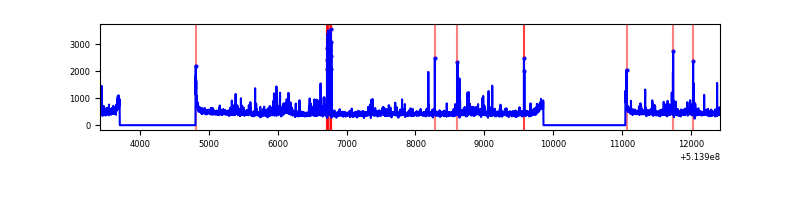 |
| D | 9000 | 6711 | 386 | 386 | 4.29% | 5.75% | 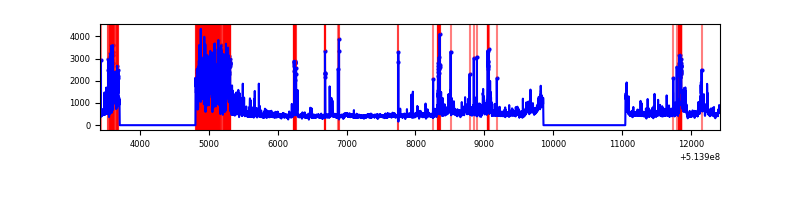 |
Top three noisy pixels from each quadrant. If the there are fewer than three noisy pixels in the level2.evt file, extra rows are filled as -1
| Pixel properties | Quadrant properties | ||||||
|---|---|---|---|---|---|---|---|
| Quadrant | DetID | PixID | Counts | Sigma | Mean | Median | Sigma |
| A | 3 | 14 | 83874 | 453.91 | 747 | 730 | 183.2 |
| A | 4 | 3 | 20752 | 109.31 | 747 | 730 | 183.2 |
| A | 8 | 249 | 14165 | 73.35 | 747 | 730 | 183.2 |
| B | 10 | 16 | 429427 | 2782.72 | 726 | 700 | 154.1 |
| B | 0 | 63 | 70340 | 452.01 | 726 | 700 | 154.1 |
| B | 10 | 247 | 37259 | 237.29 | 726 | 700 | 154.1 |
| C | 1 | 16 | 82243 | 409.33 | 730 | 721 | 199.2 |
| C | 9 | 38 | 73989 | 367.89 | 730 | 721 | 199.2 |
| C | 12 | 252 | 63542 | 315.43 | 730 | 721 | 199.2 |
| D | 12 | 33 | 805227 | 4077.39 | 698 | 664 | 197.3 |
| D | 12 | 251 | 473810 | 2397.82 | 698 | 664 | 197.3 |
| D | 15 | 142 | 264622 | 1337.69 | 698 | 664 | 197.3 |
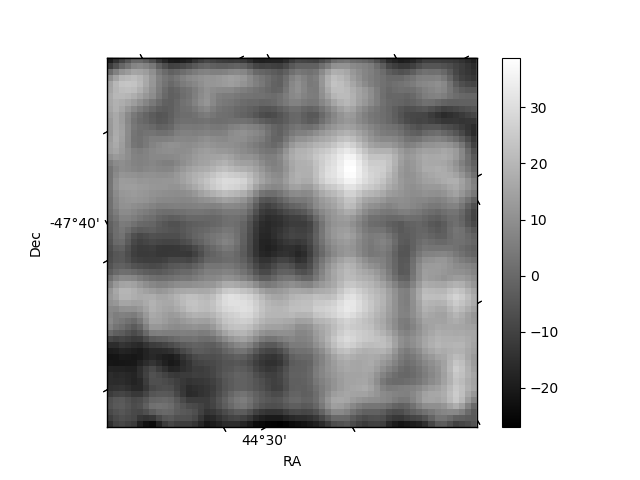
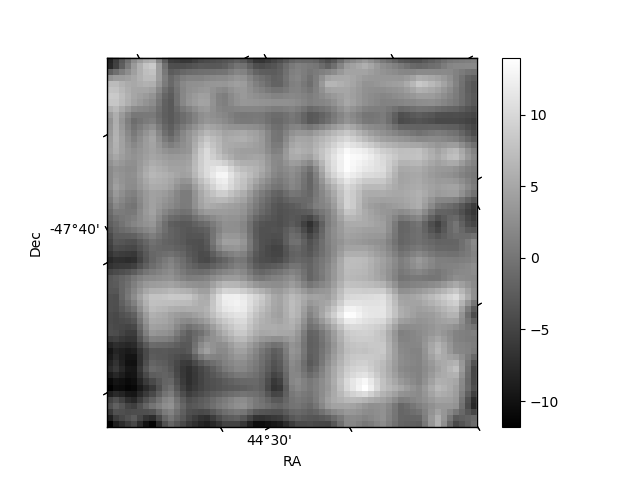
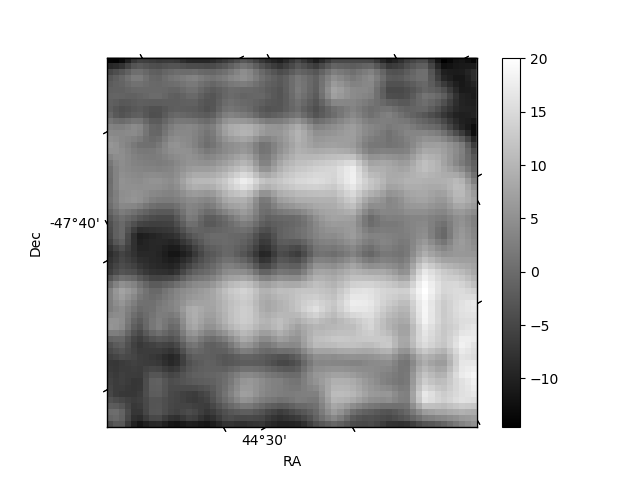
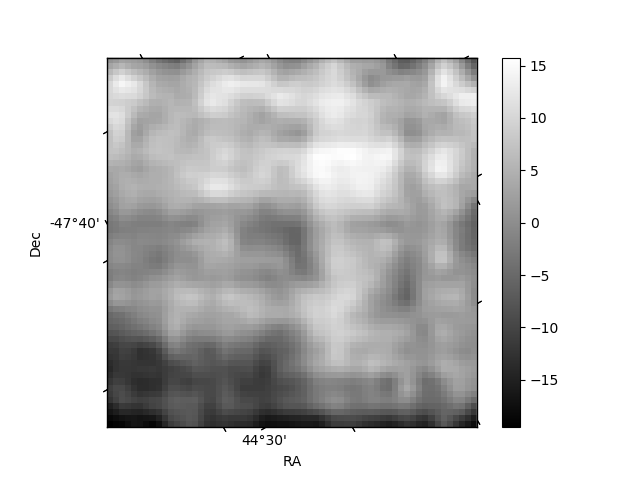
Histogram calculated using DETX and DETY for each event in the final _common_clean file
| Quadrant A | 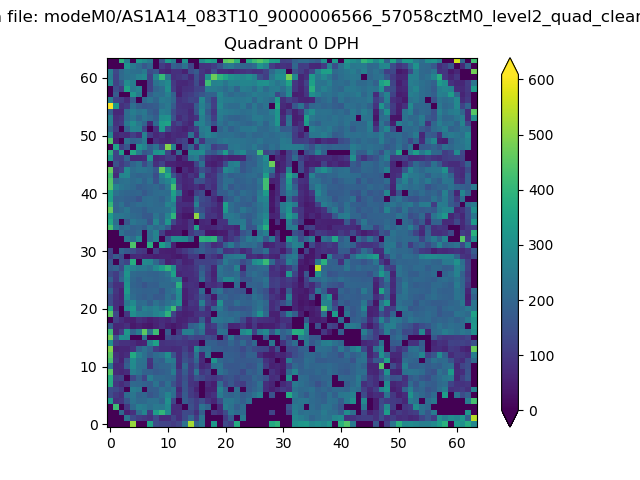 |
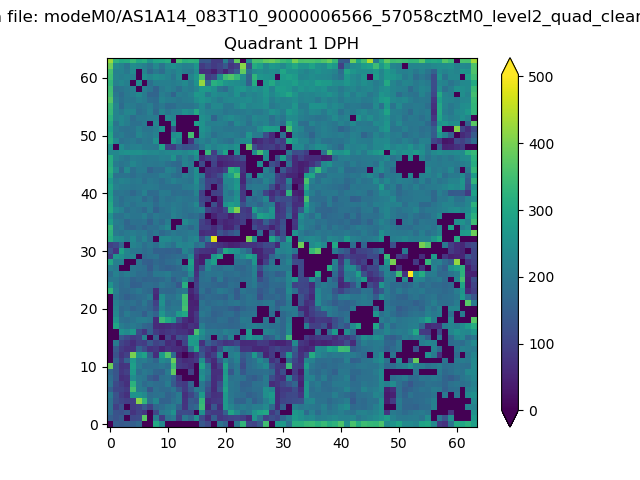 |
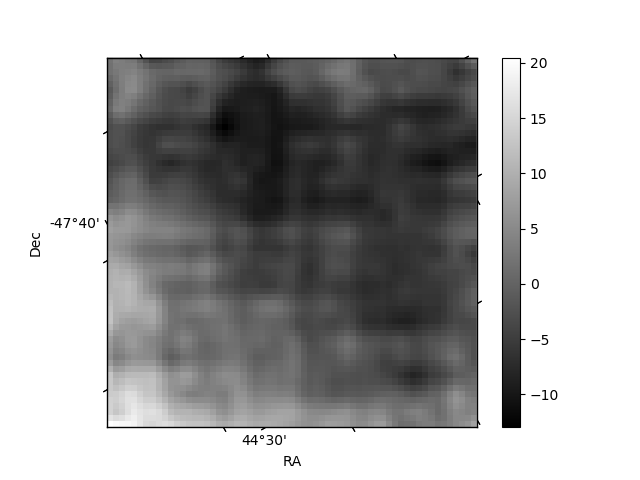
Quadrant B |
|---|---|---|---|
| Quadrant D | 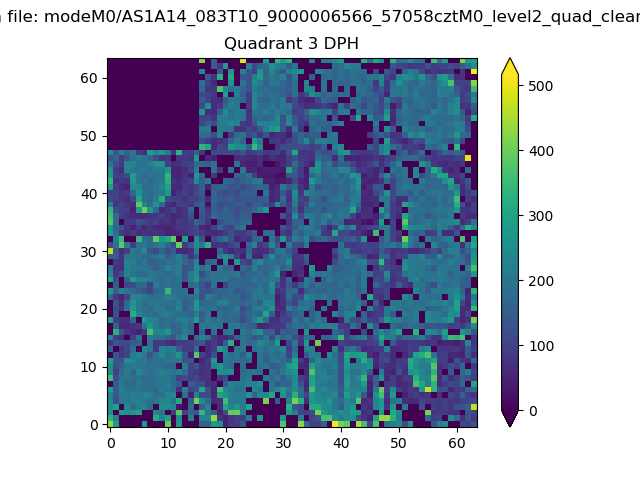 |
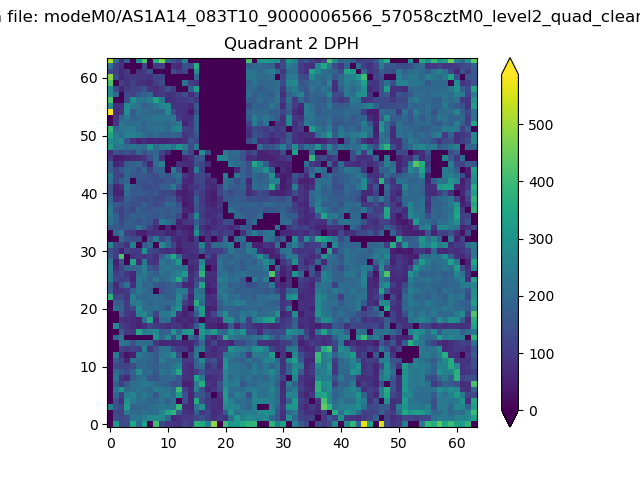 |
Quadrant C |
| Plot type | Count rate plots | Images |
|---|---|---|
| Comparison with Poisson distribution Blue bars denote a histogram of data divided into 1 sec bins. Red curve is a Poisson curve with rate = median count rate of data. |
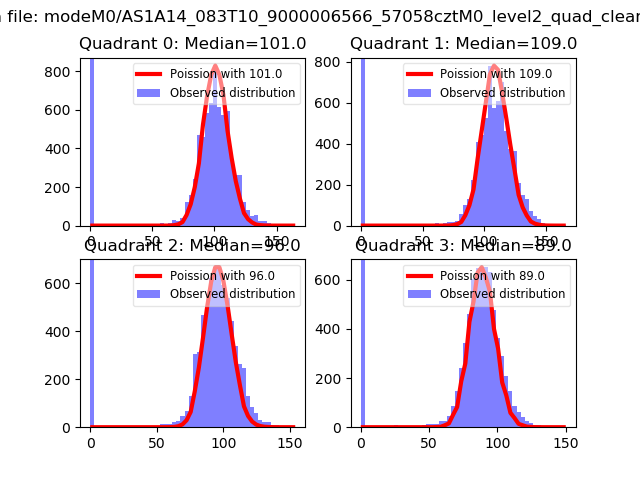 |
 |
| Quadrant-wise count rates Data is divided into 100 sec bins |
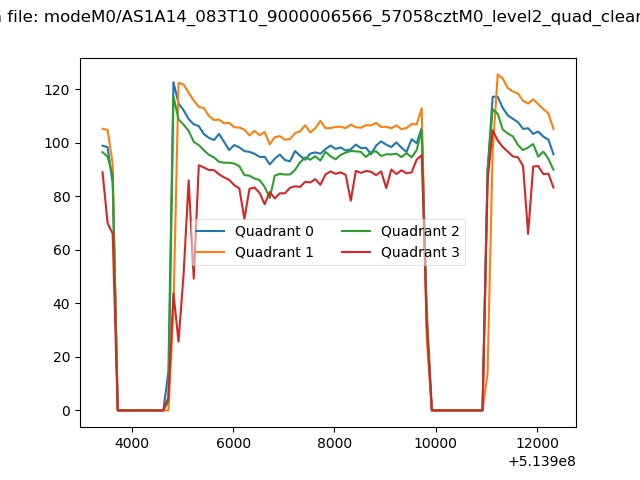 |
|
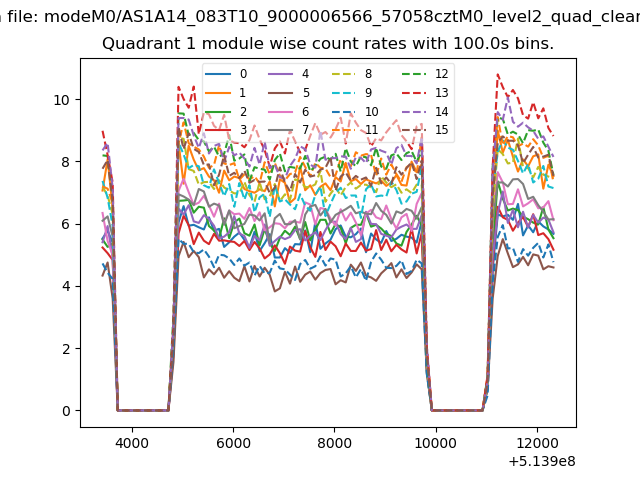
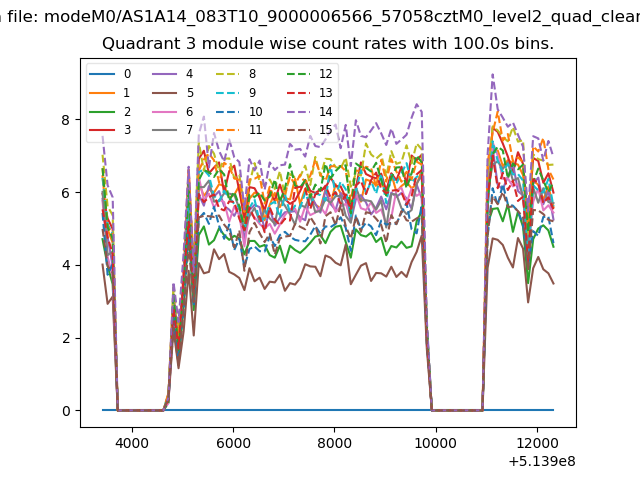
| Module-wise count rates for Quadrant A Data is divided into 100 sec bins |
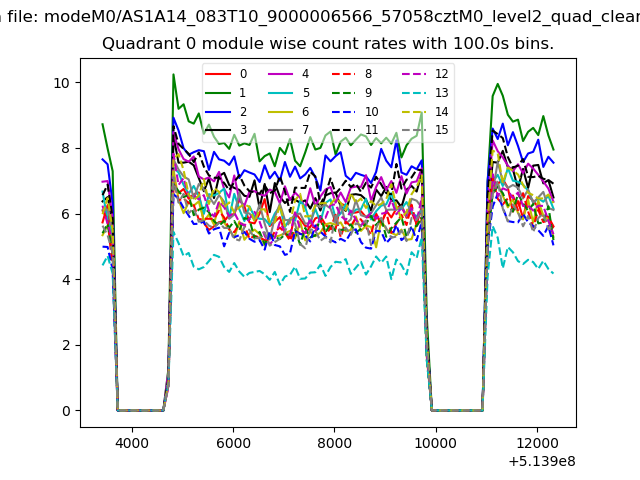 |
 |
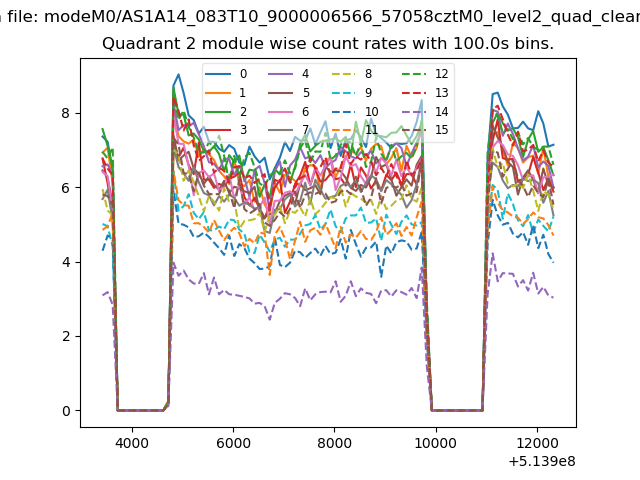
| Module-wise count rates for Quadrant B Data is divided into 100 sec bins |
 |
 |
| Module-wise count rates for Quadrant C Data is divided into 100 sec bins |
 |
 |
| Module-wise count rates for Quadrant D Data is divided into 100 sec bins |
 |
 |
| Parameter | Plot |
|---|---|
| CZT HV Monitor | 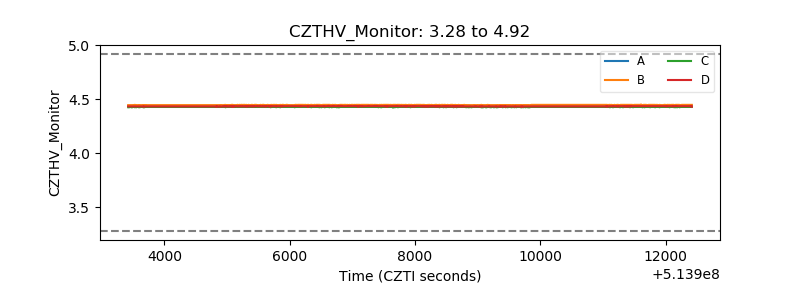 |
| D_VDD | 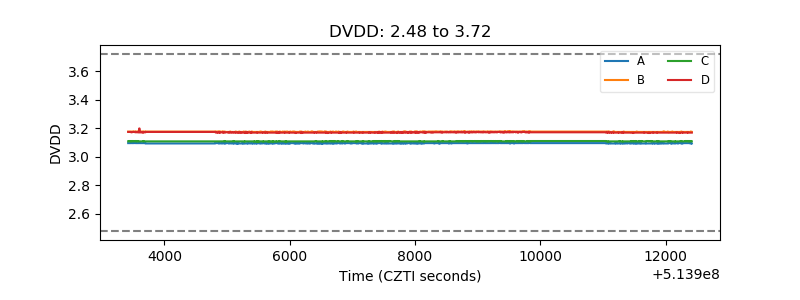 |
| Temperature 1 | 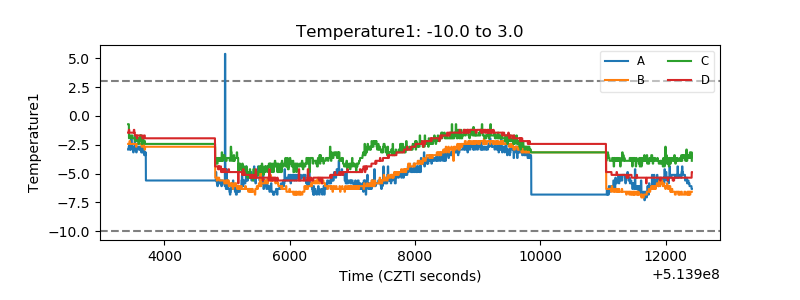 |
| Veto HV Monitor | 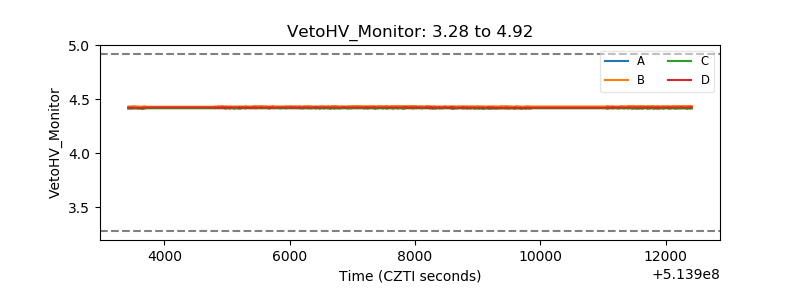 |
| Veto LLD | 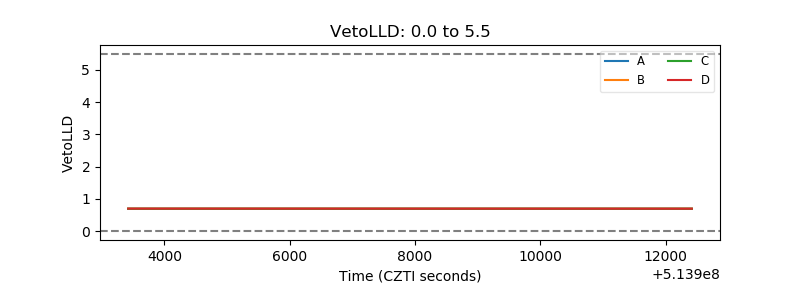 |
| Alpha Counter | 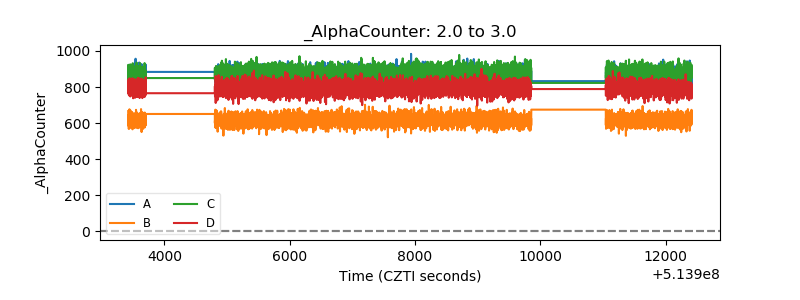 |
| _CPM_Rate | 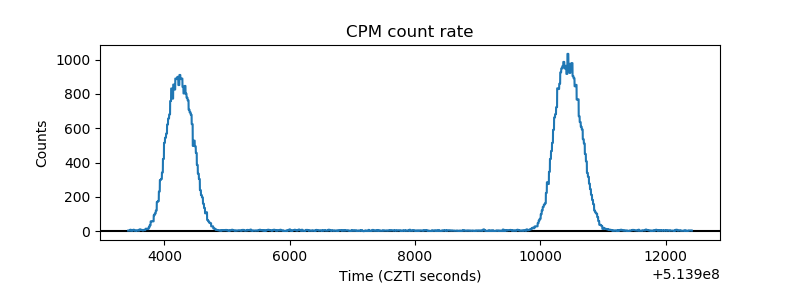 |
| CZT Counter | 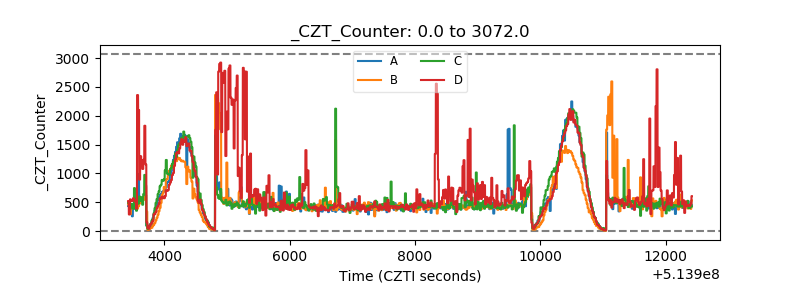 |
| +2.5 Volts monitor | 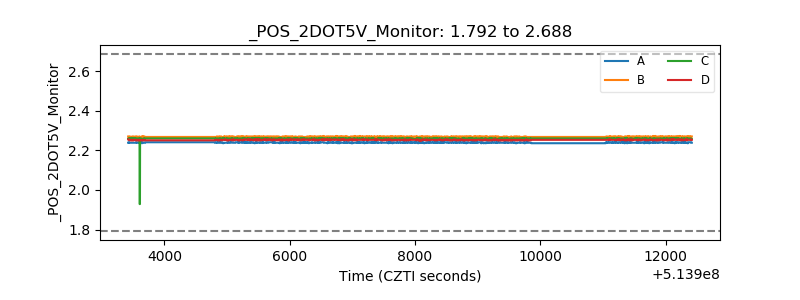 |
| +5 Volts monitor | 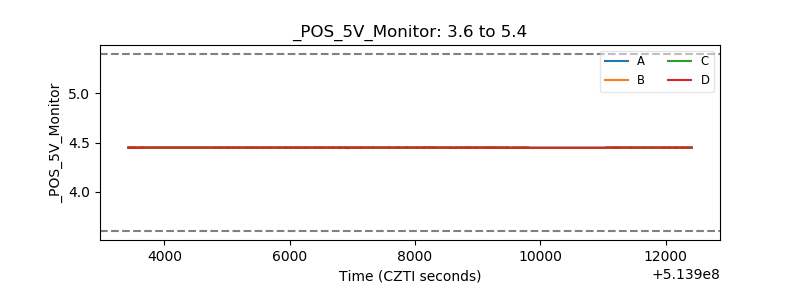 |
| _ROLL_ROT | 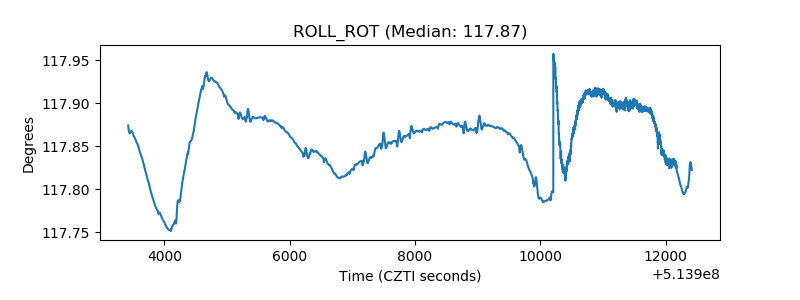 |
| _Roll_DEC | 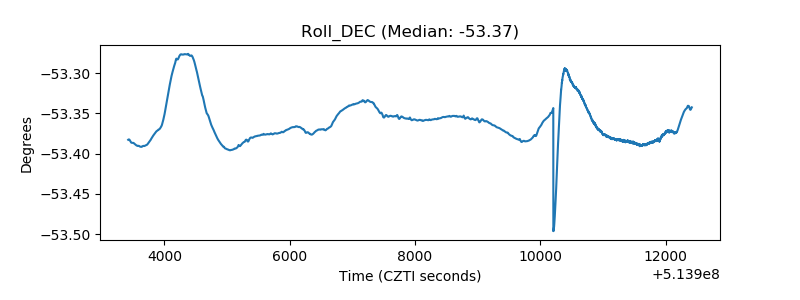 |
| _Roll_RA | 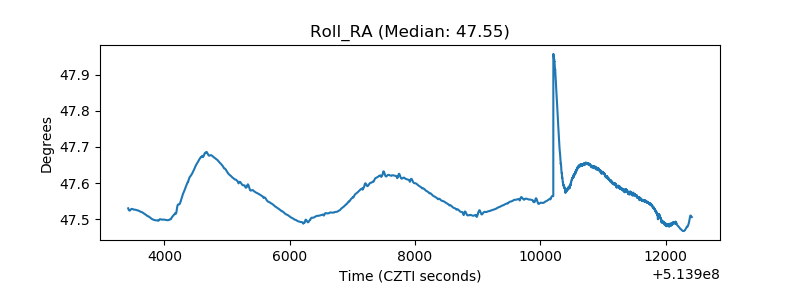 |
| Veto Counter | 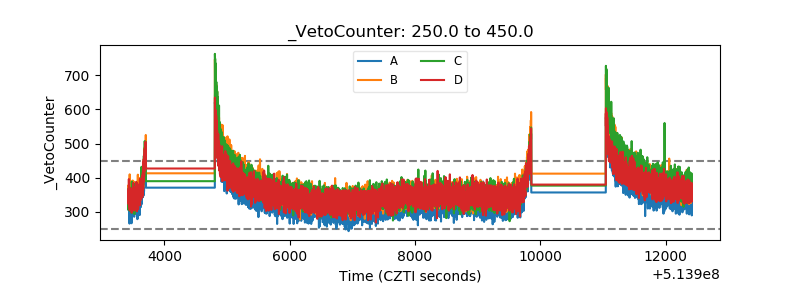 |