| Param | Original file | Final file |
|---|---|---|
| Filename | modeM0/AS1A14_083T10_9000006566_57061cztM0_level2.fits | modeM0/AS1A14_083T10_9000006566_57061cztM0_level2_quad_clean.evt |
| Size (bytes) | 405,414,720 | 90,967,680 |
| Size | 386.6 MB | 86.8 MB |
| Events in quadrant A | 2,828,182 | 599,814 |
| Events in quadrant B | 3,239,496 | 637,927 |
| Events in quadrant C | 2,889,145 | 577,451 |
| Events in quadrant D | 5,571,348 | 509,524 |
| Mode M9 | |||
|---|---|---|---|
| Quadrant | BADHDUFLAG | Total packets | Discarded packets |
| A | 0 | 9 | 0 |
| B | 0 | 9 | 0 |
| C | 0 | 9 | 0 |
| D | 0 | 9 | 0 |
| Mode M0 | |||
|---|---|---|---|
| Quadrant | BADHDUFLAG | Total packets | Discarded packets |
| A | 0 | 12859 | 1 |
| B | 0 | 13857 | 1 |
| C | 0 | 13030 | 1 |
| D | 0 | 20760 | 1 |
| Mode SS | |||
|---|---|---|---|
| Quadrant | BADHDUFLAG | Total packets | Discarded packets |
| A | 0 | 126 | 0 |
| B | 0 | 126 | 0 |
| C | 0 | 126 | 0 |
| D | 0 | 126 | 0 |
| Quadrant | Total seconds | Saturated seconds | Saturation percentage |
|---|---|---|---|
| A | 6155 | 54 | 0.877335% |
| B | 6156 | 183 | 2.972710% |
| C | 6156 | 79 | 1.283301% |
| D | 6156 | 507 | 8.235867% |
Noise dominated data is calculated using 1-second bins in cleaned event files. If a bin has >2000 counts, and if more than 50% of those come from <1% of pixels, then it is considered to be noise-dominated and hence unusable.
| Quadrant | # 1 sec bins | Bins with >0 counts | Bins with >2000 counts | High rate bins dominated by noise | Noise dominated (total time) | Noise dominated (detector-on time) | Marked lightcurve |
|---|---|---|---|---|---|---|---|
| A | 7140 | 6156 | 12 | 12 | 0.17% | 0.19% | 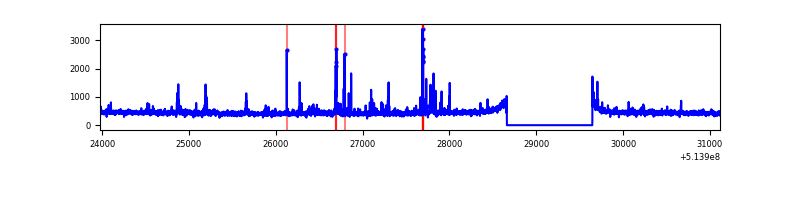 |
| B | 7141 | 6156 | 62 | 62 | 0.87% | 1.01% | 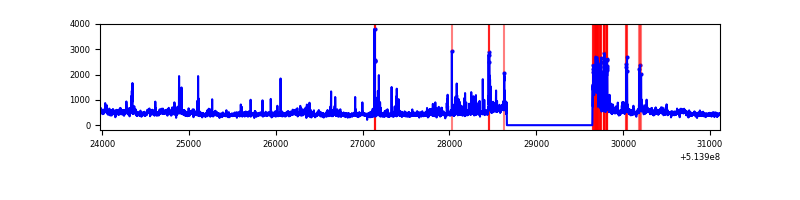 |
| C | 7141 | 6156 | 25 | 25 | 0.35% | 0.41% | 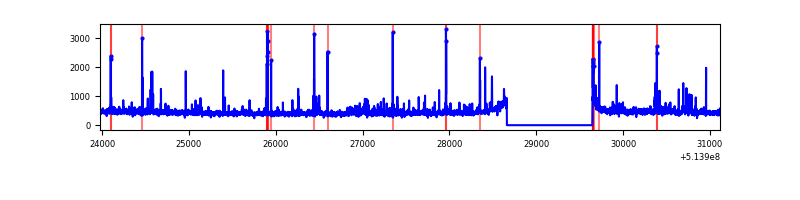 |
| D | 7140 | 6156 | 483 | 483 | 6.76% | 7.85% | 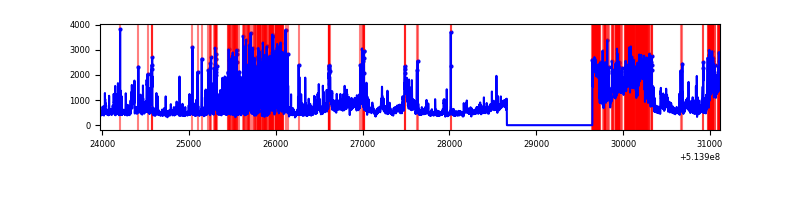 |
Top three noisy pixels from each quadrant. If the there are fewer than three noisy pixels in the level2.evt file, extra rows are filled as -1
| Pixel properties | Quadrant properties | ||||||
|---|---|---|---|---|---|---|---|
| Quadrant | DetID | PixID | Counts | Sigma | Mean | Median | Sigma |
| A | 8 | 249 | 45504 | 269.36 | 675 | 656 | 166.5 |
| A | 3 | 14 | 44422 | 262.86 | 675 | 656 | 166.5 |
| A | 3 | 245 | 44323 | 262.27 | 675 | 656 | 166.5 |
| B | 10 | 16 | 254312 | 1799.3 | 656 | 630 | 141.0 |
| B | 0 | 63 | 133517 | 942.53 | 656 | 630 | 141.0 |
| B | 7 | 252 | 63811 | 448.13 | 656 | 630 | 141.0 |
| C | 14 | 254 | 80340 | 442.04 | 661 | 656 | 180.3 |
| C | 6 | 223 | 66779 | 366.82 | 661 | 656 | 180.3 |
| C | 15 | 209 | 32766 | 178.13 | 661 | 656 | 180.3 |
| D | 15 | 142 | 1674425 | 9343.57 | 636 | 608 | 179.1 |
| D | 12 | 33 | 1005096 | 5607.25 | 636 | 608 | 179.1 |
| D | 2 | 31 | 89200 | 494.54 | 636 | 608 | 179.1 |
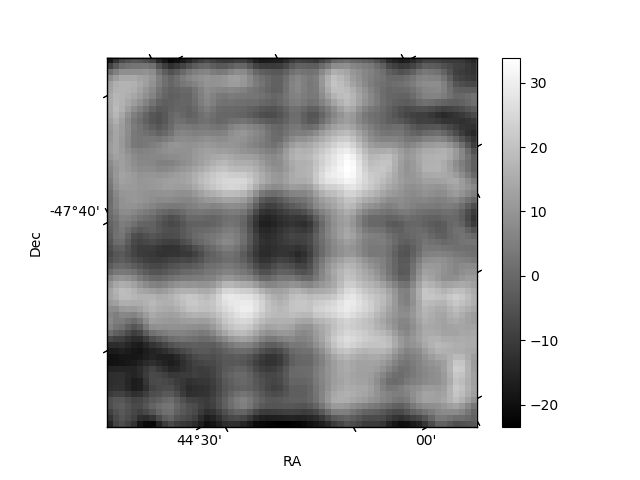
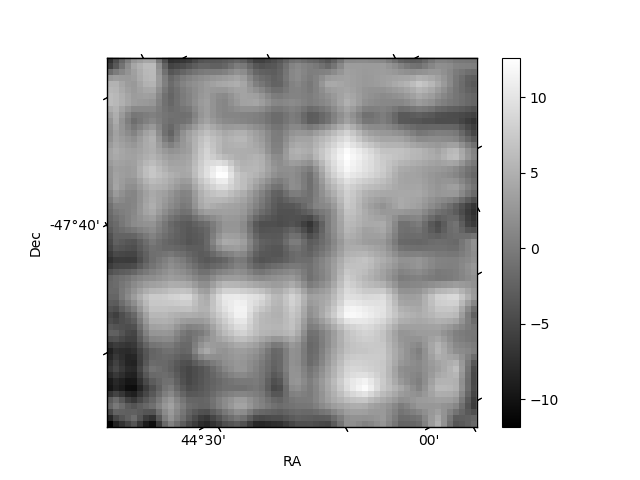
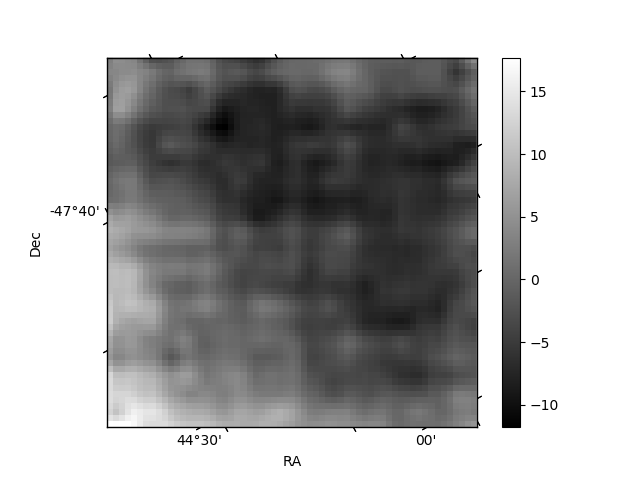
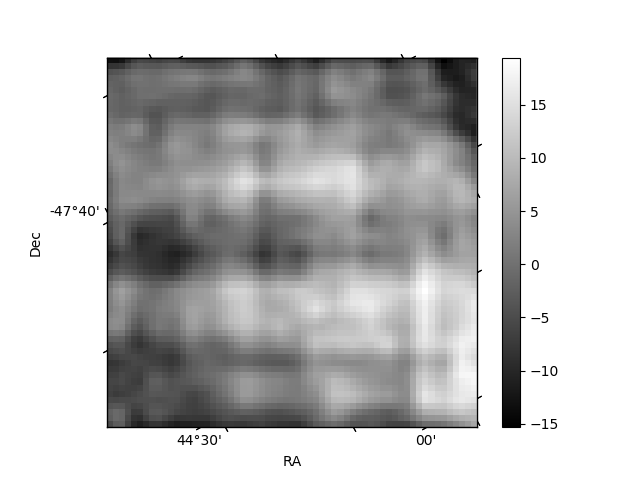
Histogram calculated using DETX and DETY for each event in the final _common_clean file
| Quadrant A | 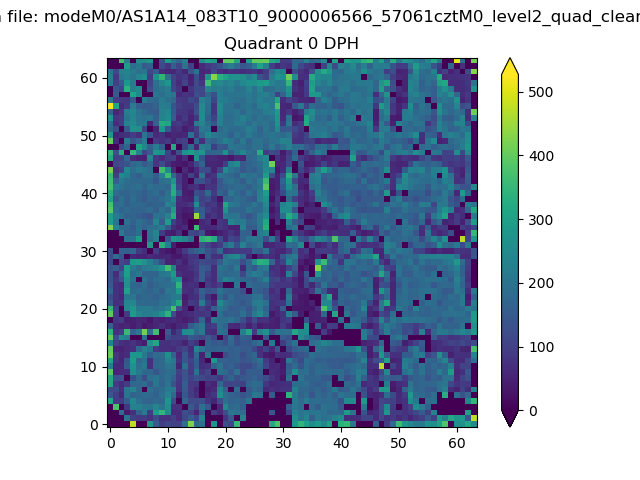 |
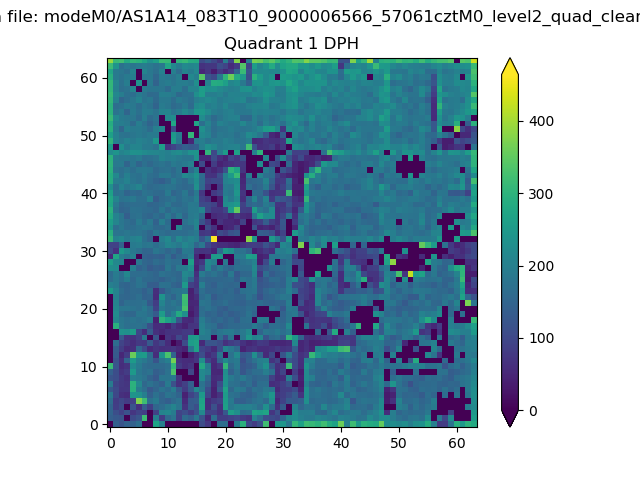 |
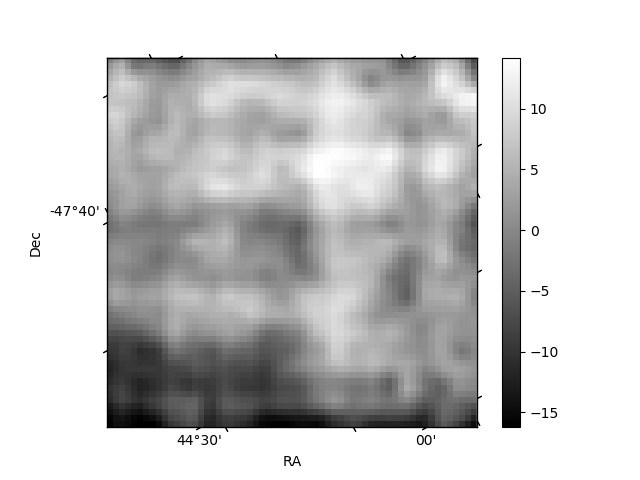
Quadrant B |
|---|---|---|---|
| Quadrant D | 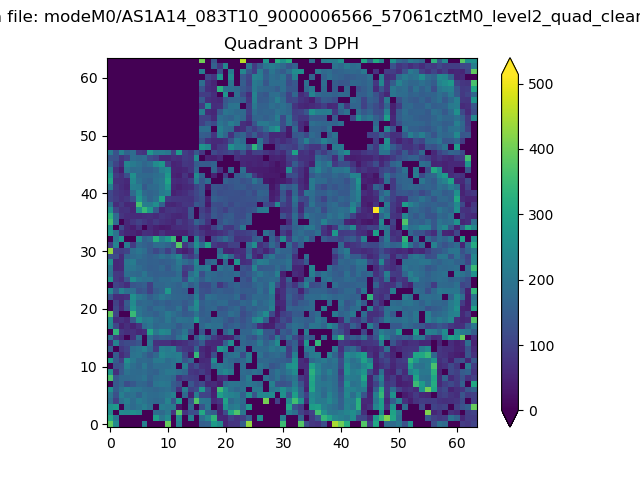 |
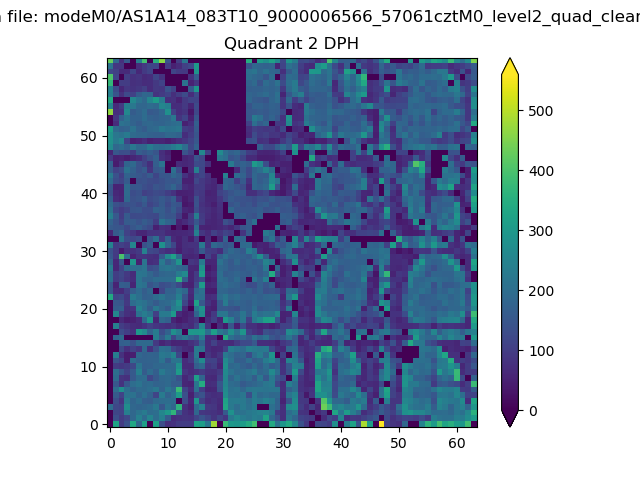 |
Quadrant C |
| Plot type | Count rate plots | Images |
|---|---|---|
| Comparison with Poisson distribution Blue bars denote a histogram of data divided into 1 sec bins. Red curve is a Poisson curve with rate = median count rate of data. |
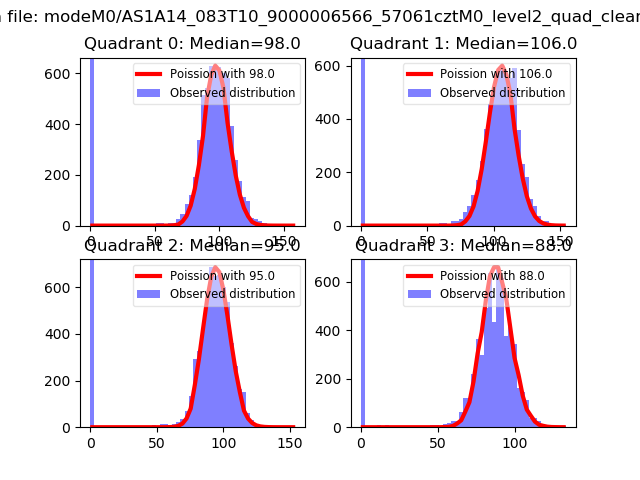 |
 |
| Quadrant-wise count rates Data is divided into 100 sec bins |
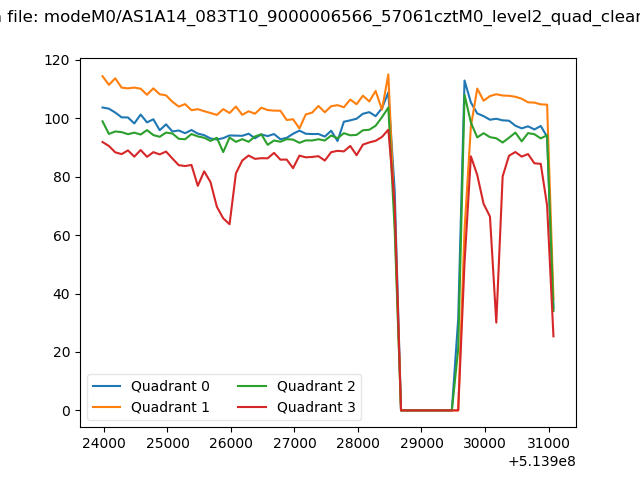 |
|
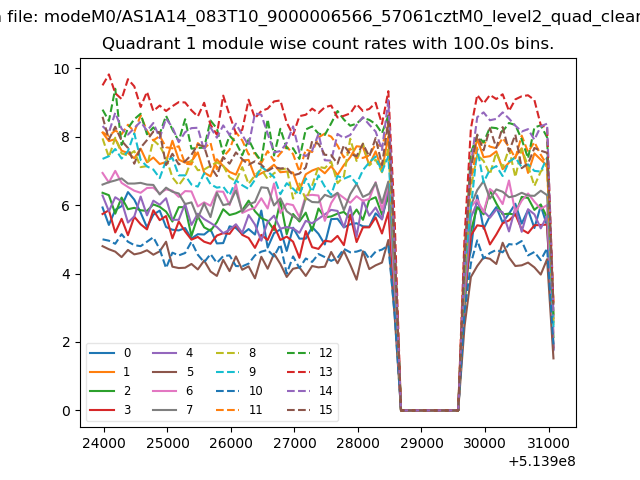
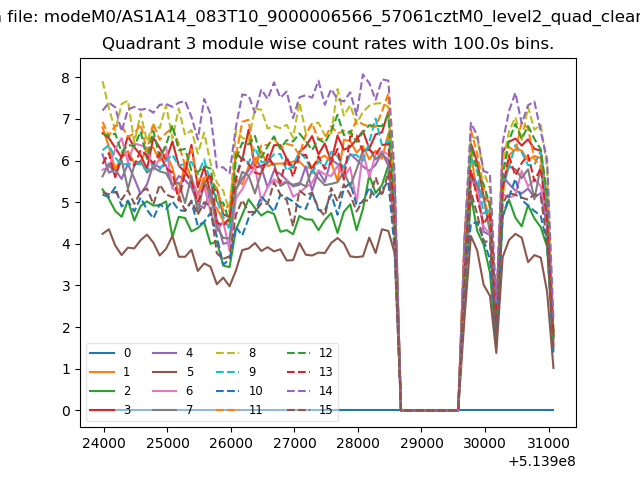
| Module-wise count rates for Quadrant A Data is divided into 100 sec bins |
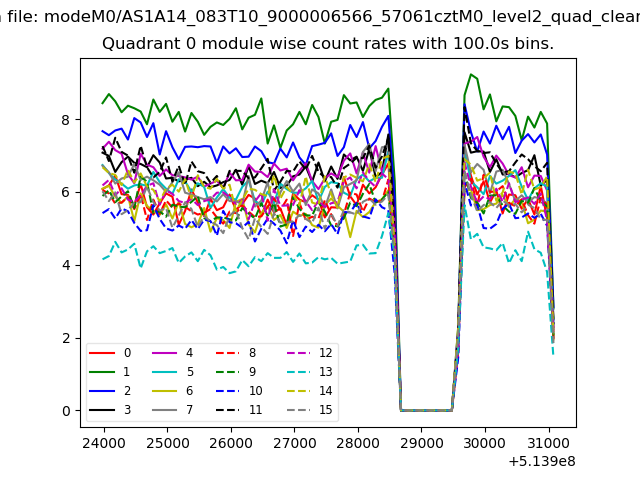 |
 |
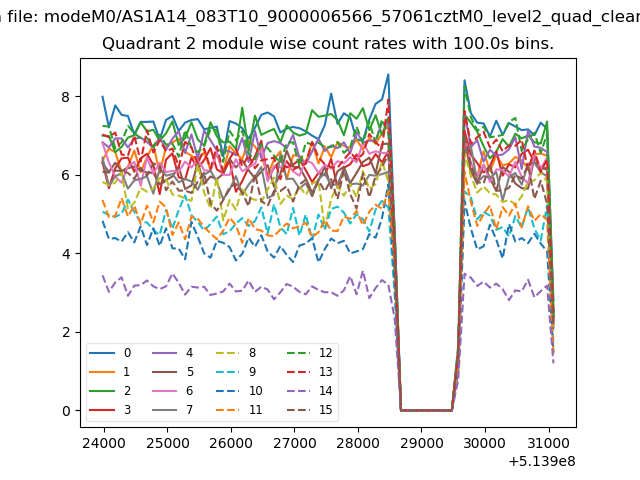
| Module-wise count rates for Quadrant B Data is divided into 100 sec bins |
 |
 |
| Module-wise count rates for Quadrant C Data is divided into 100 sec bins |
 |
 |
| Module-wise count rates for Quadrant D Data is divided into 100 sec bins |
 |
 |
| Parameter | Plot |
|---|---|
| CZT HV Monitor | 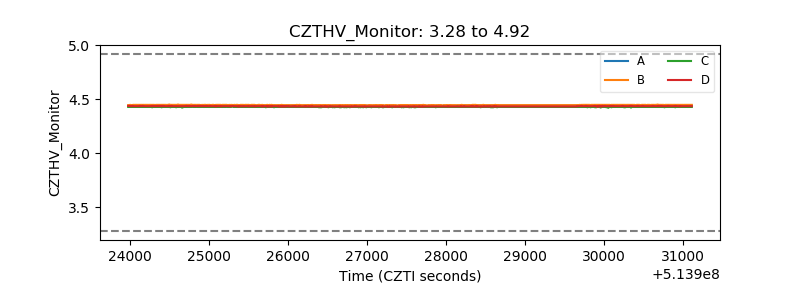 |
| D_VDD | 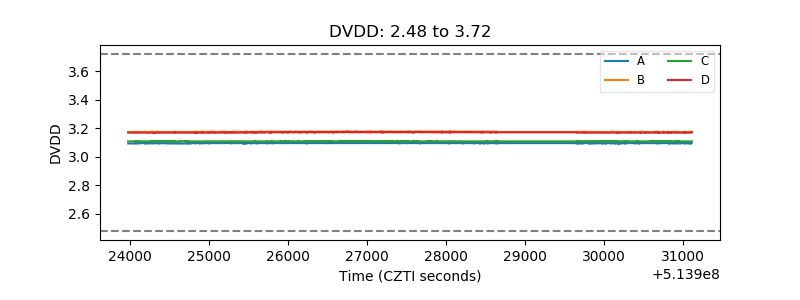 |
| Temperature 1 | 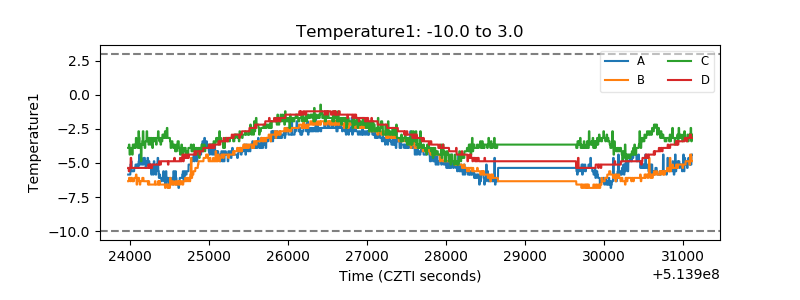 |
| Veto HV Monitor | 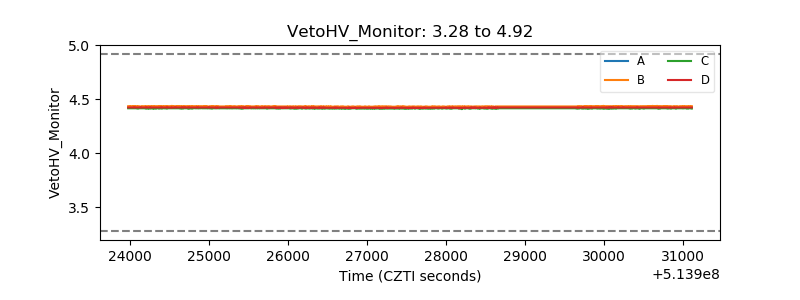 |
| Veto LLD | 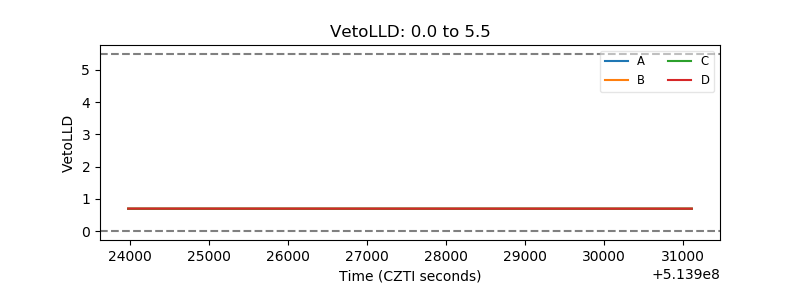 |
| Alpha Counter | 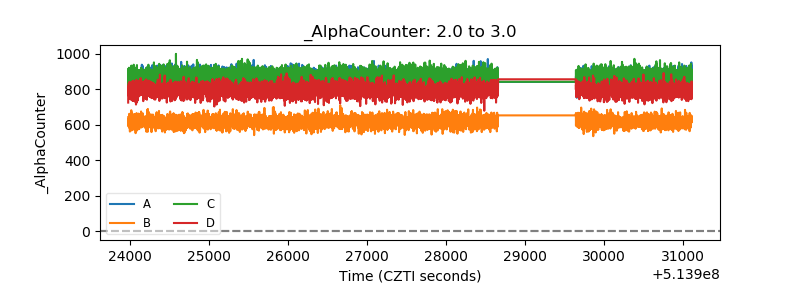 |
| _CPM_Rate | 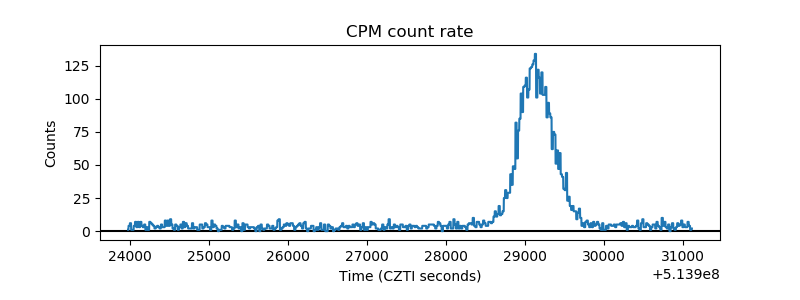 |
| CZT Counter | 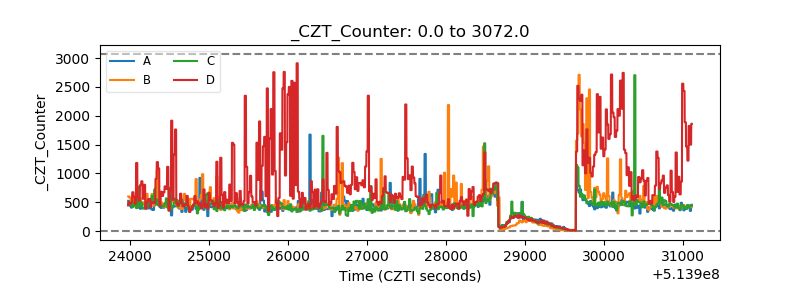 |
| +2.5 Volts monitor | 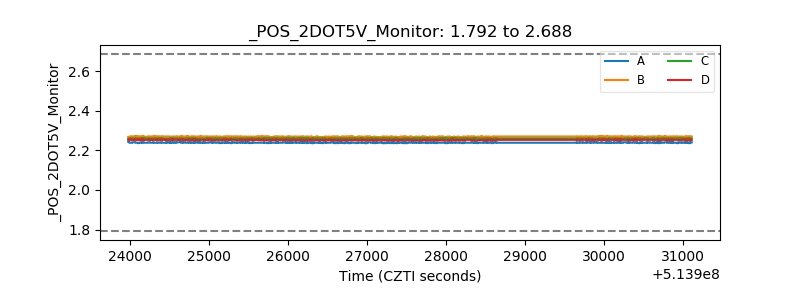 |
| +5 Volts monitor | 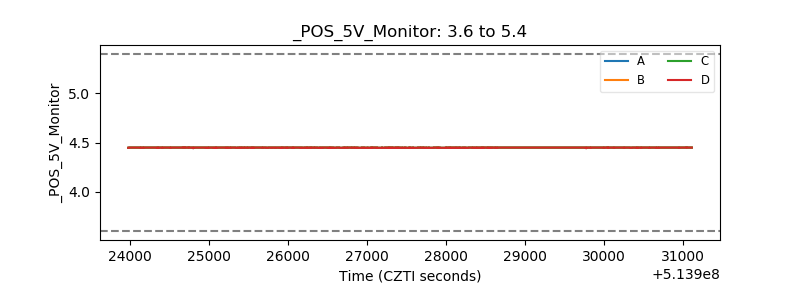 |
| _ROLL_ROT | 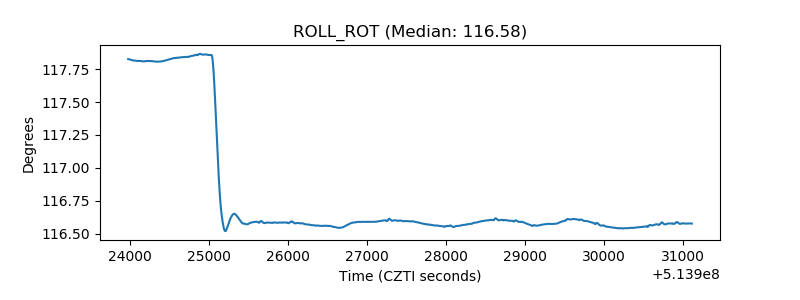 |
| _Roll_DEC | 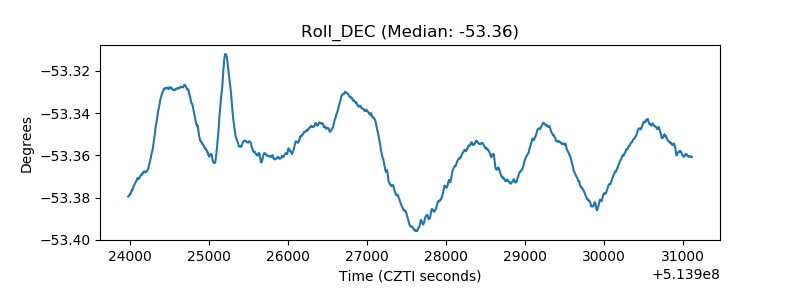 |
| _Roll_RA | 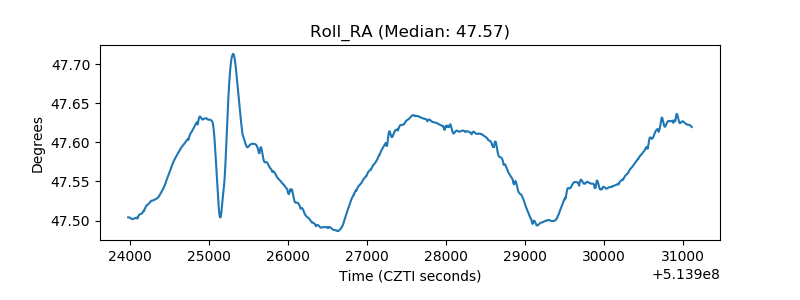 |
| Veto Counter | 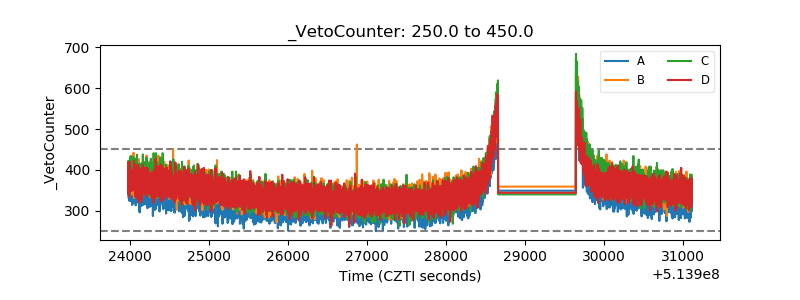 |