| Param | Original file | Final file |
|---|---|---|
| Filename | modeM0/AS1A14_083T10_9000006566_57063cztM0_level2.fits | modeM0/AS1A14_083T10_9000006566_57063cztM0_level2_quad_clean.evt |
| Size (bytes) | 510,370,560 | 100,186,560 |
| Size | 486.7 MB | 95.5 MB |
| Events in quadrant A | 3,210,955 | 659,717 |
| Events in quadrant B | 3,226,513 | 719,020 |
| Events in quadrant C | 3,638,565 | 636,109 |
| Events in quadrant D | 8,275,426 | 533,361 |
| Mode M0 | |||
|---|---|---|---|
| Quadrant | BADHDUFLAG | Total packets | Discarded packets |
| A | 0 | 14874 | 0 |
| B | 0 | 14579 | 0 |
| C | 0 | 16028 | 0 |
| D | 0 | 29447 | 0 |
| Mode SS | |||
|---|---|---|---|
| Quadrant | BADHDUFLAG | Total packets | Discarded packets |
| A | 0 | 140 | 0 |
| B | 0 | 140 | 0 |
| C | 0 | 140 | 0 |
| D | 0 | 140 | 0 |
| Quadrant | Total seconds | Saturated seconds | Saturation percentage |
|---|---|---|---|
| A | 6963 | 98 | 1.407439% |
| B | 6964 | 73 | 1.048248% |
| C | 6964 | 110 | 1.579552% |
| D | 6964 | 1101 | 15.809879% |
Noise dominated data is calculated using 1-second bins in cleaned event files. If a bin has >2000 counts, and if more than 50% of those come from <1% of pixels, then it is considered to be noise-dominated and hence unusable.
| Quadrant | # 1 sec bins | Bins with >0 counts | Bins with >2000 counts | High rate bins dominated by noise | Noise dominated (total time) | Noise dominated (detector-on time) | Marked lightcurve |
|---|---|---|---|---|---|---|---|
| A | 6963 | 6963 | 60 | 60 | 0.86% | 0.86% | 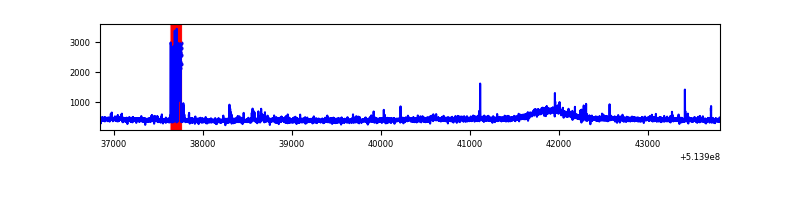 |
| B | 6964 | 6964 | 6 | 6 | 0.09% | 0.09% | 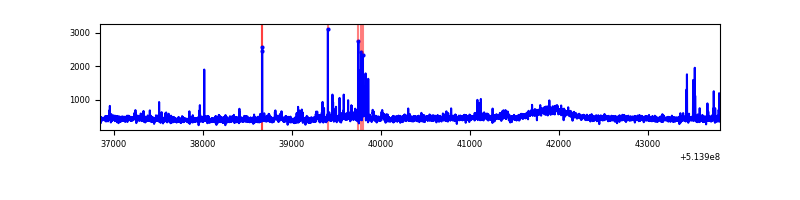 |
| C | 6964 | 6964 | 74 | 74 | 1.06% | 1.06% | 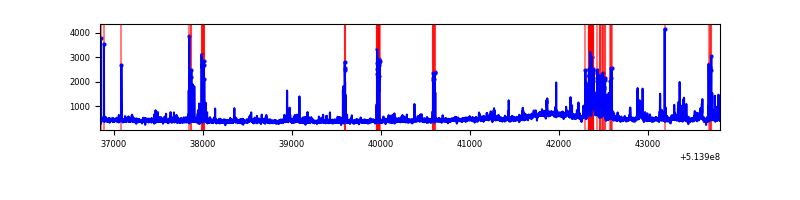 |
| D | 6964 | 6964 | 1059 | 1059 | 15.21% | 15.21% | 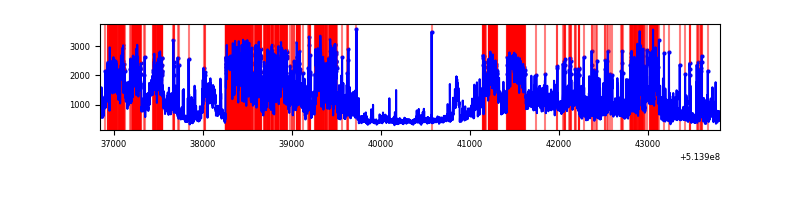 |
Top three noisy pixels from each quadrant. If the there are fewer than three noisy pixels in the level2.evt file, extra rows are filled as -1
| Pixel properties | Quadrant properties | ||||||
|---|---|---|---|---|---|---|---|
| Quadrant | DetID | PixID | Counts | Sigma | Mean | Median | Sigma |
| A | 0 | 250 | 182205 | 969.31 | 764 | 744 | 187.2 |
| A | 4 | 3 | 18724 | 96.04 | 764 | 744 | 187.2 |
| A | 13 | 248 | 14295 | 72.38 | 764 | 744 | 187.2 |
| B | 0 | 152 | 78752 | 484.88 | 752 | 724 | 160.9 |
| B | 0 | 63 | 42112 | 257.19 | 752 | 724 | 160.9 |
| B | 7 | 252 | 31547 | 191.54 | 752 | 724 | 160.9 |
| C | 6 | 223 | 365127 | 1821.09 | 738 | 730 | 200.1 |
| C | 12 | 254 | 103514 | 513.66 | 738 | 730 | 200.1 |
| C | 14 | 67 | 77758 | 384.95 | 738 | 730 | 200.1 |
| D | 15 | 142 | 2761204 | 13874.64 | 712 | 681 | 199.0 |
| D | 12 | 33 | 2413010 | 12124.58 | 712 | 681 | 199.0 |
| D | 8 | 240 | 83667 | 417.1 | 712 | 681 | 199.0 |
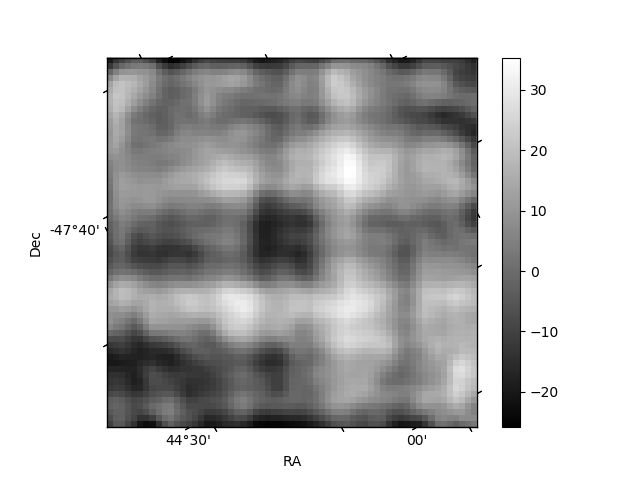
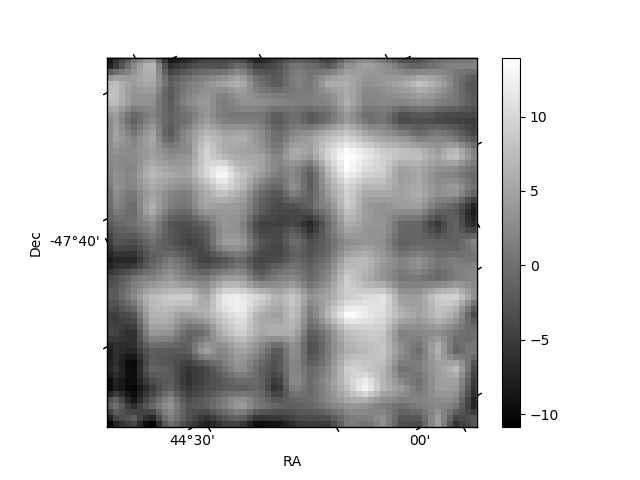
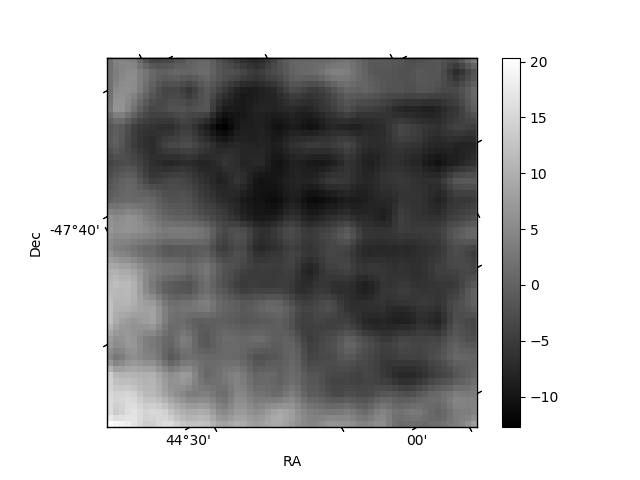
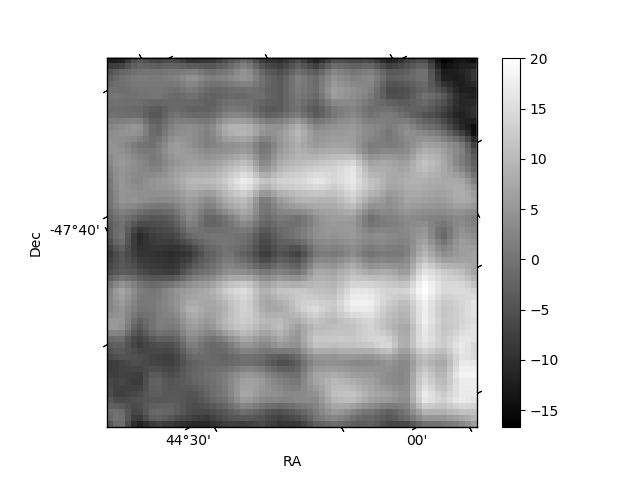
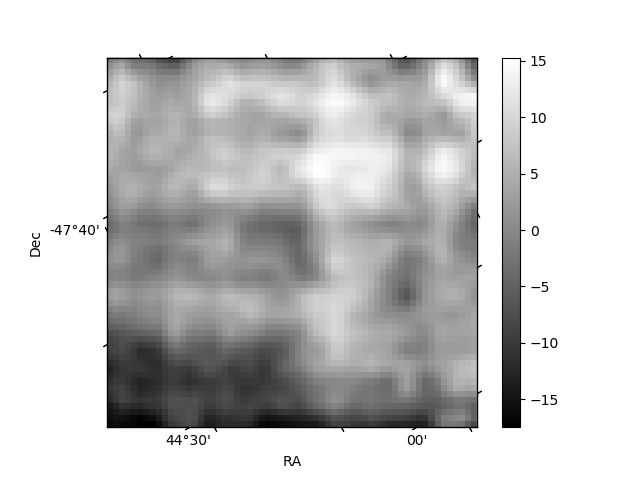
Histogram calculated using DETX and DETY for each event in the final _common_clean file
| Quadrant A | 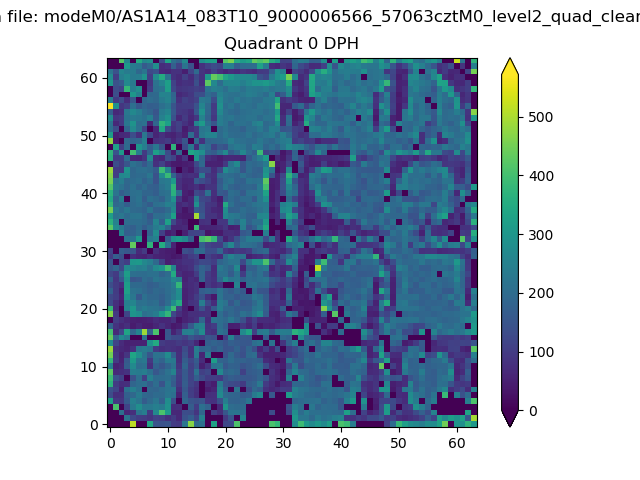 |
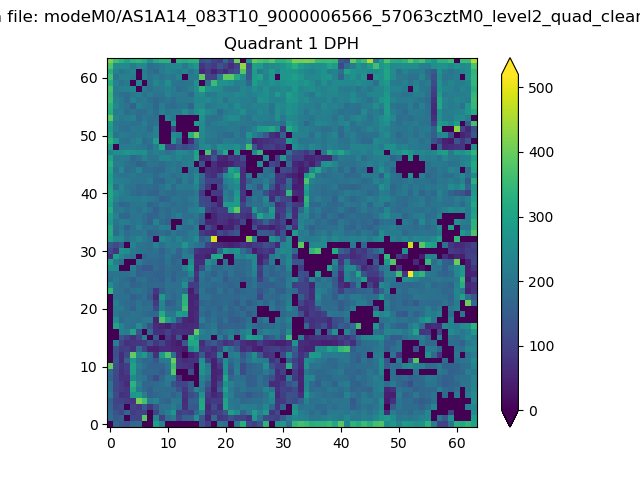 |
Quadrant B |
|---|---|---|---|
| Quadrant D | 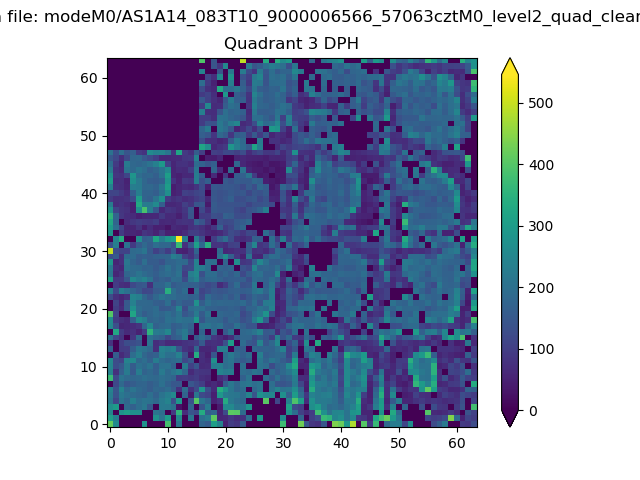 |
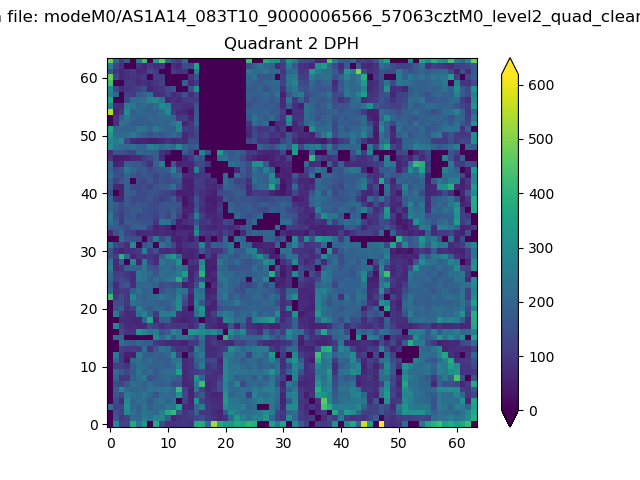 |
Quadrant C |
| Plot type | Count rate plots | Images |
|---|---|---|
| Comparison with Poisson distribution Blue bars denote a histogram of data divided into 1 sec bins. Red curve is a Poisson curve with rate = median count rate of data. |
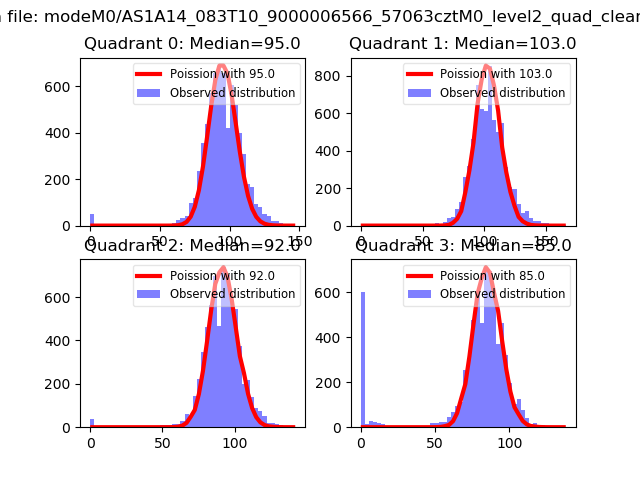 |
 |
| Quadrant-wise count rates Data is divided into 100 sec bins |
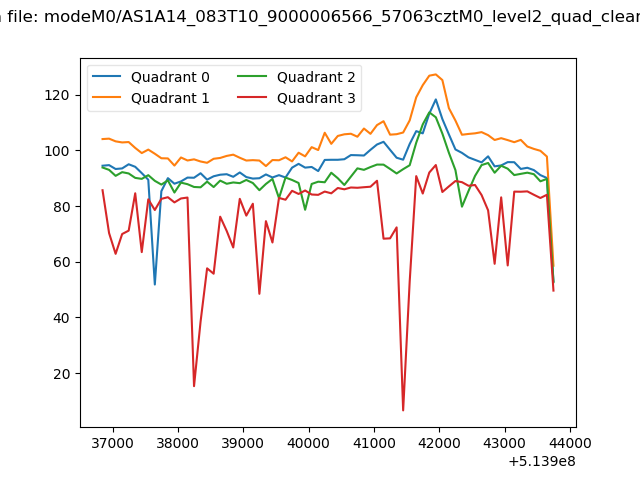 |
|
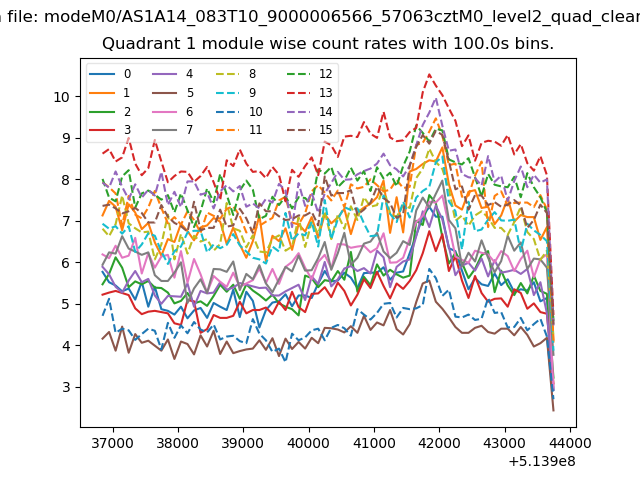
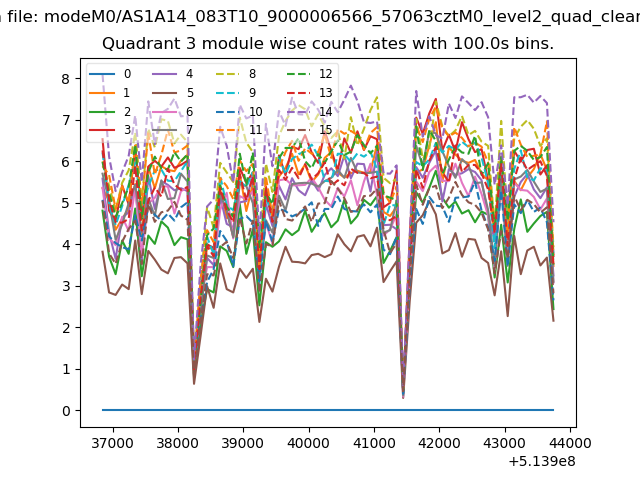
| Module-wise count rates for Quadrant A Data is divided into 100 sec bins |
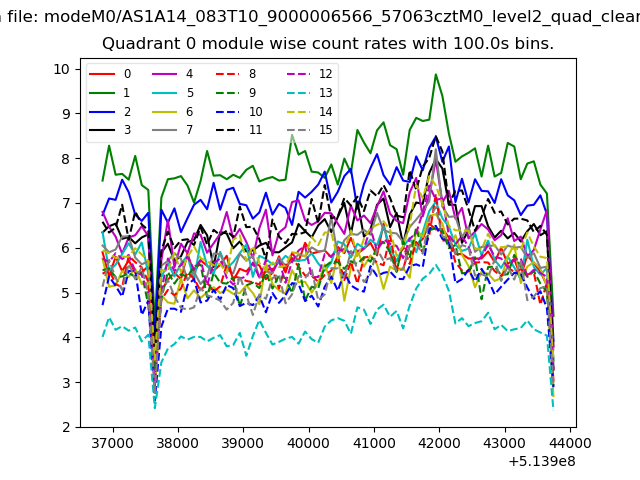 |
 |
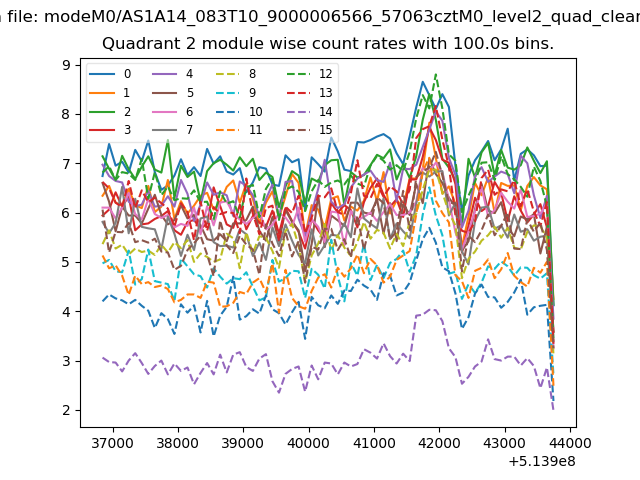
| Module-wise count rates for Quadrant B Data is divided into 100 sec bins |
 |
 |
| Module-wise count rates for Quadrant C Data is divided into 100 sec bins |
 |
 |
| Module-wise count rates for Quadrant D Data is divided into 100 sec bins |
 |
 |
| Parameter | Plot |
|---|---|
| CZT HV Monitor | 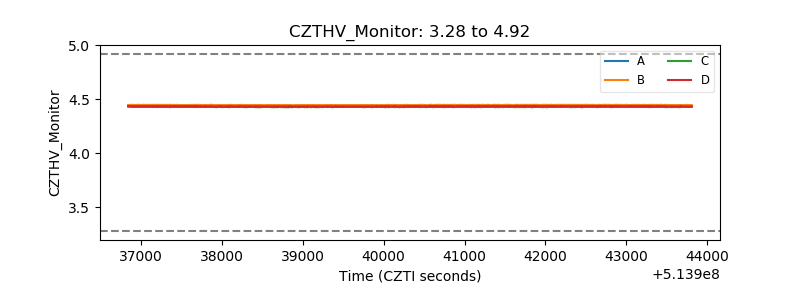 |
| D_VDD | 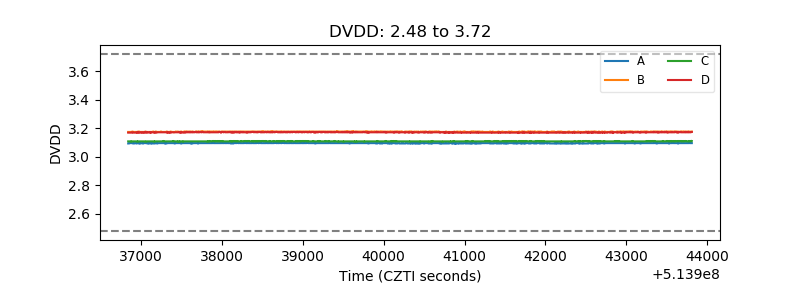 |
| Temperature 1 | 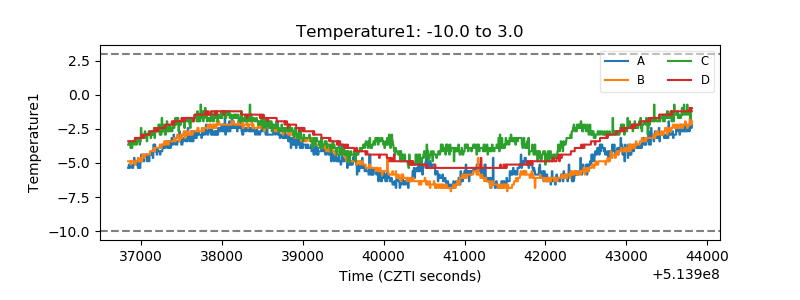 |
| Veto HV Monitor |  |
| Veto LLD | 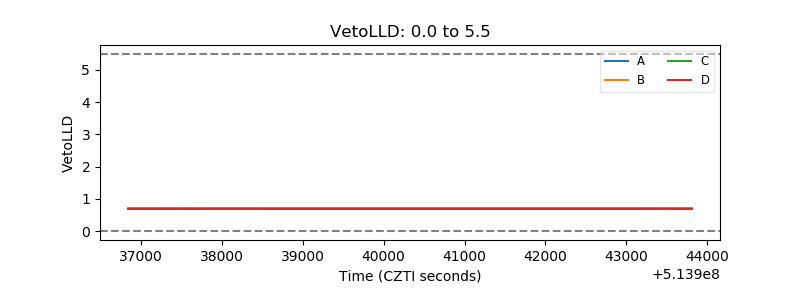 |
| Alpha Counter | 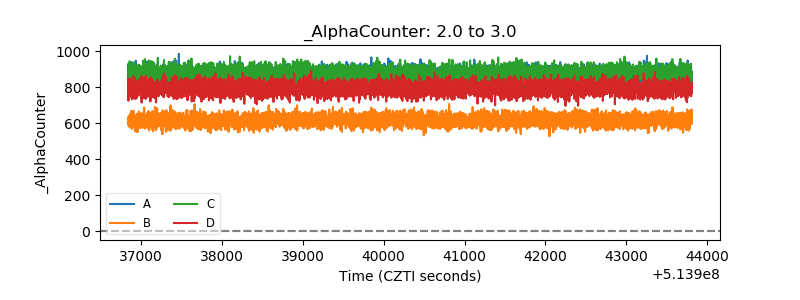 |
| _CPM_Rate | 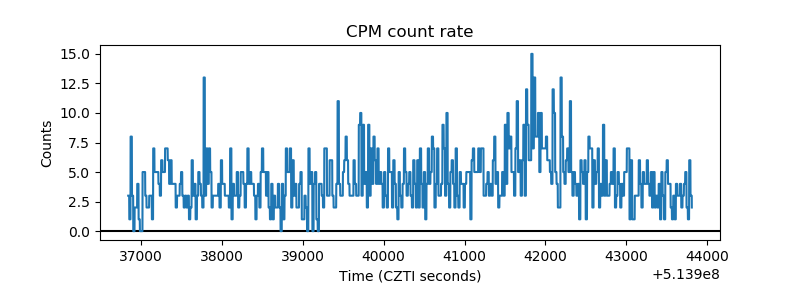 |
| CZT Counter | 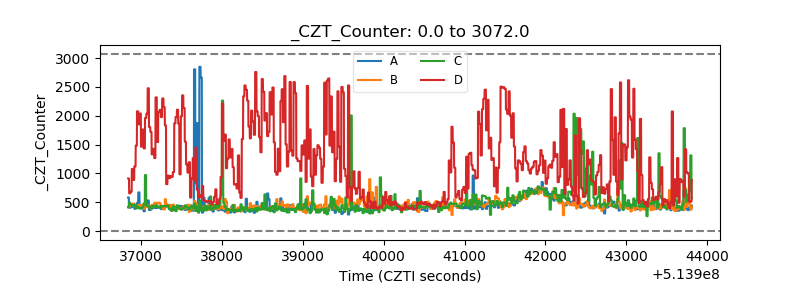 |
| +2.5 Volts monitor |  |
| +5 Volts monitor |  |
| _ROLL_ROT | 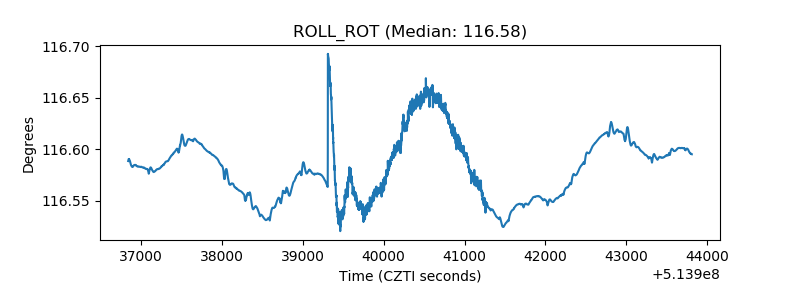 |
| _Roll_DEC | 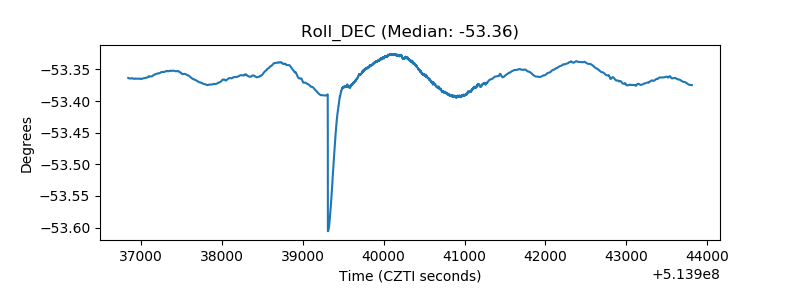 |
| _Roll_RA | 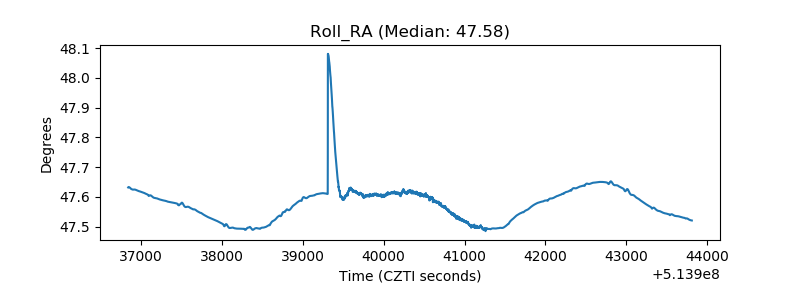 |
| Veto Counter | 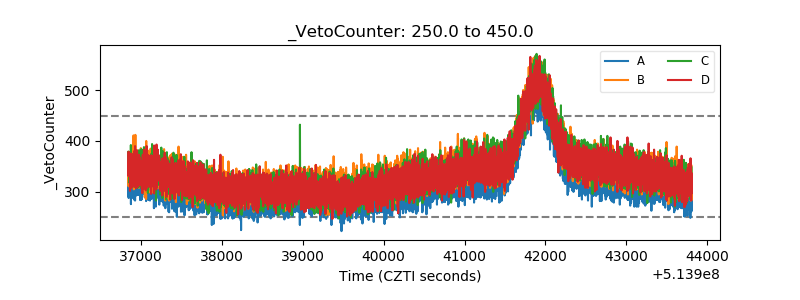 |