| Param | Original file | Final file |
|---|---|---|
| Filename | modeM0/AS1A14_083T10_9000006566_57064cztM0_level2.fits | modeM0/AS1A14_083T10_9000006566_57064cztM0_level2_quad_clean.evt |
| Size (bytes) | 476,159,040 | 107,438,400 |
| Size | 454.1 MB | 102.5 MB |
| Events in quadrant A | 3,201,445 | 698,801 |
| Events in quadrant B | 3,334,259 | 754,722 |
| Events in quadrant C | 4,441,413 | 667,816 |
| Events in quadrant D | 6,075,635 | 618,230 |
| Mode M0 | |||
|---|---|---|---|
| Quadrant | BADHDUFLAG | Total packets | Discarded packets |
| A | 0 | 15041 | 0 |
| B | 0 | 15274 | 0 |
| C | 0 | 18194 | 3 |
| D | 0 | 23124 | 0 |
| Mode SS | |||
|---|---|---|---|
| Quadrant | BADHDUFLAG | Total packets | Discarded packets |
| A | 0 | 148 | 0 |
| B | 0 | 148 | 0 |
| C | 0 | 148 | 0 |
| D | 0 | 148 | 0 |
| Quadrant | Total seconds | Saturated seconds | Saturation percentage |
|---|---|---|---|
| A | 7379 | 8 | 0.108416% |
| B | 7380 | 18 | 0.243902% |
| C | 7379 | 111 | 1.504269% |
| D | 7380 | 277 | 3.753388% |
Noise dominated data is calculated using 1-second bins in cleaned event files. If a bin has >2000 counts, and if more than 50% of those come from <1% of pixels, then it is considered to be noise-dominated and hence unusable.
| Quadrant | # 1 sec bins | Bins with >0 counts | Bins with >2000 counts | High rate bins dominated by noise | Noise dominated (total time) | Noise dominated (detector-on time) | Marked lightcurve |
|---|---|---|---|---|---|---|---|
| A | 7379 | 7379 | 6 | 6 | 0.08% | 0.08% | 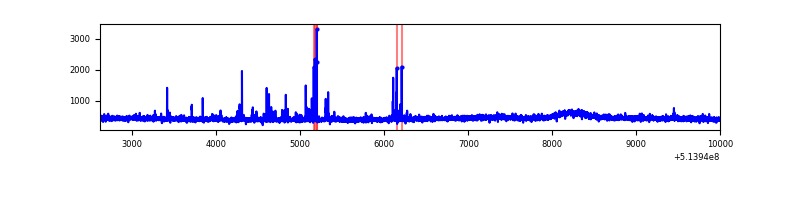 |
| B | 7380 | 7380 | 6 | 6 | 0.08% | 0.08% | 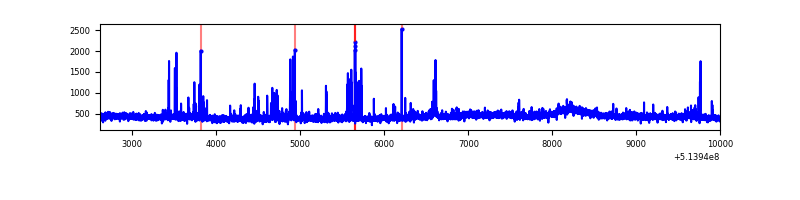 |
| C | 7380 | 7380 | 103 | 103 | 1.40% | 1.40% | 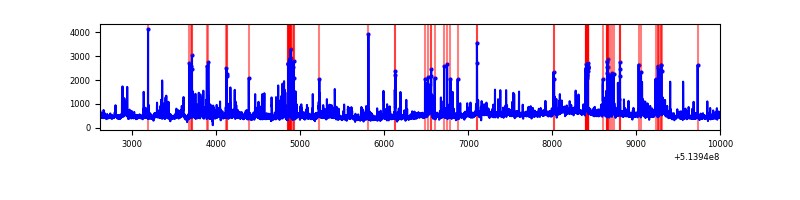 |
| D | 7380 | 7380 | 291 | 291 | 3.94% | 3.94% | 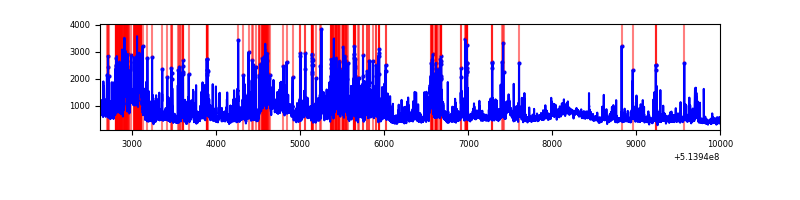 |
Top three noisy pixels from each quadrant. If the there are fewer than three noisy pixels in the level2.evt file, extra rows are filled as -1
| Pixel properties | Quadrant properties | ||||||
|---|---|---|---|---|---|---|---|
| Quadrant | DetID | PixID | Counts | Sigma | Mean | Median | Sigma |
| A | 3 | 245 | 48358 | 241.55 | 797 | 774 | 197.0 |
| A | 4 | 3 | 25721 | 126.64 | 797 | 774 | 197.0 |
| A | 10 | 251 | 24293 | 119.39 | 797 | 774 | 197.0 |
| B | 8 | 234 | 56253 | 324.99 | 787 | 754 | 170.8 |
| B | 0 | 213 | 45081 | 259.57 | 787 | 754 | 170.8 |
| B | 0 | 245 | 40173 | 230.83 | 787 | 754 | 170.8 |
| C | 12 | 254 | 389529 | 1857.29 | 770 | 763 | 209.3 |
| C | 6 | 223 | 287973 | 1372.11 | 770 | 763 | 209.3 |
| C | 1 | 16 | 253782 | 1208.77 | 770 | 763 | 209.3 |
| D | 12 | 33 | 1739308 | 8056.92 | 764 | 728 | 215.8 |
| D | 15 | 142 | 490233 | 2268.46 | 764 | 728 | 215.8 |
| D | 7 | 96 | 228578 | 1055.9 | 764 | 728 | 215.8 |
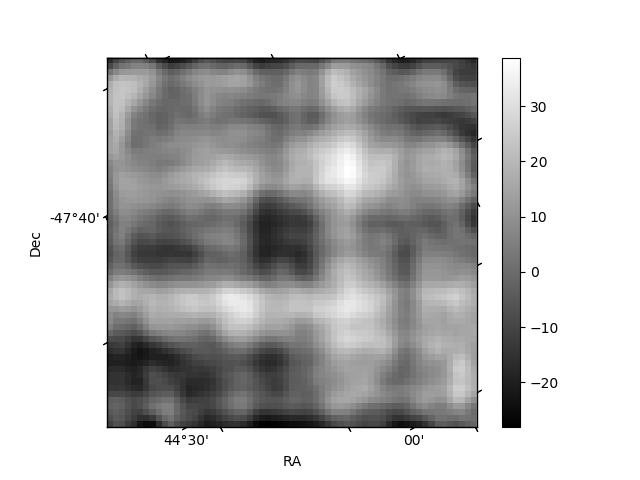
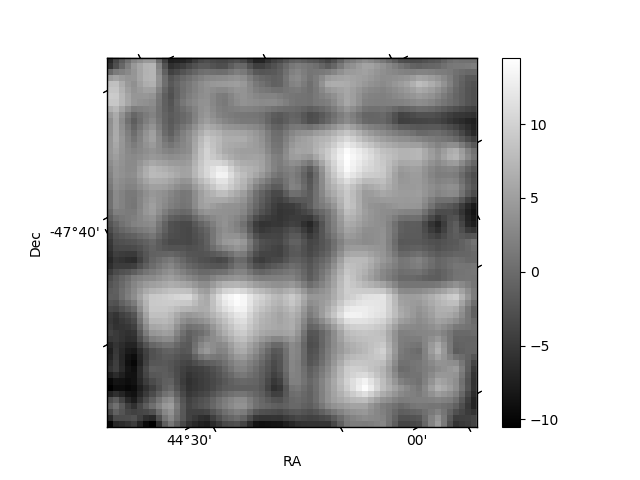
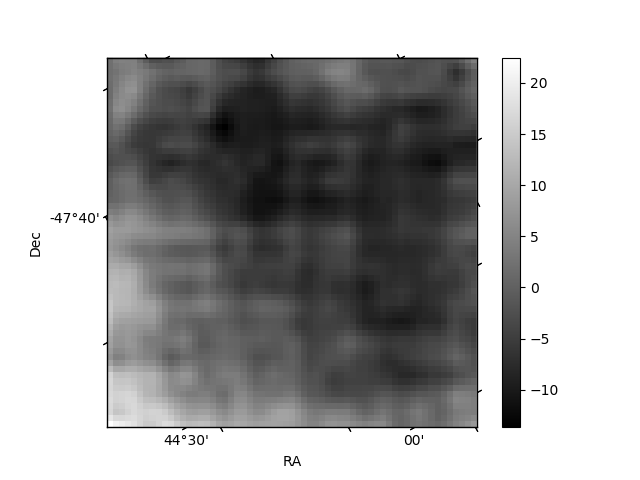
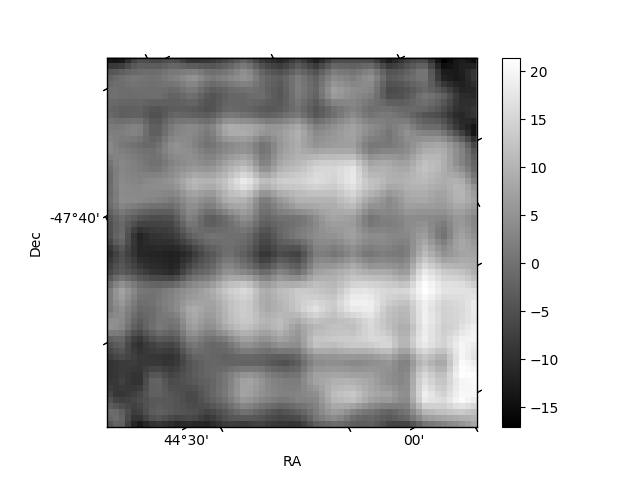
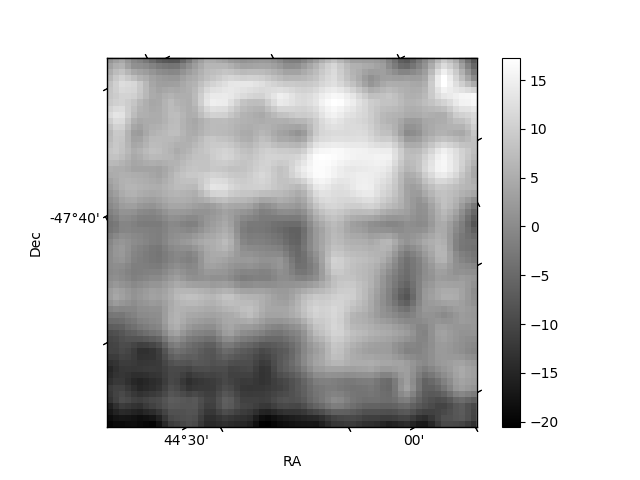
Histogram calculated using DETX and DETY for each event in the final _common_clean file
| Quadrant A | 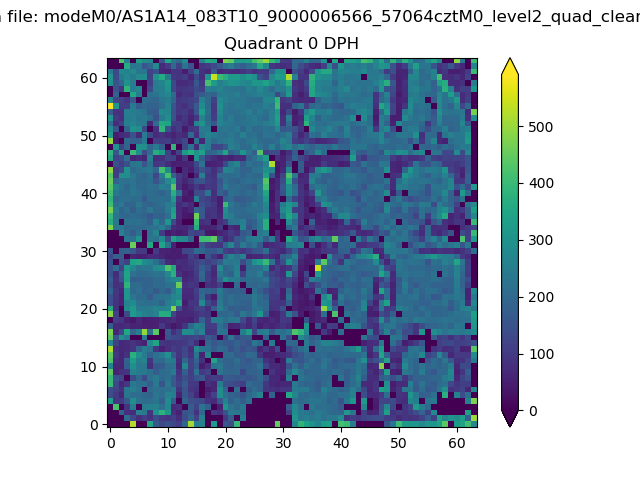 |
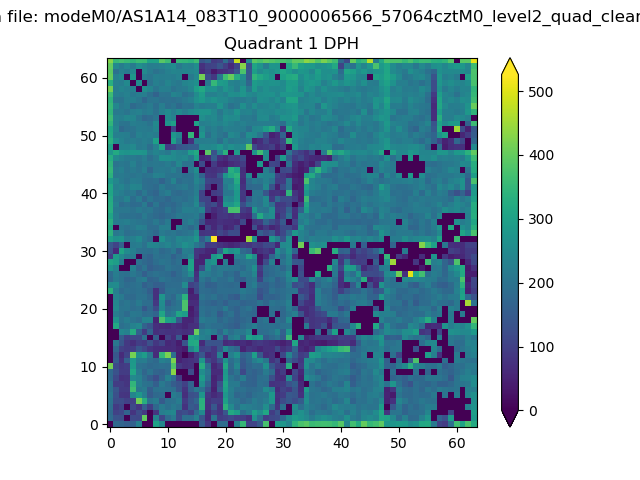 |
Quadrant B |
|---|---|---|---|
| Quadrant D | 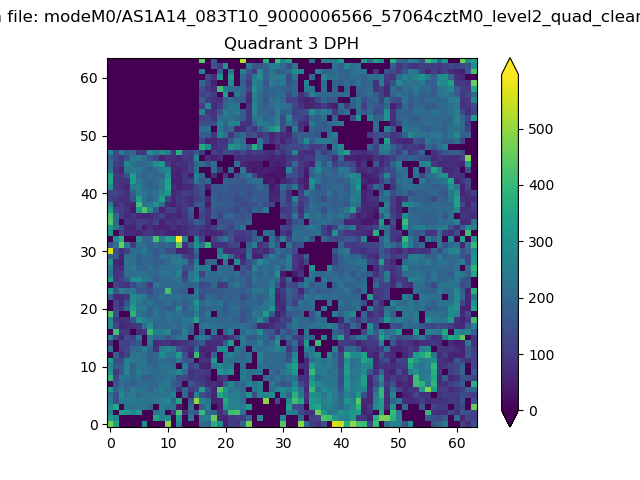 |
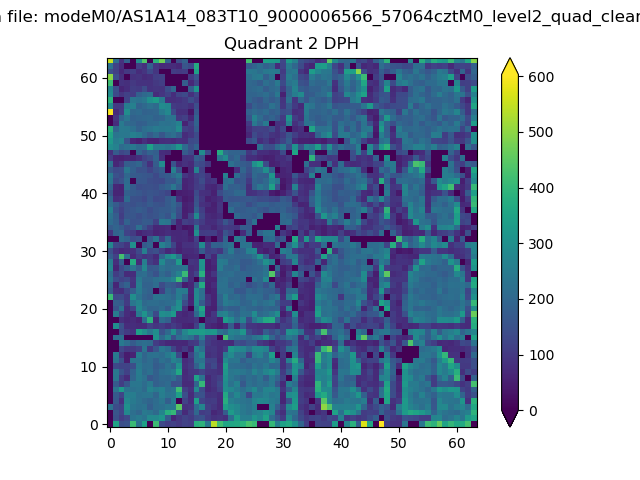 |
Quadrant C |
| Plot type | Count rate plots | Images |
|---|---|---|
| Comparison with Poisson distribution Blue bars denote a histogram of data divided into 1 sec bins. Red curve is a Poisson curve with rate = median count rate of data. |
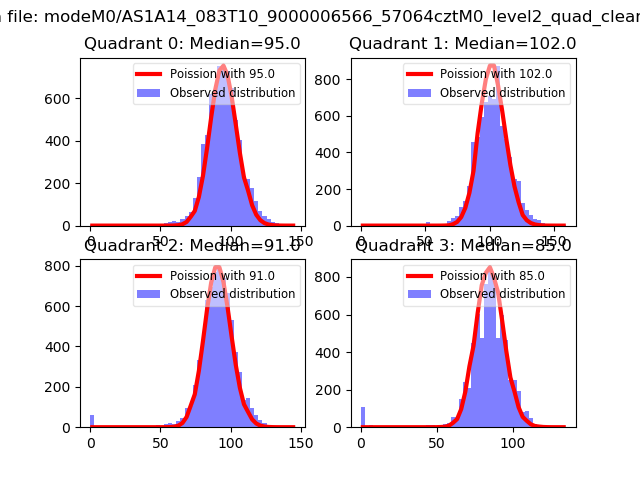 |
 |
| Quadrant-wise count rates Data is divided into 100 sec bins |
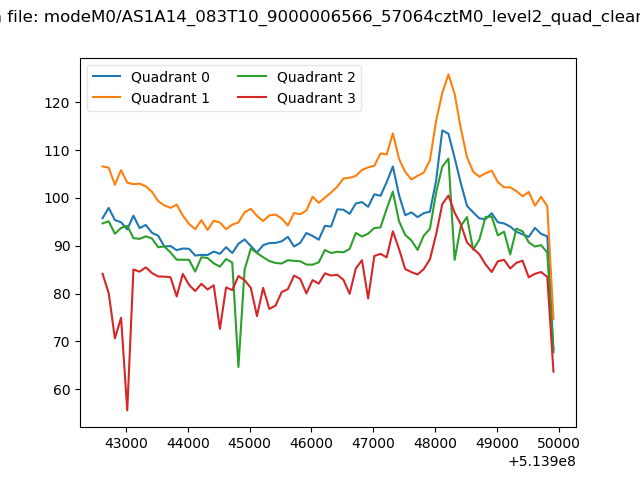 |
|
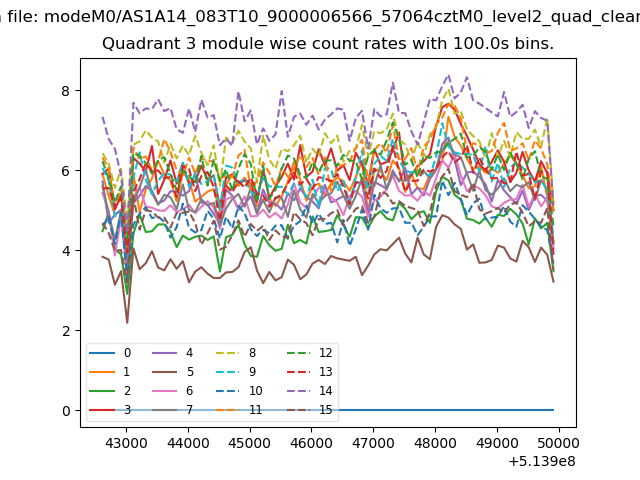
| Module-wise count rates for Quadrant A Data is divided into 100 sec bins |
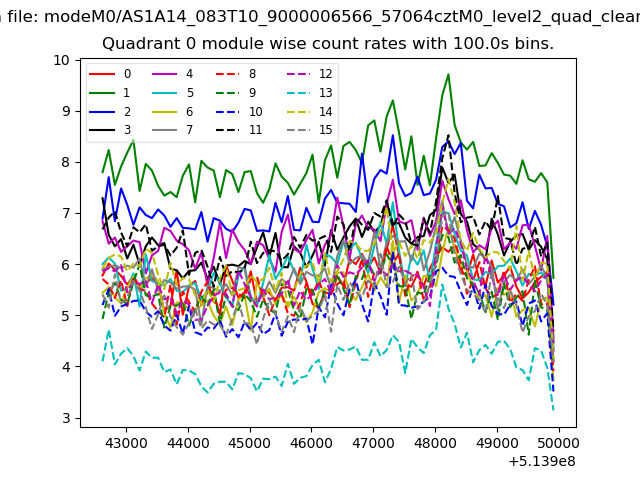 |
 |
| Module-wise count rates for Quadrant B Data is divided into 100 sec bins |
 |
 |
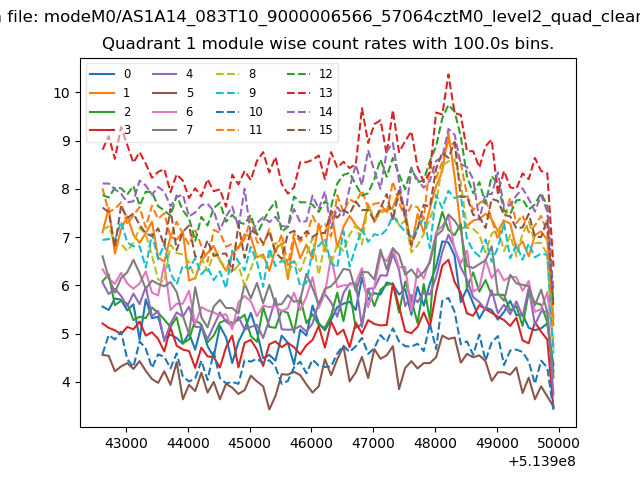
| Module-wise count rates for Quadrant C Data is divided into 100 sec bins |
 |
 |
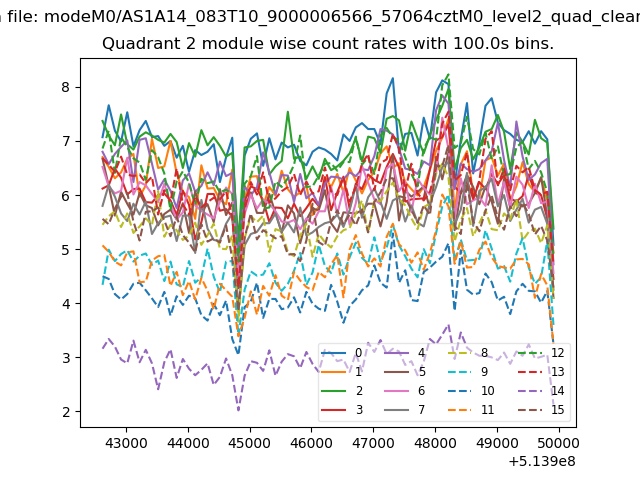
| Module-wise count rates for Quadrant D Data is divided into 100 sec bins |
 |
 |
| Parameter | Plot |
|---|---|
| CZT HV Monitor | 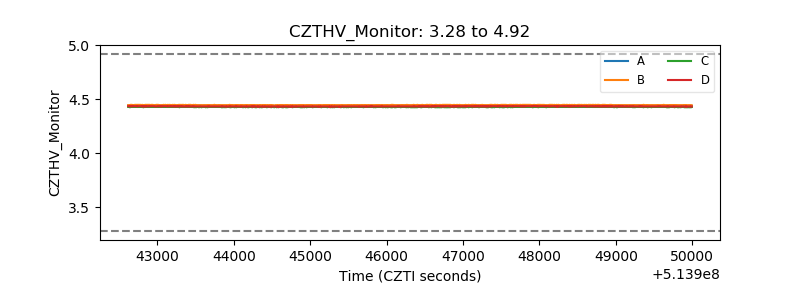 |
| D_VDD | 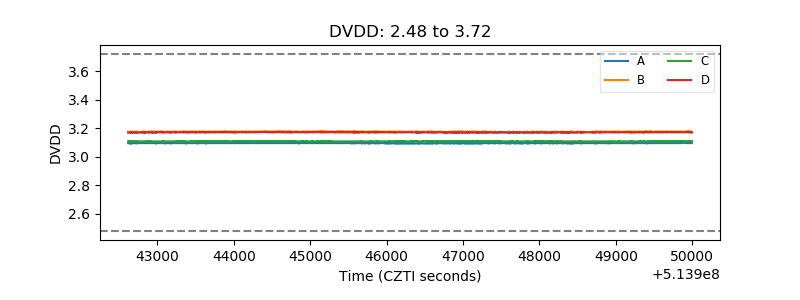 |
| Temperature 1 | 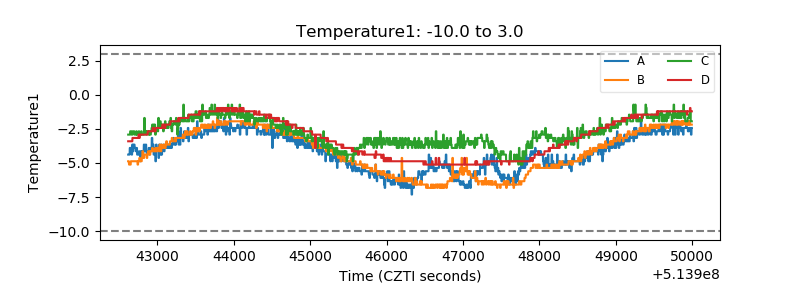 |
| Veto HV Monitor | 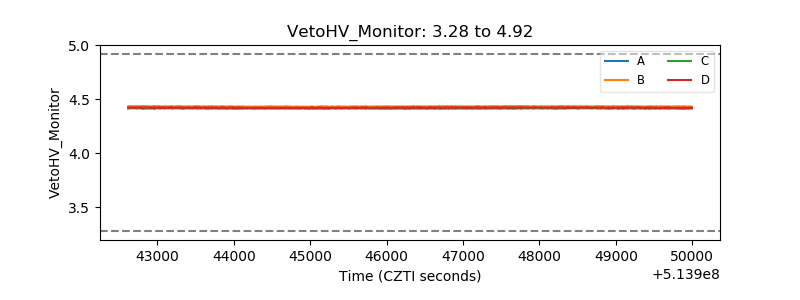 |
| Veto LLD | 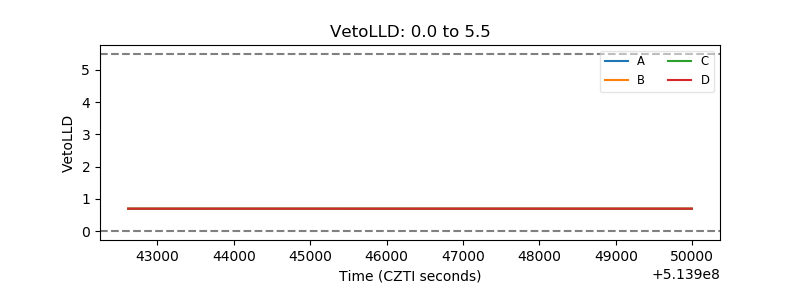 |
| Alpha Counter | 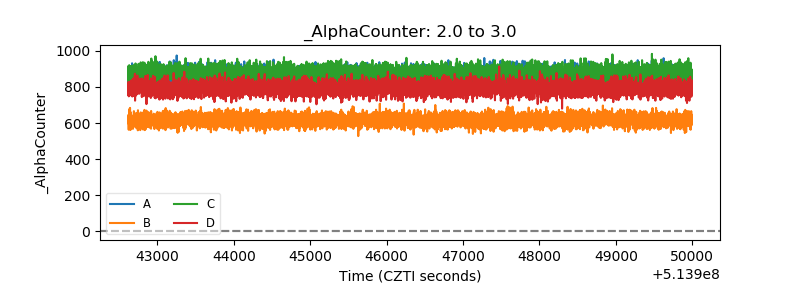 |
| _CPM_Rate | 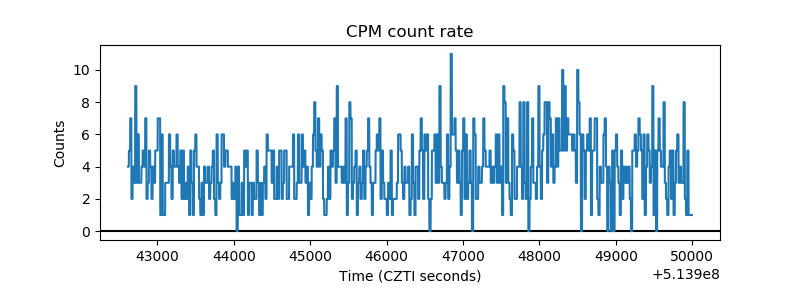 |
| CZT Counter | 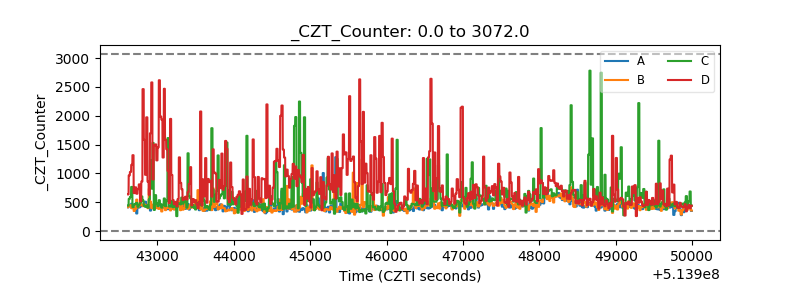 |
| +2.5 Volts monitor |  |
| +5 Volts monitor |  |
| _ROLL_ROT | 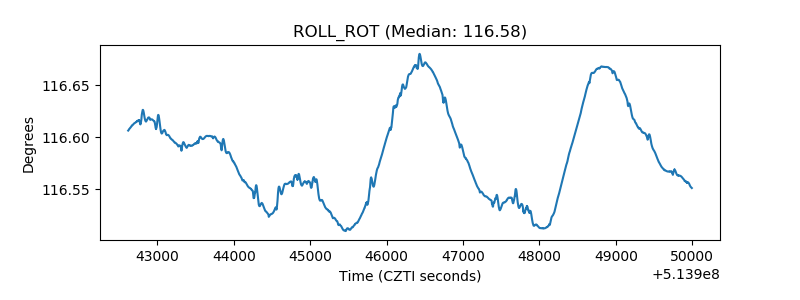 |
| _Roll_DEC | 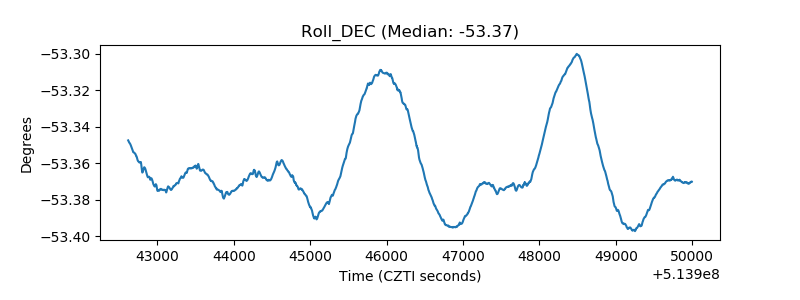 |
| _Roll_RA | 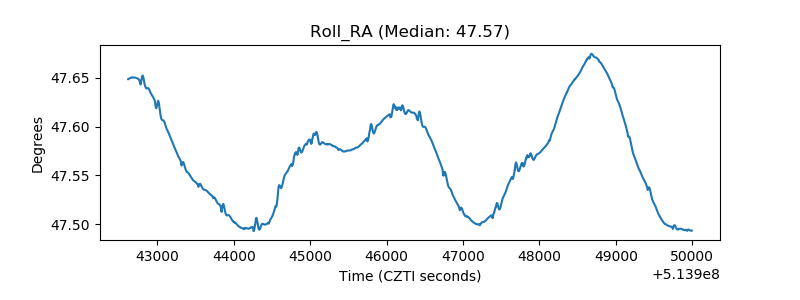 |
| Veto Counter | 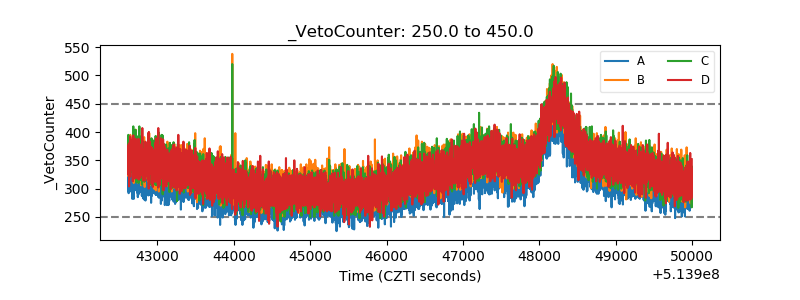 |