| Param | Original file | Final file |
|---|---|---|
| Filename | modeM0/AS1A14_083T10_9000006566_57065cztM0_level2.fits | modeM0/AS1A14_083T10_9000006566_57065cztM0_level2_quad_clean.evt |
| Size (bytes) | 458,455,680 | 104,690,880 |
| Size | 437.2 MB | 99.8 MB |
| Events in quadrant A | 3,496,684 | 682,581 |
| Events in quadrant B | 3,351,111 | 745,663 |
| Events in quadrant C | 4,137,870 | 659,848 |
| Events in quadrant D | 5,421,402 | 577,190 |
| Mode M0 | |||
|---|---|---|---|
| Quadrant | BADHDUFLAG | Total packets | Discarded packets |
| A | 0 | 15802 | 0 |
| B | 0 | 15259 | 1 |
| C | 0 | 17283 | 0 |
| D | 0 | 21101 | 0 |
| Mode SS | |||
|---|---|---|---|
| Quadrant | BADHDUFLAG | Total packets | Discarded packets |
| A | 0 | 146 | 0 |
| B | 0 | 146 | 0 |
| C | 0 | 146 | 0 |
| D | 0 | 146 | 0 |
| Quadrant | Total seconds | Saturated seconds | Saturation percentage |
|---|---|---|---|
| A | 7246 | 118 | 1.628485% |
| B | 7246 | 49 | 0.676235% |
| C | 7246 | 99 | 1.366271% |
| D | 7246 | 623 | 8.597847% |
Noise dominated data is calculated using 1-second bins in cleaned event files. If a bin has >2000 counts, and if more than 50% of those come from <1% of pixels, then it is considered to be noise-dominated and hence unusable.
| Quadrant | # 1 sec bins | Bins with >0 counts | Bins with >2000 counts | High rate bins dominated by noise | Noise dominated (total time) | Noise dominated (detector-on time) | Marked lightcurve |
|---|---|---|---|---|---|---|---|
| A | 7246 | 7246 | 103 | 103 | 1.42% | 1.42% | 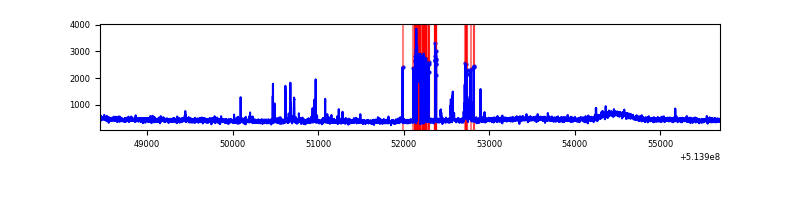 |
| B | 7246 | 7246 | 23 | 23 | 0.32% | 0.32% | 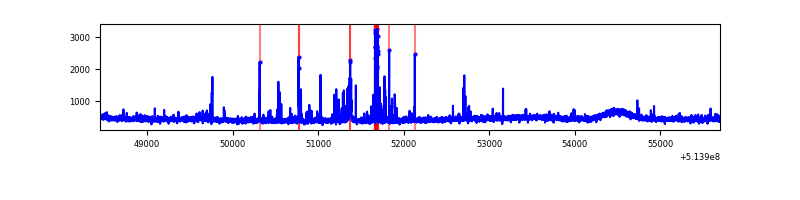 |
| C | 7246 | 7246 | 89 | 89 | 1.23% | 1.23% | 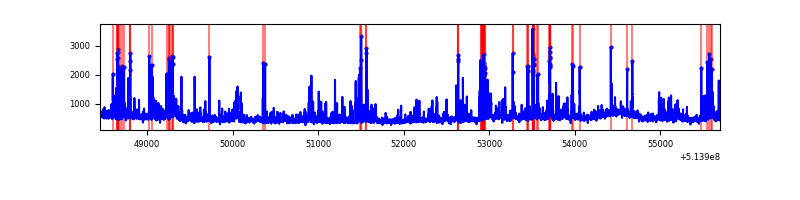 |
| D | 7246 | 7246 | 430 | 430 | 5.93% | 5.93% | 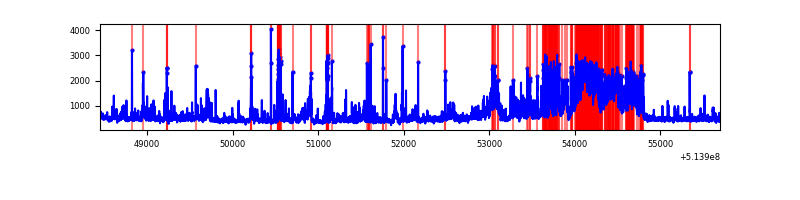 |
Top three noisy pixels from each quadrant. If the there are fewer than three noisy pixels in the level2.evt file, extra rows are filled as -1
| Pixel properties | Quadrant properties | ||||||
|---|---|---|---|---|---|---|---|
| Quadrant | DetID | PixID | Counts | Sigma | Mean | Median | Sigma |
| A | 7 | 64 | 364786 | 1856.96 | 790 | 767 | 196.0 |
| A | 3 | 245 | 39082 | 195.46 | 790 | 767 | 196.0 |
| A | 4 | 3 | 25047 | 123.86 | 790 | 767 | 196.0 |
| B | 0 | 213 | 136820 | 805.36 | 784 | 754 | 169.0 |
| B | 8 | 234 | 47460 | 276.44 | 784 | 754 | 169.0 |
| B | 12 | 111 | 20828 | 118.81 | 784 | 754 | 169.0 |
| C | 12 | 254 | 440557 | 2104.07 | 769 | 760 | 209.0 |
| C | 12 | 252 | 177640 | 846.23 | 769 | 760 | 209.0 |
| C | 14 | 67 | 157445 | 749.61 | 769 | 760 | 209.0 |
| D | 12 | 33 | 991604 | 4740.11 | 747 | 710 | 209.0 |
| D | 15 | 142 | 859450 | 4107.93 | 747 | 710 | 209.0 |
| D | 12 | 251 | 204963 | 977.08 | 747 | 710 | 209.0 |
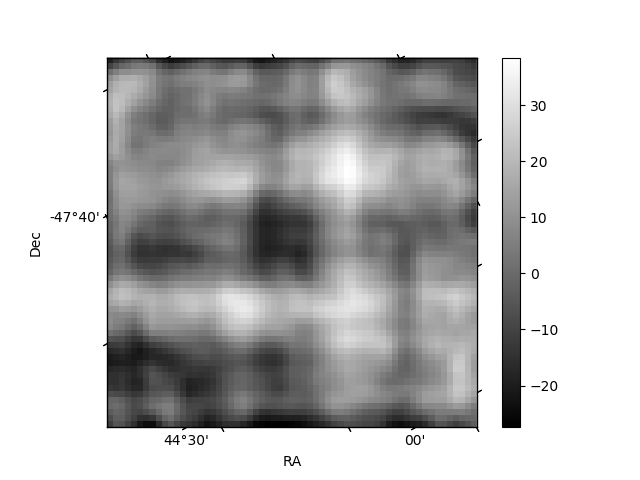
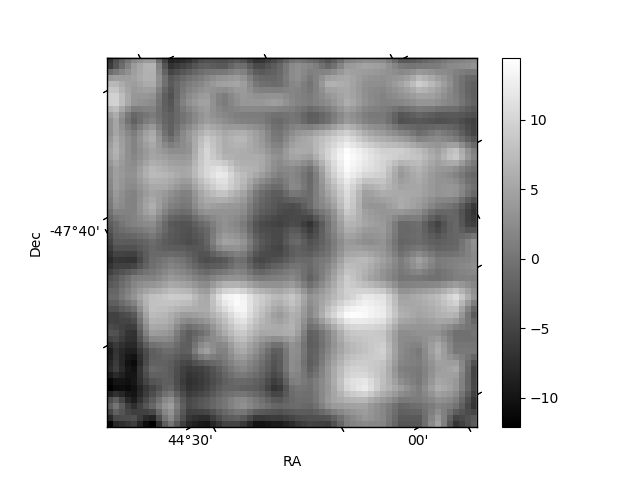
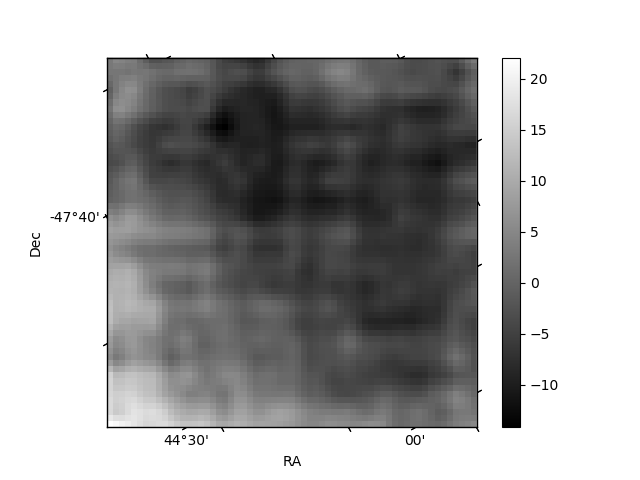
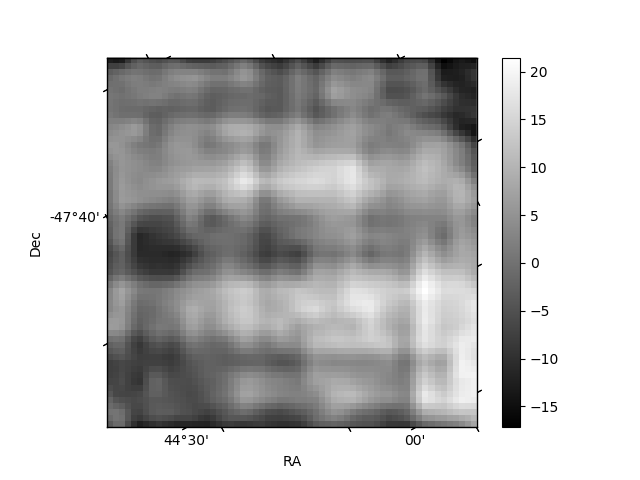
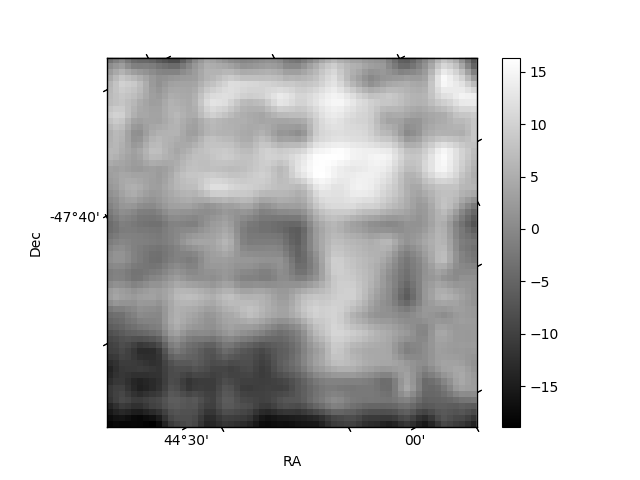
Histogram calculated using DETX and DETY for each event in the final _common_clean file
| Quadrant A | 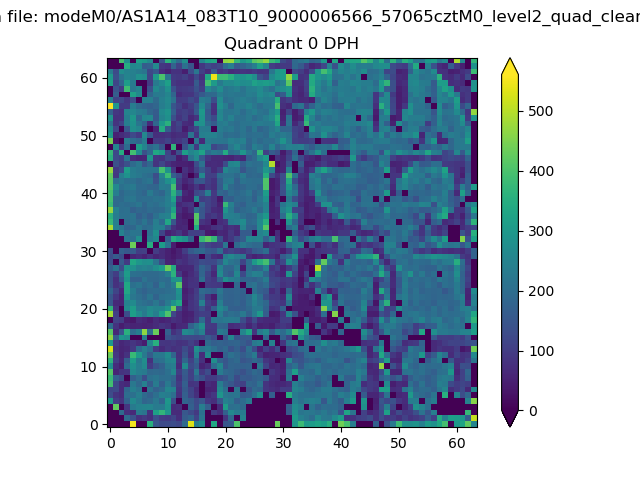 |
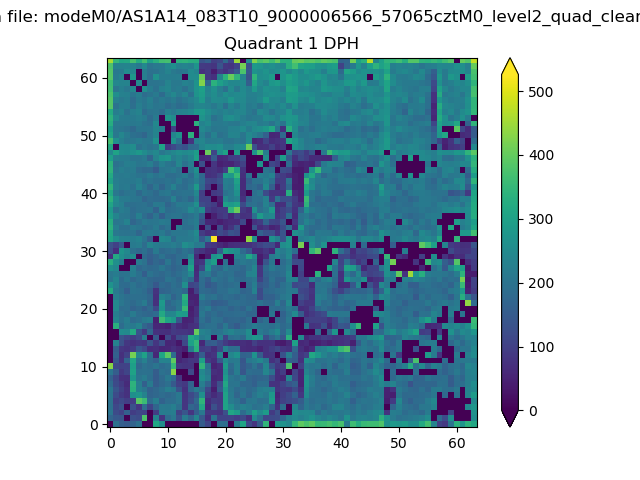 |
Quadrant B |
|---|---|---|---|
| Quadrant D | 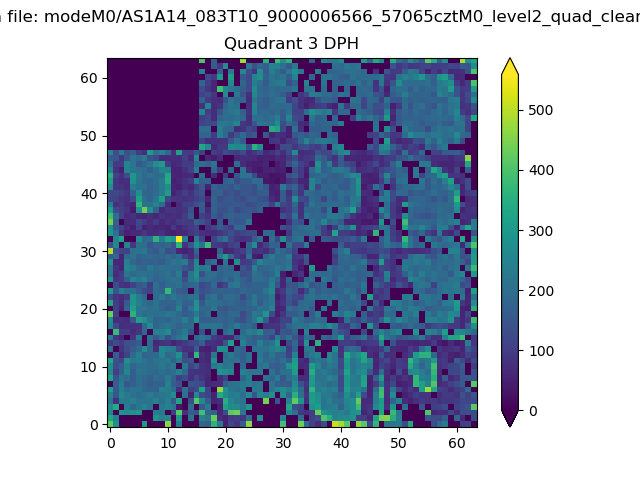 |
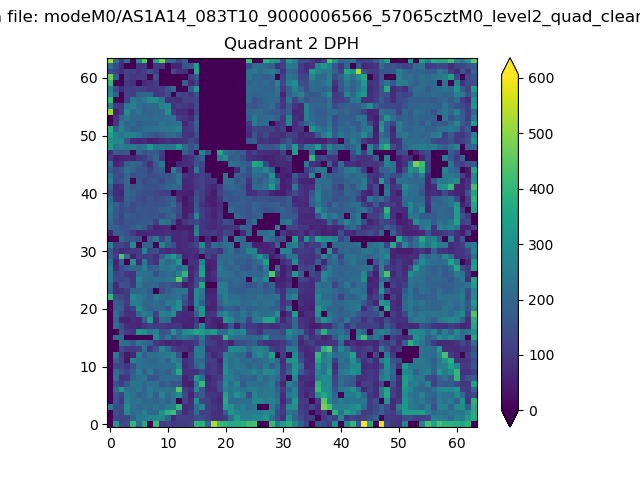 |
Quadrant C |
| Plot type | Count rate plots | Images |
|---|---|---|
| Comparison with Poisson distribution Blue bars denote a histogram of data divided into 1 sec bins. Red curve is a Poisson curve with rate = median count rate of data. |
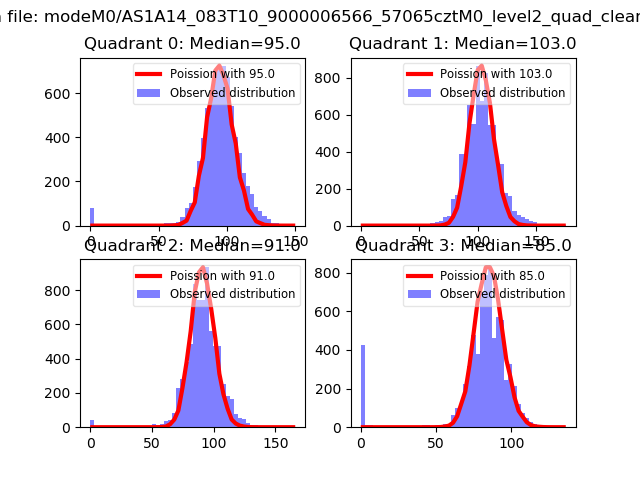 |
 |
| Quadrant-wise count rates Data is divided into 100 sec bins |
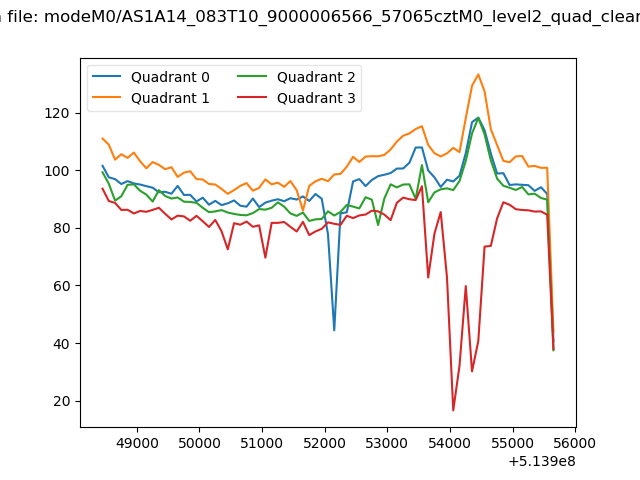 |
|
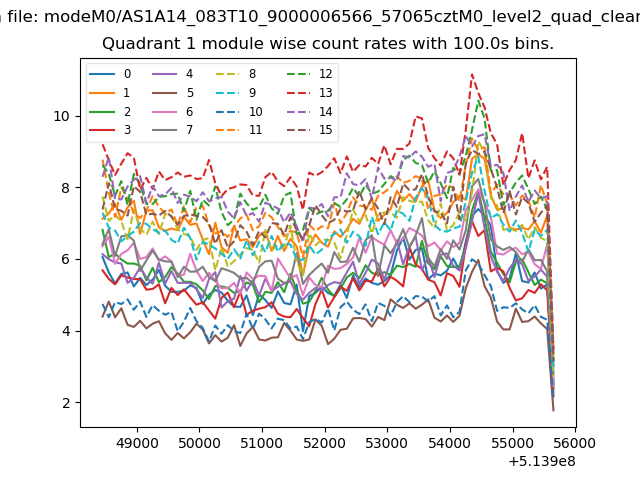
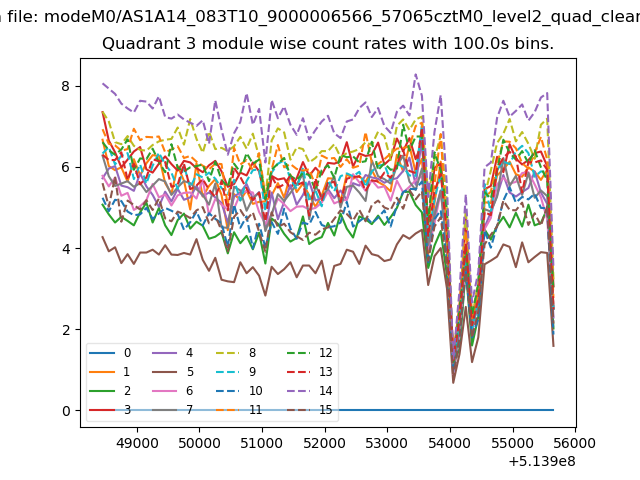
| Module-wise count rates for Quadrant A Data is divided into 100 sec bins |
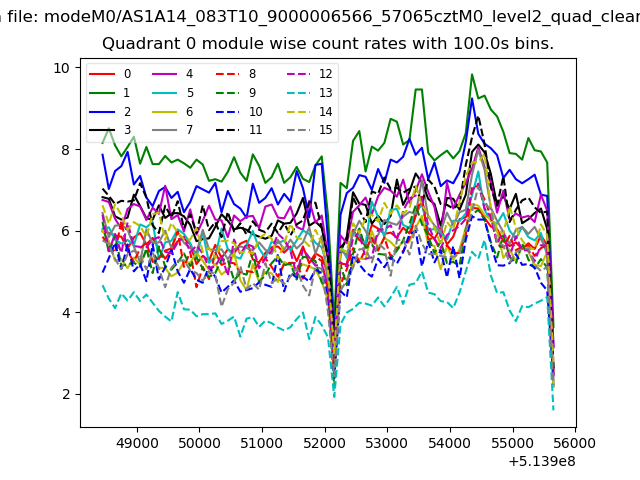 |
 |
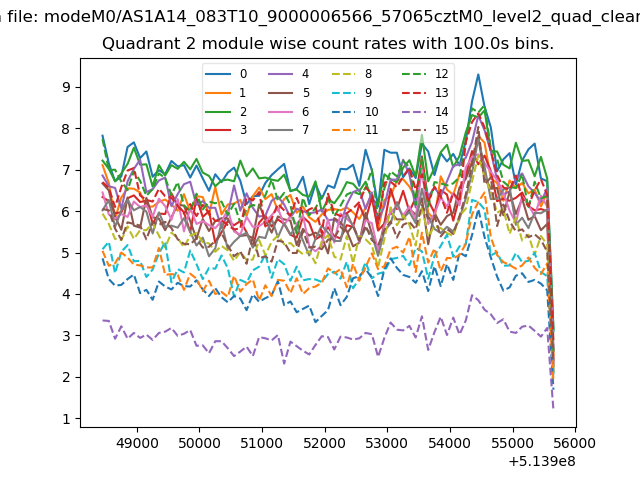
| Module-wise count rates for Quadrant B Data is divided into 100 sec bins |
 |
 |
| Module-wise count rates for Quadrant C Data is divided into 100 sec bins |
 |
 |
| Module-wise count rates for Quadrant D Data is divided into 100 sec bins |
 |
 |
| Parameter | Plot |
|---|---|
| CZT HV Monitor |  |
| D_VDD | 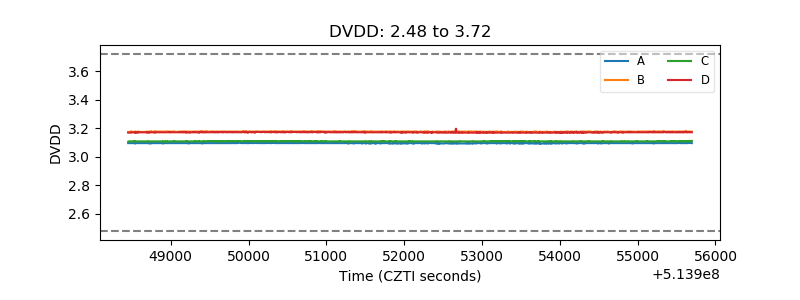 |
| Temperature 1 | 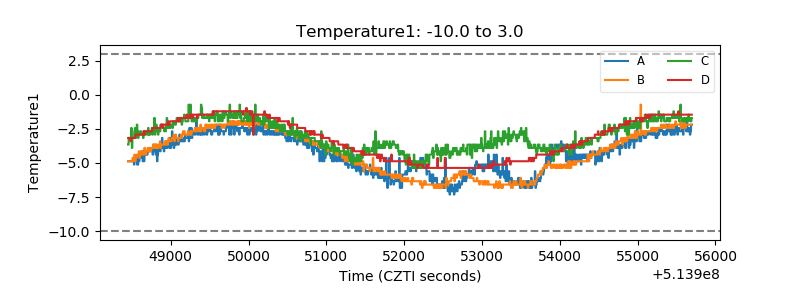 |
| Veto HV Monitor | 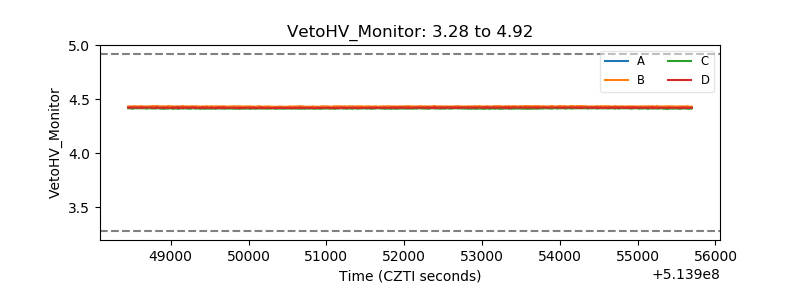 |
| Veto LLD | 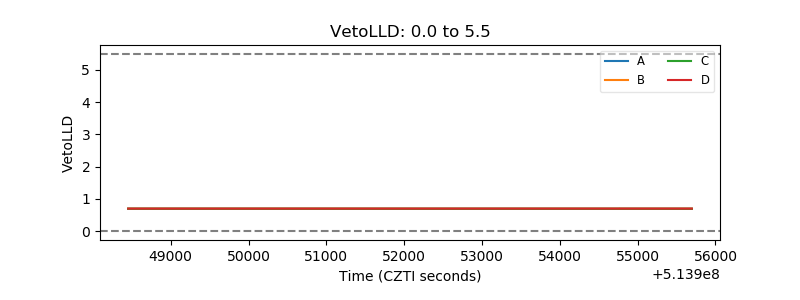 |
| Alpha Counter | 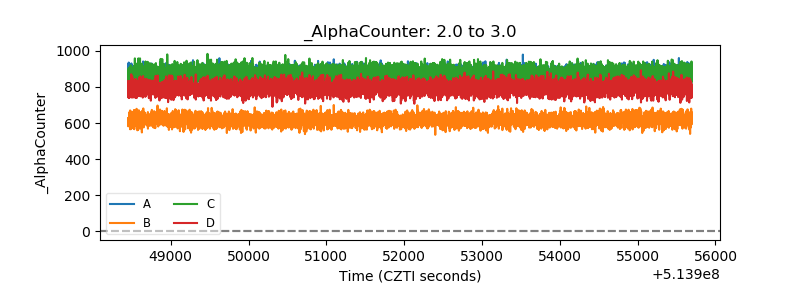 |
| _CPM_Rate | 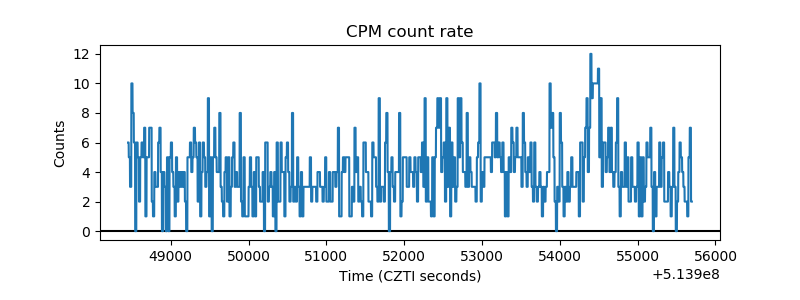 |
| CZT Counter | 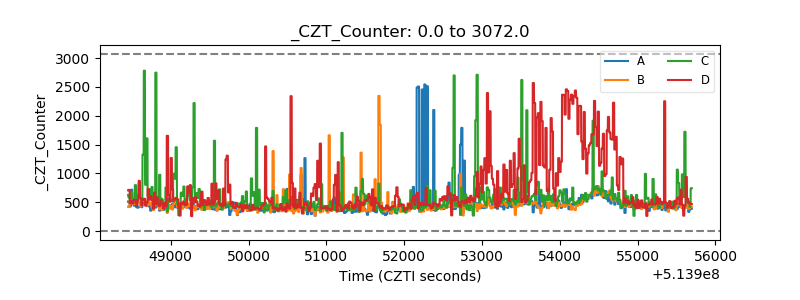 |
| +2.5 Volts monitor |  |
| +5 Volts monitor |  |
| _ROLL_ROT | 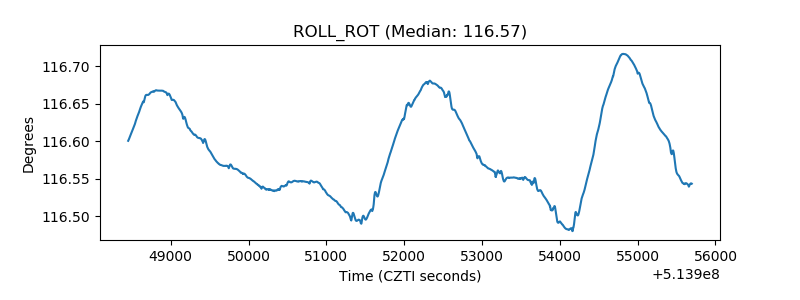 |
| _Roll_DEC | 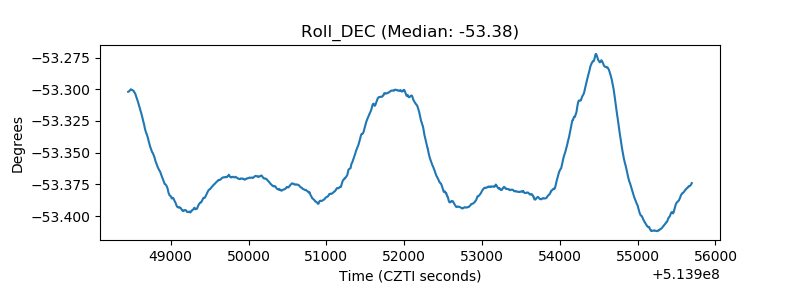 |
| _Roll_RA | 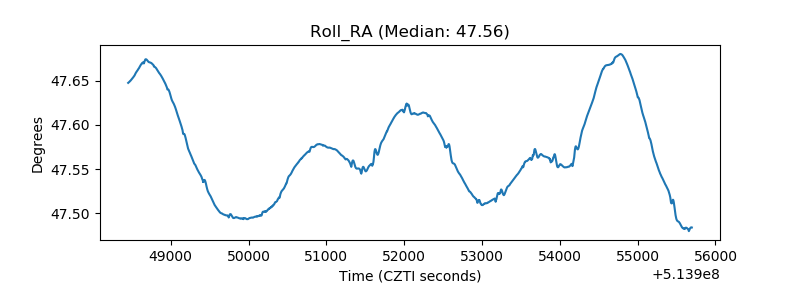 |
| Veto Counter | 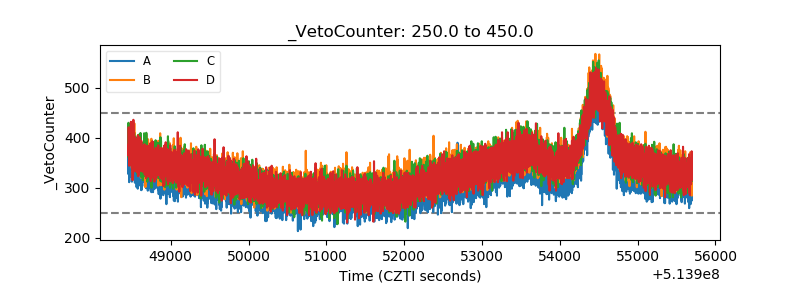 |