| Param | Original file | Final file |
|---|---|---|
| Filename | modeM0/AS1A14_083T10_9000006566_57068cztM0_level2.fits | modeM0/AS1A14_083T10_9000006566_57068cztM0_level2_quad_clean.evt |
| Size (bytes) | 1,195,701,120 | 255,723,840 |
| Size | 1.1 GB | 243.9 MB |
| Events in quadrant A | 8,092,020 | 1,687,075 |
| Events in quadrant B | 9,355,340 | 1,785,398 |
| Events in quadrant C | 10,450,651 | 1,604,625 |
| Events in quadrant D | 14,947,330 | 1,405,106 |
| Mode M9 | |||
|---|---|---|---|
| Quadrant | BADHDUFLAG | Total packets | Discarded packets |
| A | 0 | 15 | 0 |
| B | 0 | 15 | 0 |
| C | 0 | 15 | 0 |
| D | 0 | 15 | 0 |
| Mode M0 | |||
|---|---|---|---|
| Quadrant | BADHDUFLAG | Total packets | Discarded packets |
| A | 0 | 38034 | 3 |
| B | 0 | 41010 | 3 |
| C | 0 | 43427 | 3 |
| D | 0 | 57123 | 5 |
| Mode SS | |||
|---|---|---|---|
| Quadrant | BADHDUFLAG | Total packets | Discarded packets |
| A | 0 | 372 | 0 |
| B | 0 | 372 | 0 |
| C | 0 | 372 | 0 |
| D | 0 | 372 | 0 |
| Quadrant | Total seconds | Saturated seconds | Saturation percentage |
|---|---|---|---|
| A | 18285 | 217 | 1.186765% |
| B | 18285 | 548 | 2.996992% |
| C | 18285 | 272 | 1.487558% |
| D | 18285 | 1352 | 7.394039% |
Noise dominated data is calculated using 1-second bins in cleaned event files. If a bin has >2000 counts, and if more than 50% of those come from <1% of pixels, then it is considered to be noise-dominated and hence unusable.
| Quadrant | # 1 sec bins | Bins with >0 counts | Bins with >2000 counts | High rate bins dominated by noise | Noise dominated (total time) | Noise dominated (detector-on time) | Marked lightcurve |
|---|---|---|---|---|---|---|---|
| A | 19770 | 18285 | 56 | 56 | 0.28% | 0.31% | 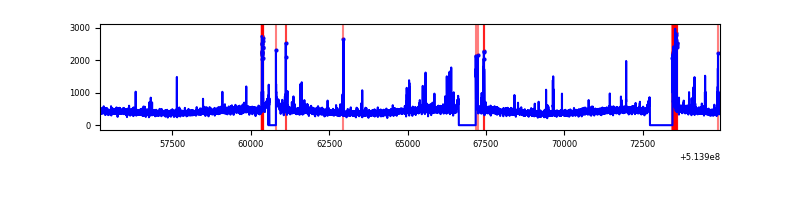 |
| B | 19770 | 18285 | 219 | 219 | 1.11% | 1.20% | 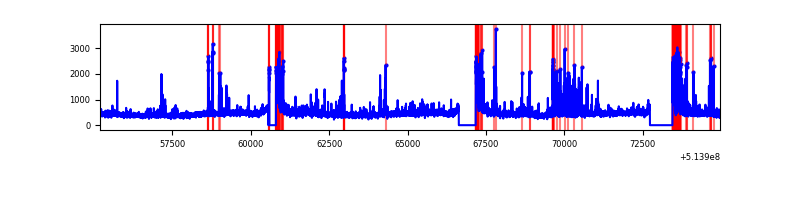 |
| C | 19770 | 18288 | 189 | 189 | 0.96% | 1.03% | 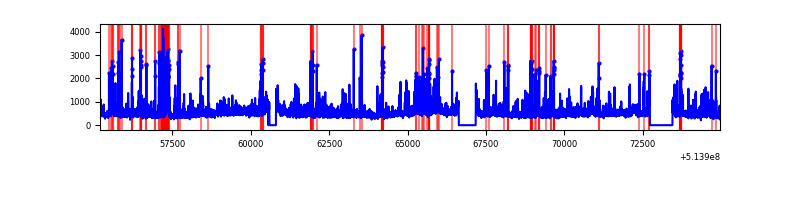 |
| D | 19770 | 18287 | 1340 | 1340 | 6.78% | 7.33% | 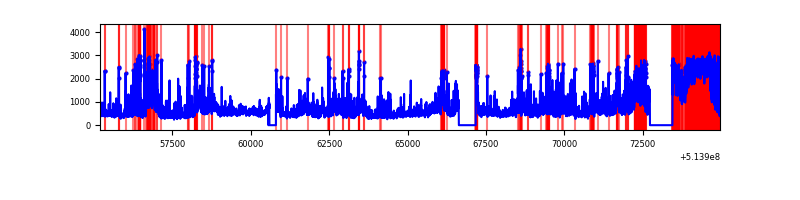 |
Top three noisy pixels from each quadrant. If the there are fewer than three noisy pixels in the level2.evt file, extra rows are filled as -1
| Pixel properties | Quadrant properties | ||||||
|---|---|---|---|---|---|---|---|
| Quadrant | DetID | PixID | Counts | Sigma | Mean | Median | Sigma |
| A | 7 | 64 | 119015 | 242.36 | 1963 | 1911 | 483.2 |
| A | 10 | 251 | 98995 | 200.93 | 1963 | 1911 | 483.2 |
| A | 13 | 248 | 85576 | 173.15 | 1963 | 1911 | 483.2 |
| B | 10 | 16 | 657606 | 1596.4 | 1908 | 1835 | 410.8 |
| B | 4 | 171 | 285500 | 690.55 | 1908 | 1835 | 410.8 |
| B | 0 | 213 | 186650 | 449.91 | 1908 | 1835 | 410.8 |
| C | 1 | 16 | 659471 | 1291.57 | 1892 | 1877 | 509.1 |
| C | 6 | 223 | 298177 | 581.96 | 1892 | 1877 | 509.1 |
| C | 14 | 67 | 289331 | 564.58 | 1892 | 1877 | 509.1 |
| D | 15 | 142 | 3600271 | 6956.39 | 1840 | 1754 | 517.3 |
| D | 12 | 33 | 2805813 | 5420.61 | 1840 | 1754 | 517.3 |
| D | 2 | 249 | 358463 | 689.56 | 1840 | 1754 | 517.3 |
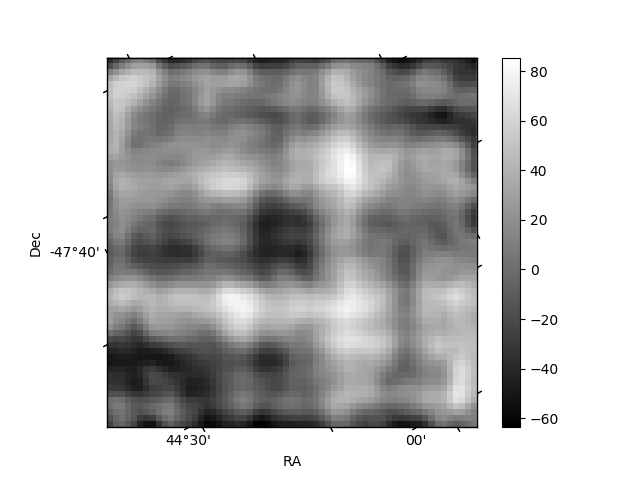
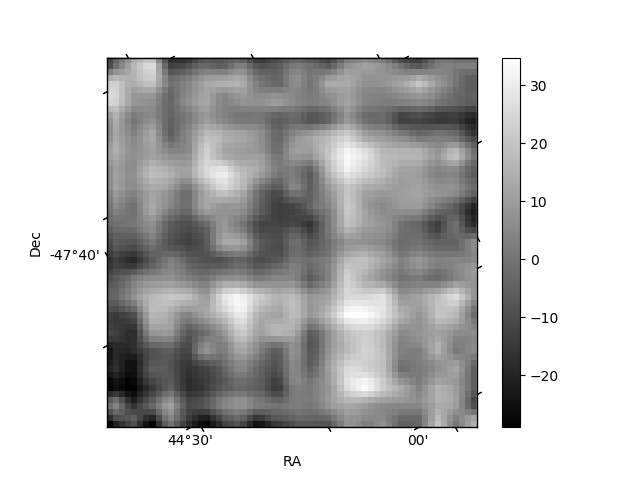
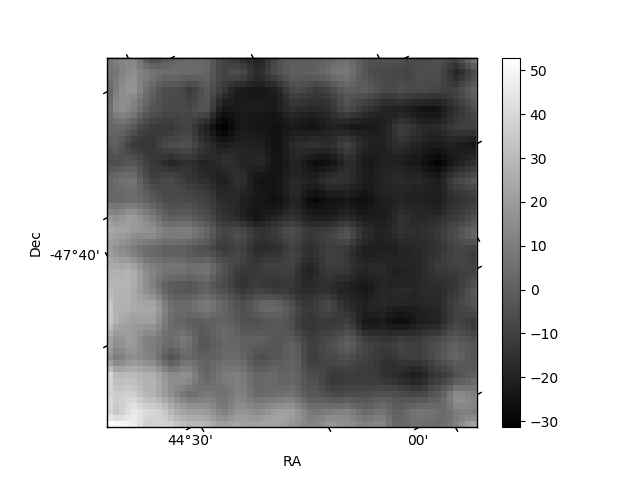
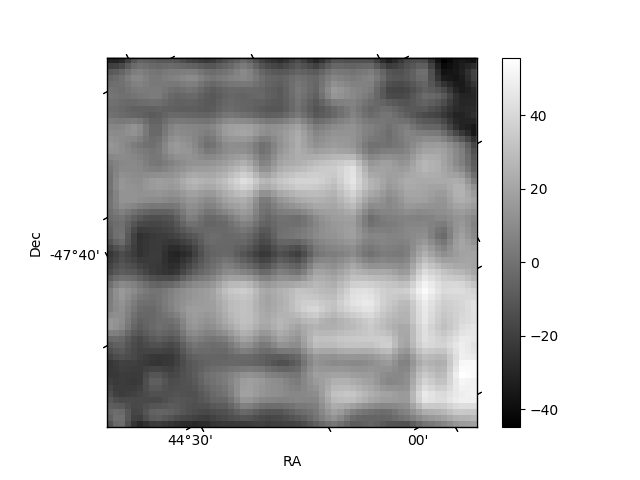
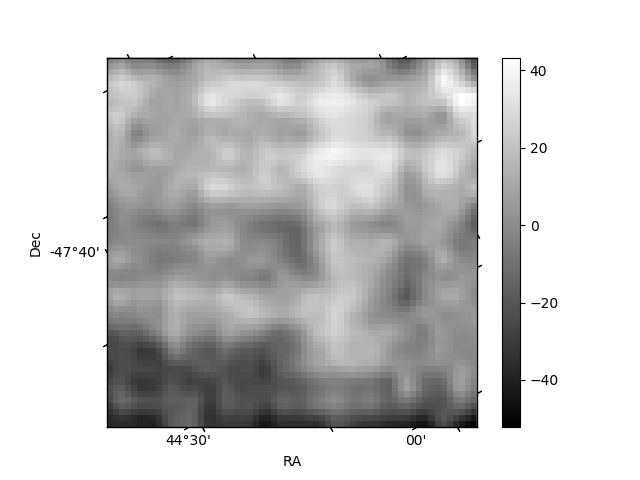
Histogram calculated using DETX and DETY for each event in the final _common_clean file
| Quadrant A | 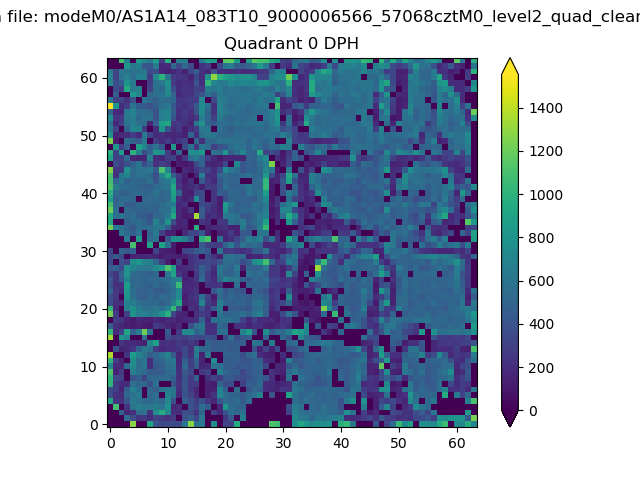 |
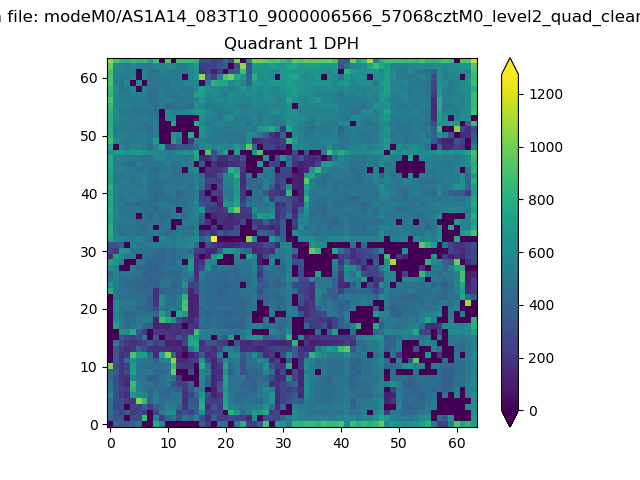 |
Quadrant B |
|---|---|---|---|
| Quadrant D | 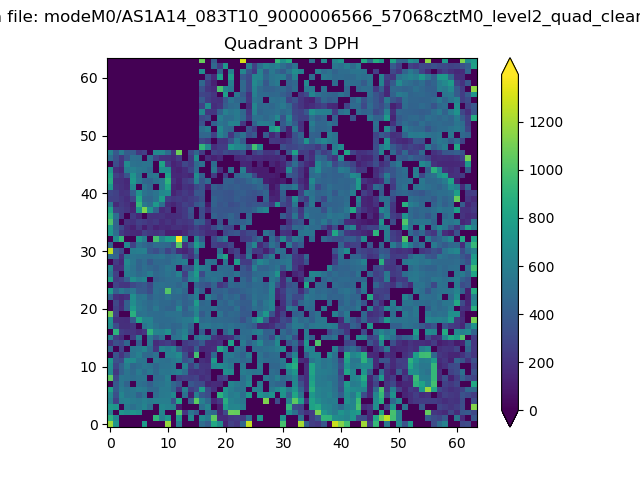 |
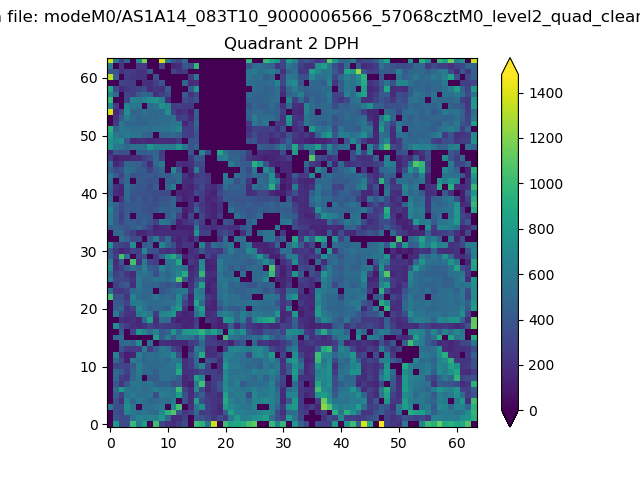 |
Quadrant C |
| Plot type | Count rate plots | Images |
|---|---|---|
| Comparison with Poisson distribution Blue bars denote a histogram of data divided into 1 sec bins. Red curve is a Poisson curve with rate = median count rate of data. |
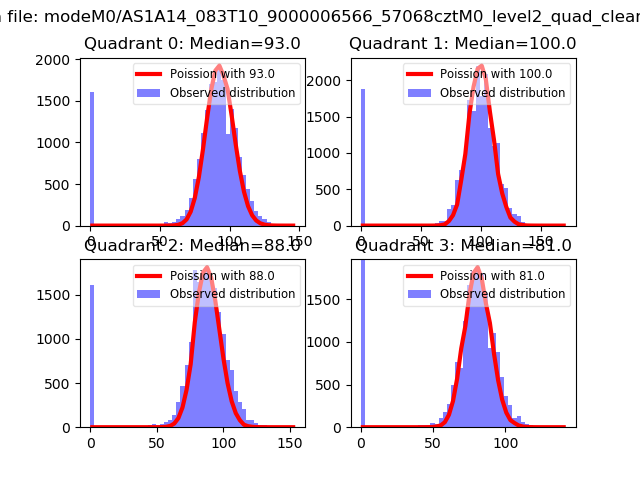 |
 |
| Quadrant-wise count rates Data is divided into 100 sec bins |
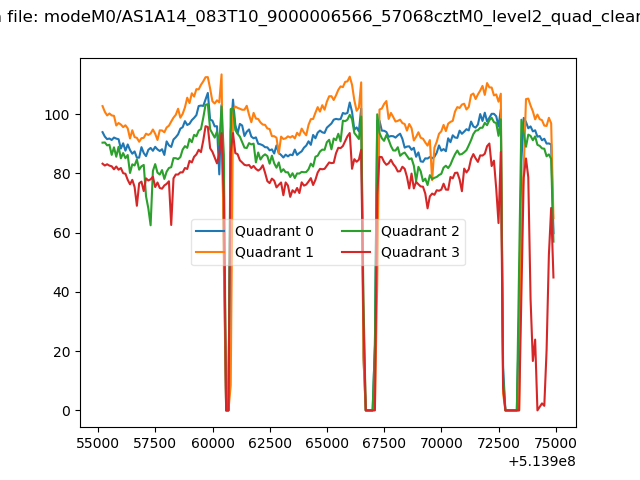 |
|
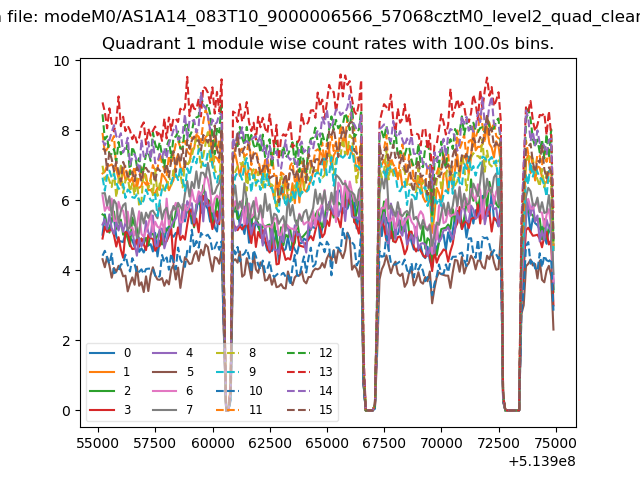
| Module-wise count rates for Quadrant A Data is divided into 100 sec bins |
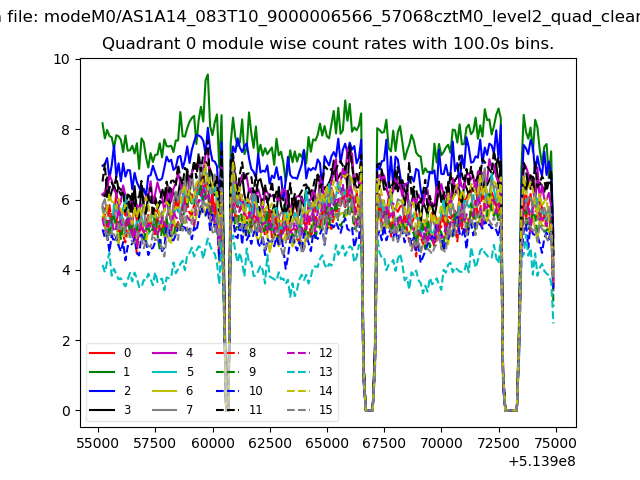 |
 |
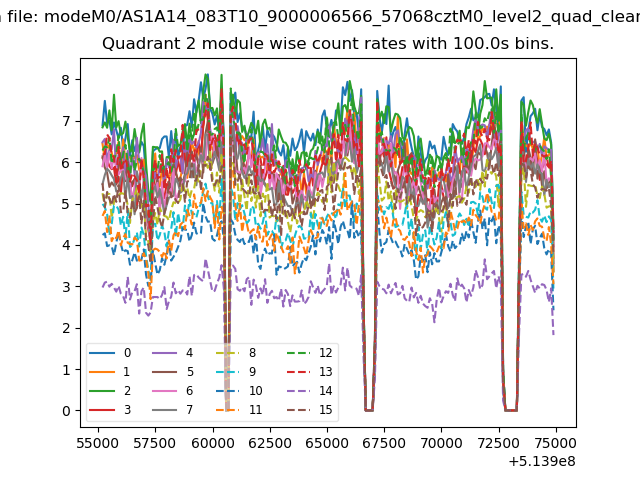
| Module-wise count rates for Quadrant B Data is divided into 100 sec bins |
 |
 |
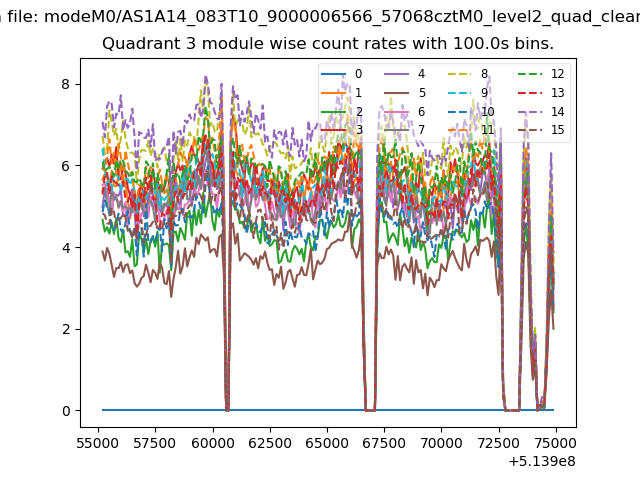
| Module-wise count rates for Quadrant C Data is divided into 100 sec bins |
 |
 |
| Module-wise count rates for Quadrant D Data is divided into 100 sec bins |
 |
 |
| Parameter | Plot |
|---|---|
| CZT HV Monitor | 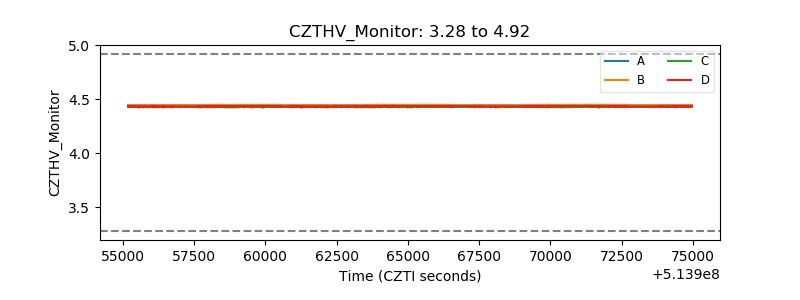 |
| D_VDD | 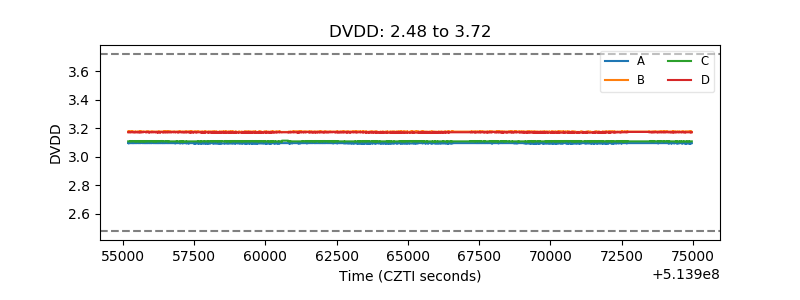 |
| Temperature 1 | 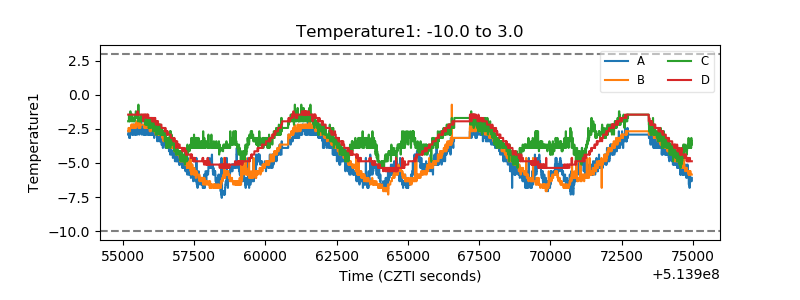 |
| Veto HV Monitor | 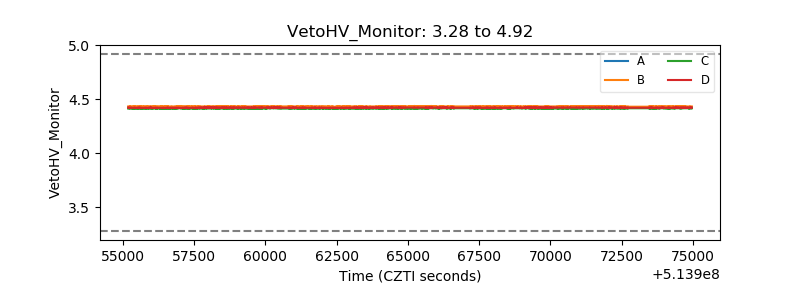 |
| Veto LLD | 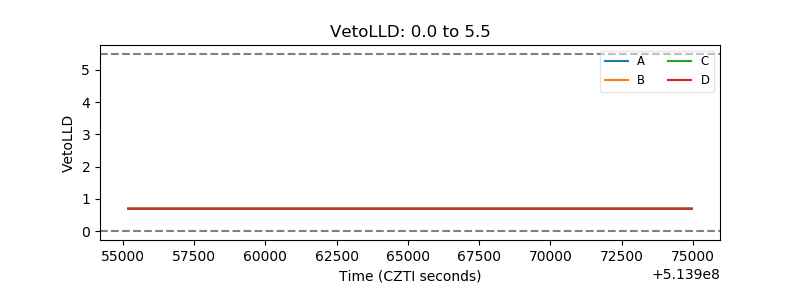 |
| Alpha Counter | 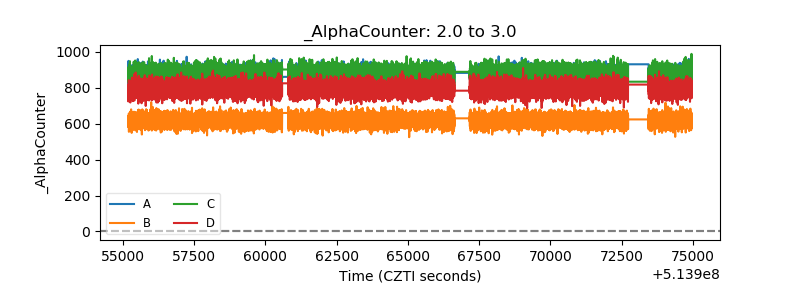 |
| _CPM_Rate | 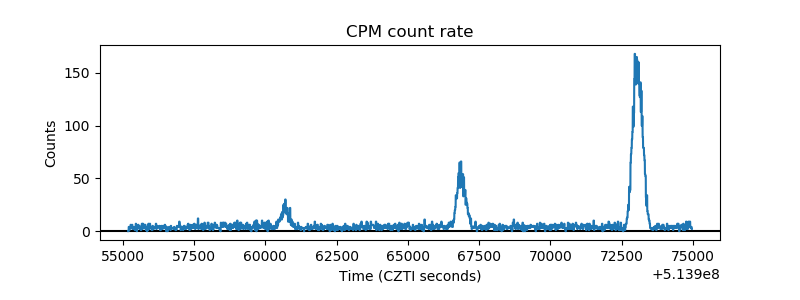 |
| CZT Counter | 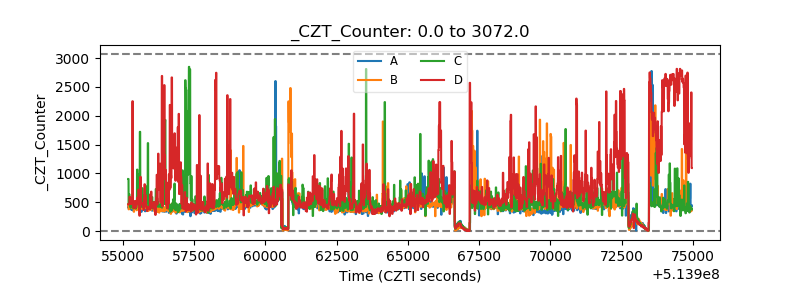 |
| +2.5 Volts monitor | 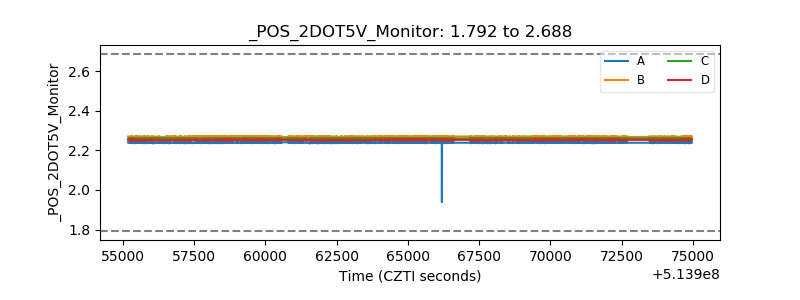 |
| +5 Volts monitor | 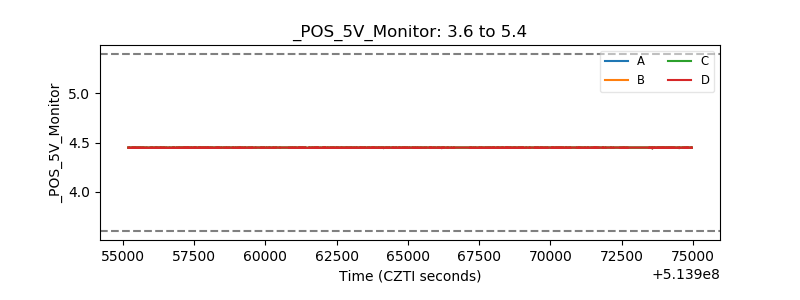 |
| _ROLL_ROT | 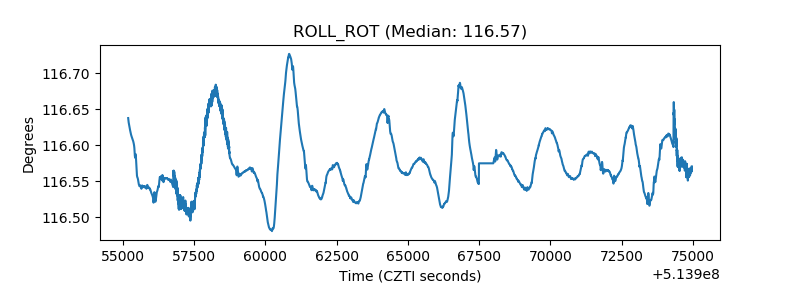 |
| _Roll_DEC | 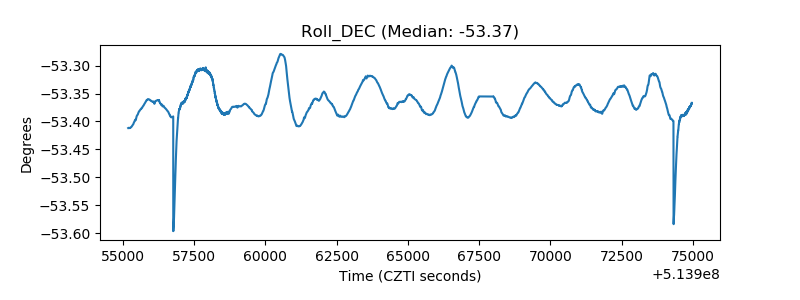 |
| _Roll_RA | 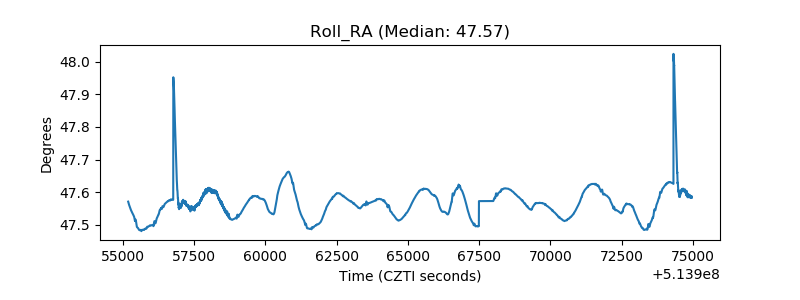 |
| Veto Counter | 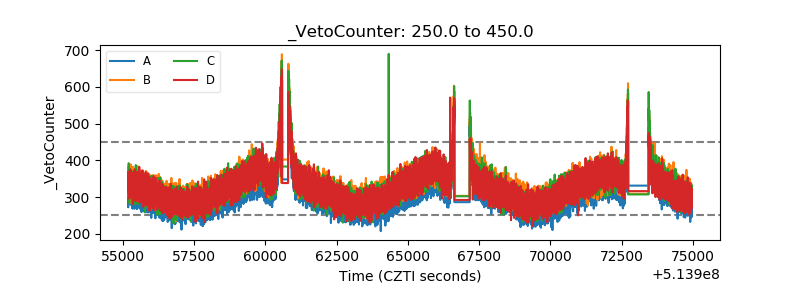 |