| Param | Original file | Final file |
|---|---|---|
| Filename | modeM0/AS1A14_083T10_9000006566_57069cztM0_level2.fits | modeM0/AS1A14_083T10_9000006566_57069cztM0_level2_quad_clean.evt |
| Size (bytes) | 524,937,600 | 94,331,520 |
| Size | 500.6 MB | 90.0 MB |
| Events in quadrant A | 3,097,962 | 640,374 |
| Events in quadrant B | 4,211,968 | 658,747 |
| Events in quadrant C | 3,722,267 | 609,386 |
| Events in quadrant D | 7,870,445 | 473,232 |
| Mode M9 | |||
|---|---|---|---|
| Quadrant | BADHDUFLAG | Total packets | Discarded packets |
| A | 0 | 9 | 0 |
| B | 0 | 9 | 0 |
| C | 0 | 9 | 0 |
| D | 0 | 9 | 0 |
| Mode M0 | |||
|---|---|---|---|
| Quadrant | BADHDUFLAG | Total packets | Discarded packets |
| A | 0 | 14312 | 1 |
| B | 0 | 17323 | 1 |
| C | 0 | 15760 | 1 |
| D | 0 | 28146 | 1 |
| Mode SS | |||
|---|---|---|---|
| Quadrant | BADHDUFLAG | Total packets | Discarded packets |
| A | 0 | 138 | 0 |
| B | 0 | 138 | 0 |
| C | 0 | 138 | 0 |
| D | 0 | 138 | 0 |
| Quadrant | Total seconds | Saturated seconds | Saturation percentage |
|---|---|---|---|
| A | 6806 | 45 | 0.661181% |
| B | 6807 | 408 | 5.993830% |
| C | 6807 | 74 | 1.087116% |
| D | 6807 | 1310 | 19.244895% |
Noise dominated data is calculated using 1-second bins in cleaned event files. If a bin has >2000 counts, and if more than 50% of those come from <1% of pixels, then it is considered to be noise-dominated and hence unusable.
| Quadrant | # 1 sec bins | Bins with >0 counts | Bins with >2000 counts | High rate bins dominated by noise | Noise dominated (total time) | Noise dominated (detector-on time) | Marked lightcurve |
|---|---|---|---|---|---|---|---|
| A | 7721 | 6807 | 32 | 32 | 0.41% | 0.47% | 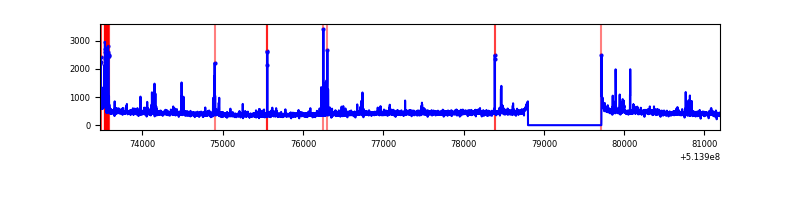 |
| B | 7722 | 6808 | 208 | 208 | 2.69% | 3.06% | 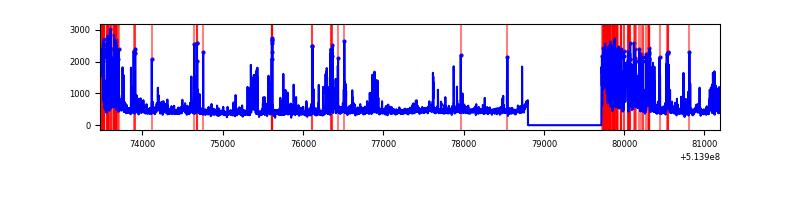 |
| C | 7722 | 6808 | 63 | 63 | 0.82% | 0.93% | 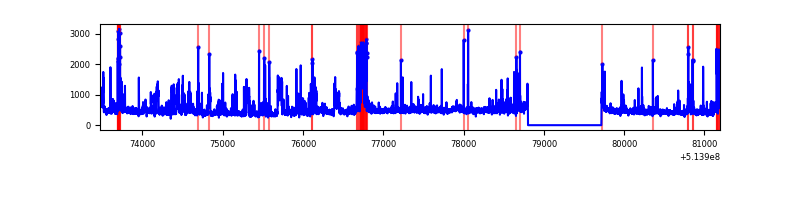 |
| D | 7722 | 6808 | 1405 | 1405 | 18.19% | 20.64% | 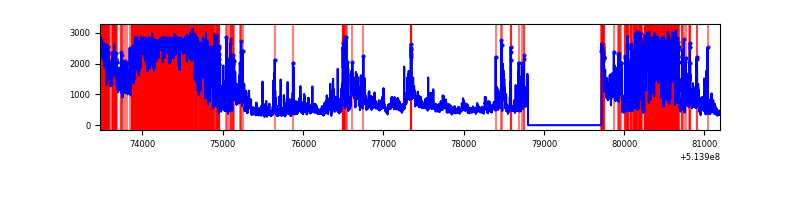 |
Top three noisy pixels from each quadrant. If the there are fewer than three noisy pixels in the level2.evt file, extra rows are filled as -1
| Pixel properties | Quadrant properties | ||||||
|---|---|---|---|---|---|---|---|
| Quadrant | DetID | PixID | Counts | Sigma | Mean | Median | Sigma |
| A | 10 | 251 | 125288 | 688.85 | 726 | 707 | 180.9 |
| A | 3 | 14 | 51657 | 281.72 | 726 | 707 | 180.9 |
| A | 13 | 248 | 39873 | 216.56 | 726 | 707 | 180.9 |
| B | 4 | 171 | 587688 | 3884.18 | 699 | 672 | 151.1 |
| B | 10 | 16 | 546132 | 3609.21 | 699 | 672 | 151.1 |
| B | 5 | 248 | 103994 | 683.66 | 699 | 672 | 151.1 |
| C | 1 | 16 | 288204 | 1504.26 | 699 | 694 | 191.1 |
| C | 13 | 3 | 176227 | 918.39 | 699 | 694 | 191.1 |
| C | 14 | 245 | 128256 | 667.41 | 699 | 694 | 191.1 |
| D | 12 | 33 | 2804836 | 15328.57 | 636 | 608 | 182.9 |
| D | 15 | 142 | 2120235 | 11586.38 | 636 | 608 | 182.9 |
| D | 7 | 96 | 95786 | 520.27 | 636 | 608 | 182.9 |
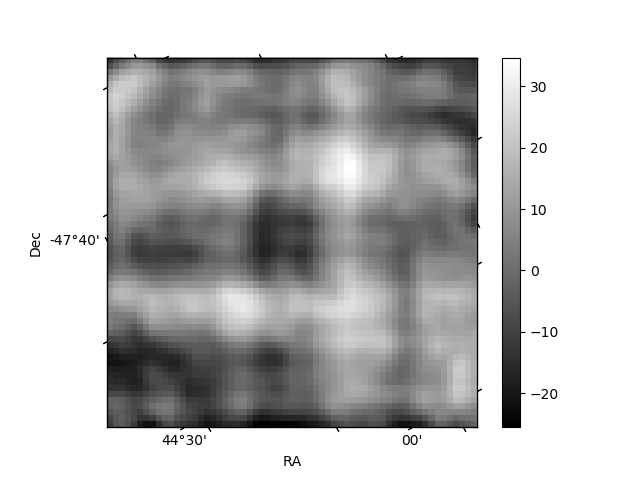
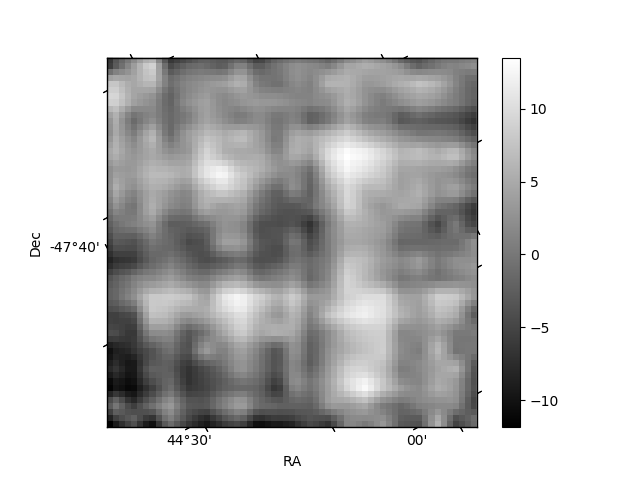
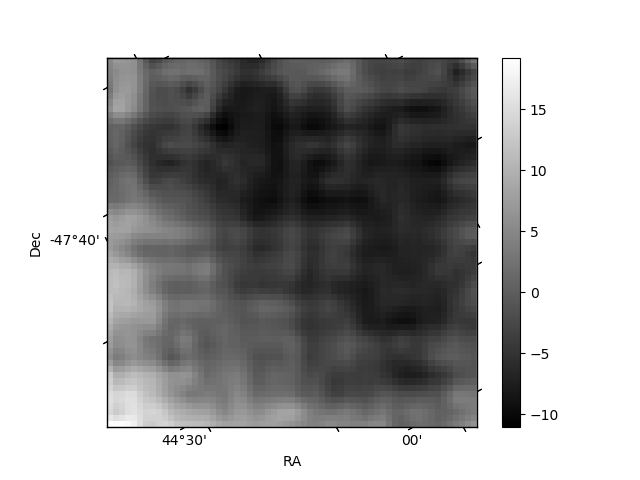
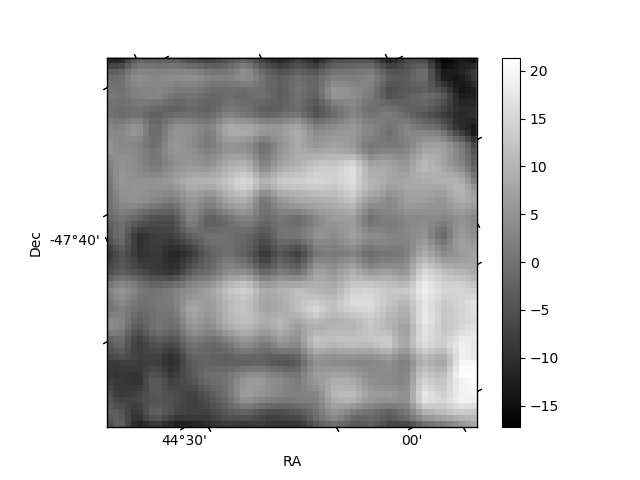
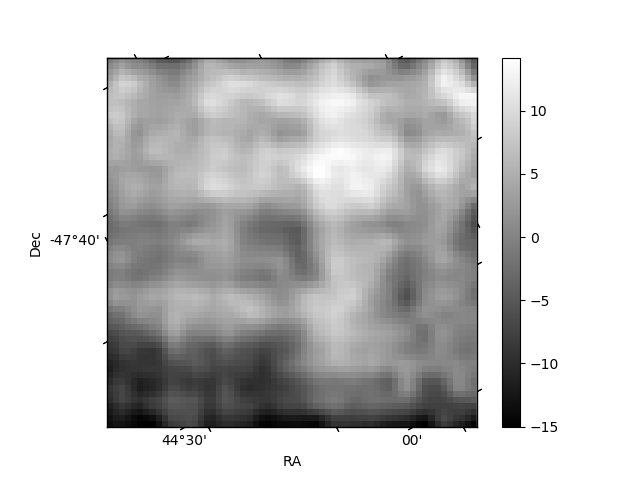
Histogram calculated using DETX and DETY for each event in the final _common_clean file
| Quadrant A | 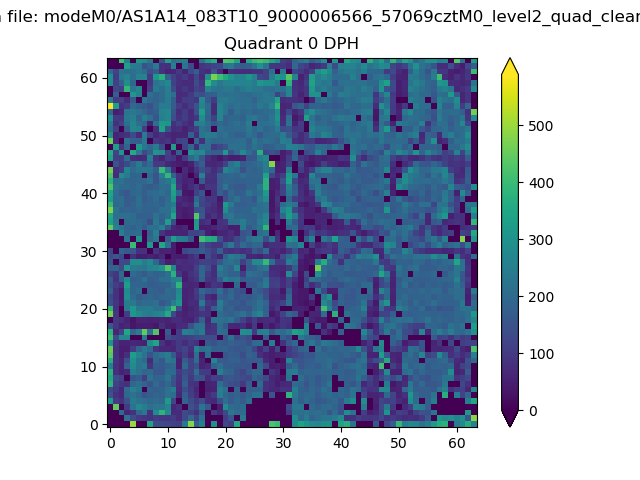 |
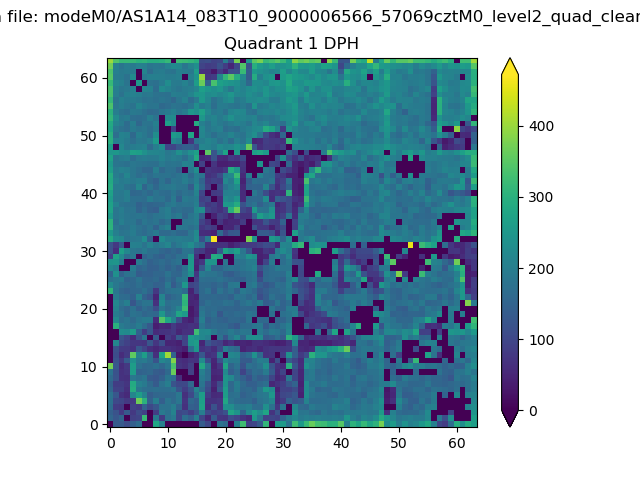 |
Quadrant B |
|---|---|---|---|
| Quadrant D | 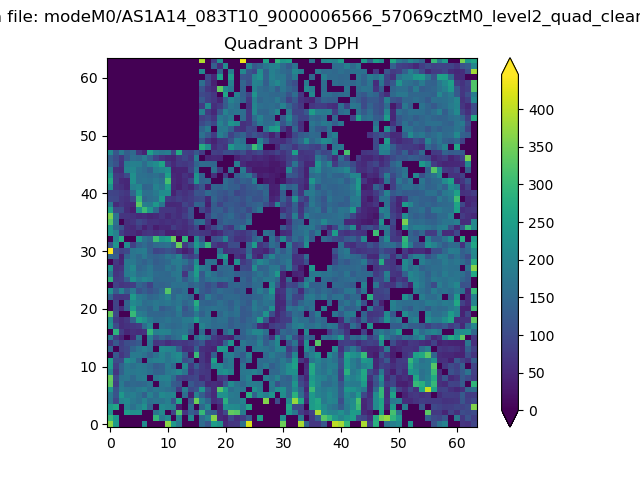 |
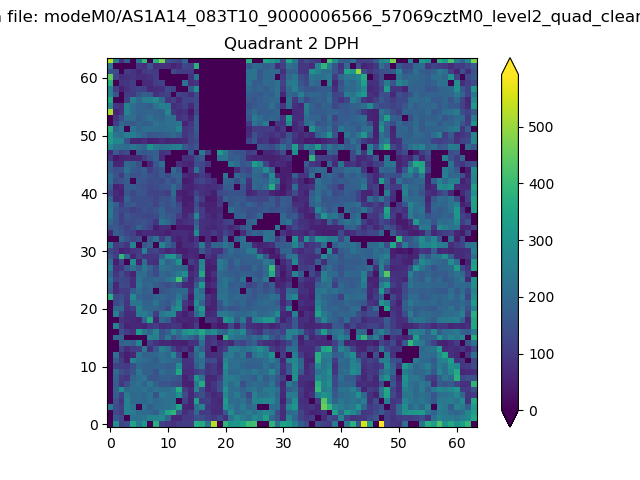 |
Quadrant C |
| Plot type | Count rate plots | Images |
|---|---|---|
| Comparison with Poisson distribution Blue bars denote a histogram of data divided into 1 sec bins. Red curve is a Poisson curve with rate = median count rate of data. |
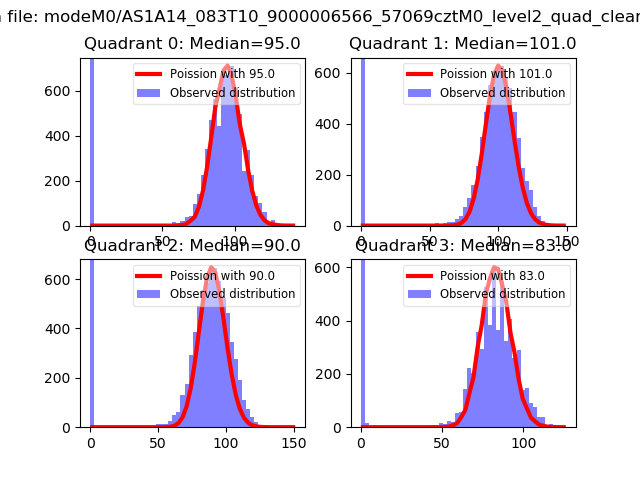 |
 |
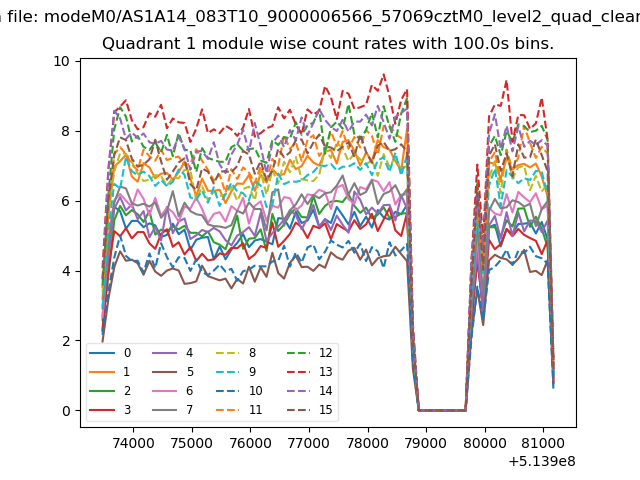
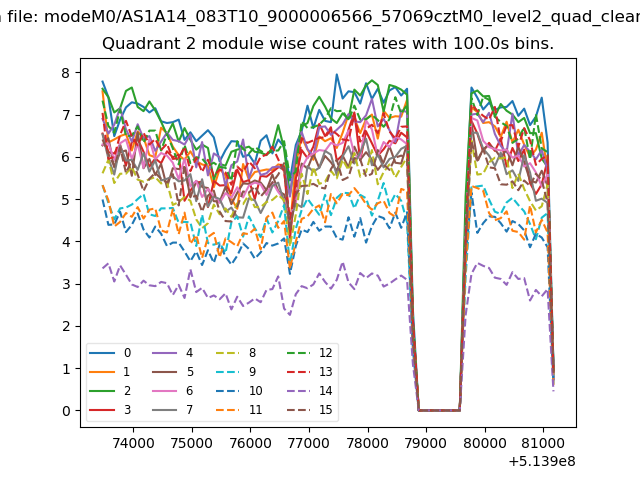
| Quadrant-wise count rates Data is divided into 100 sec bins |
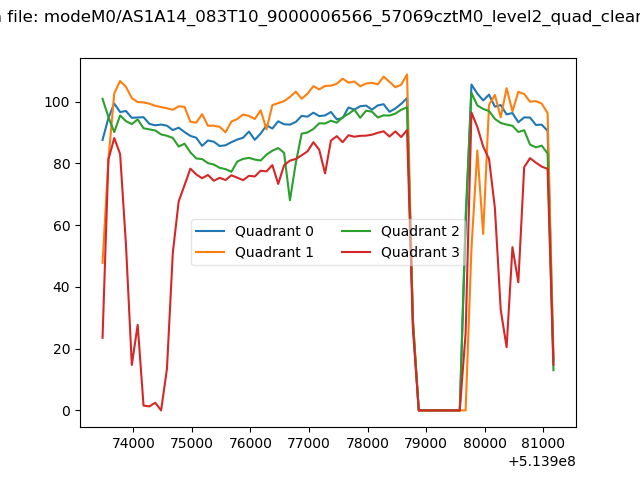 |
|
| Module-wise count rates for Quadrant A Data is divided into 100 sec bins |
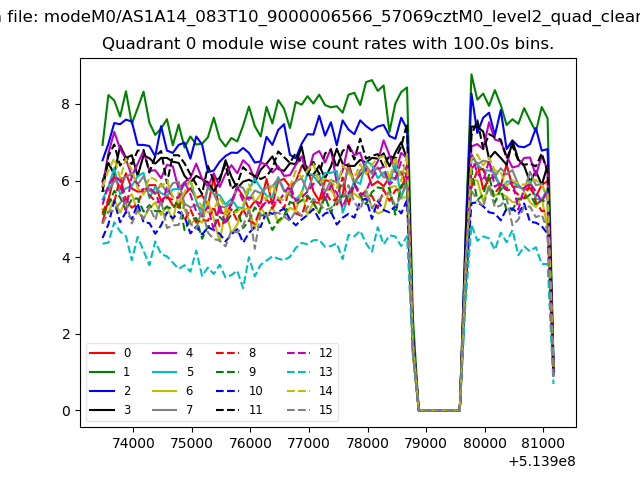 |
 |
| Module-wise count rates for Quadrant B Data is divided into 100 sec bins |
 |
 |
| Module-wise count rates for Quadrant C Data is divided into 100 sec bins |
 |
 |
| Module-wise count rates for Quadrant D Data is divided into 100 sec bins |
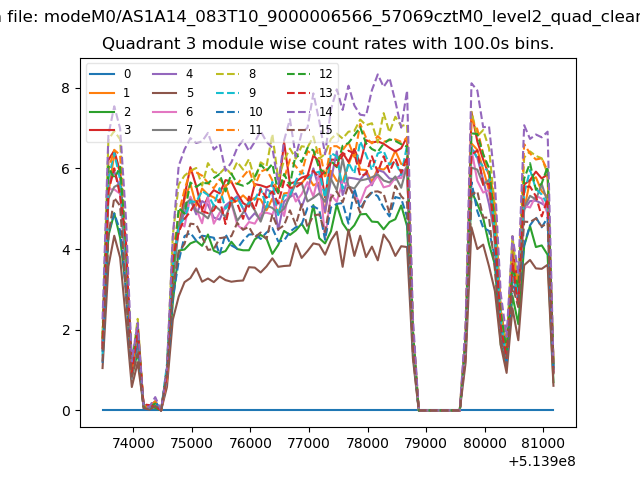 |
 |
| Parameter | Plot |
|---|---|
| CZT HV Monitor | 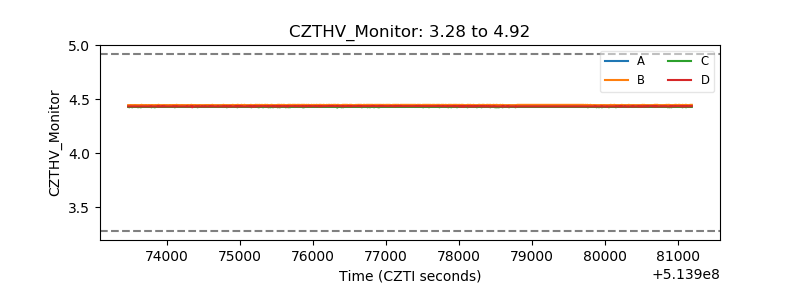 |
| D_VDD | 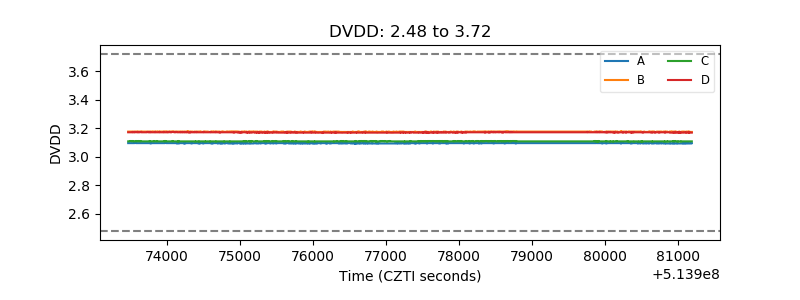 |
| Temperature 1 | 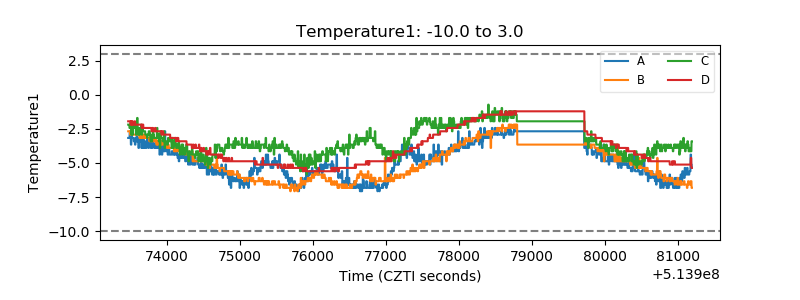 |
| Veto HV Monitor | 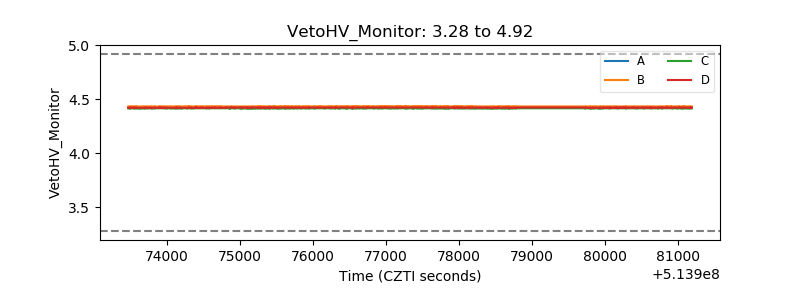 |
| Veto LLD | 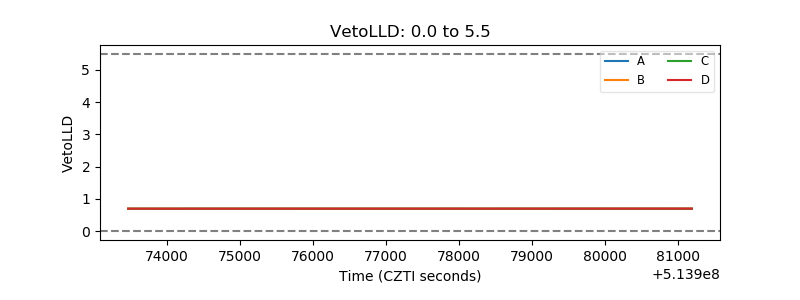 |
| Alpha Counter | 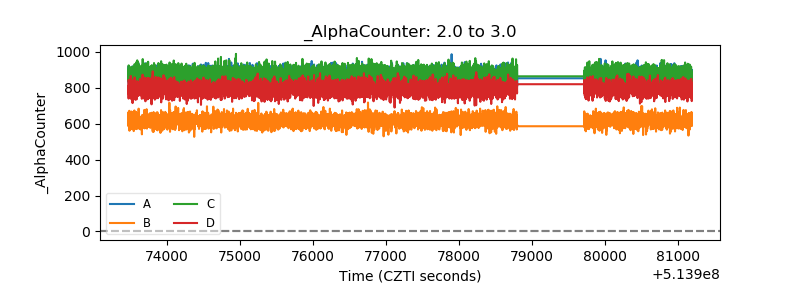 |
| _CPM_Rate | 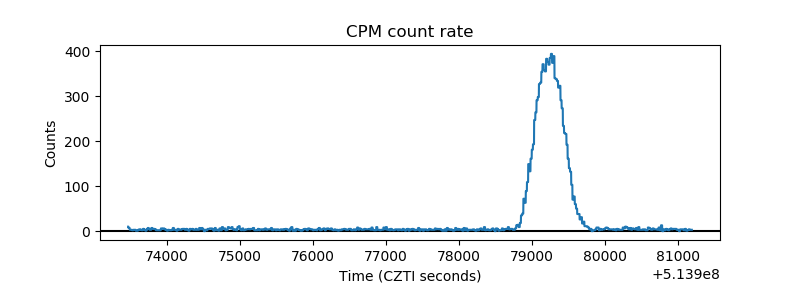 |
| CZT Counter | 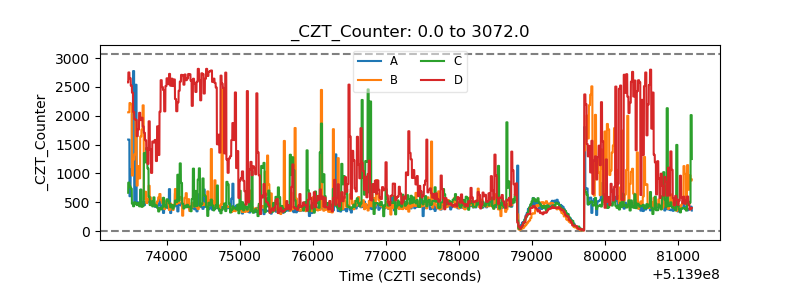 |
| +2.5 Volts monitor | 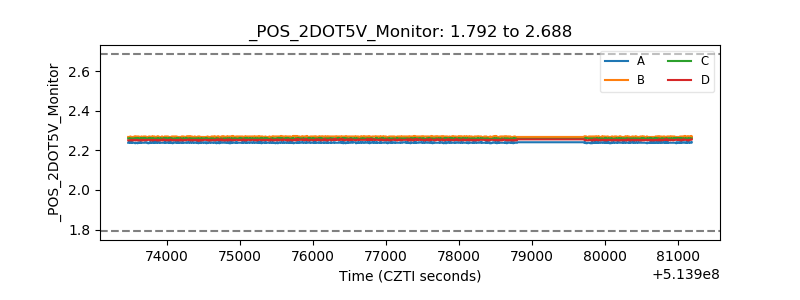 |
| +5 Volts monitor | 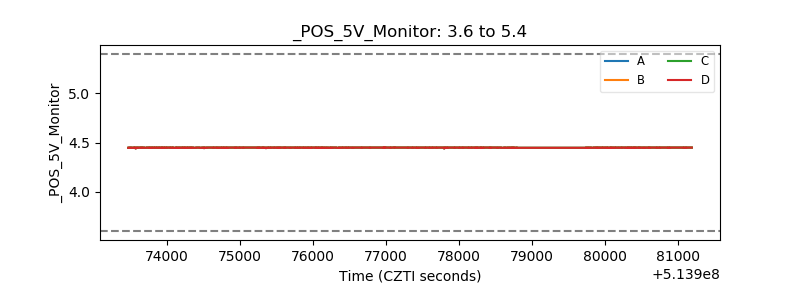 |
| _ROLL_ROT | 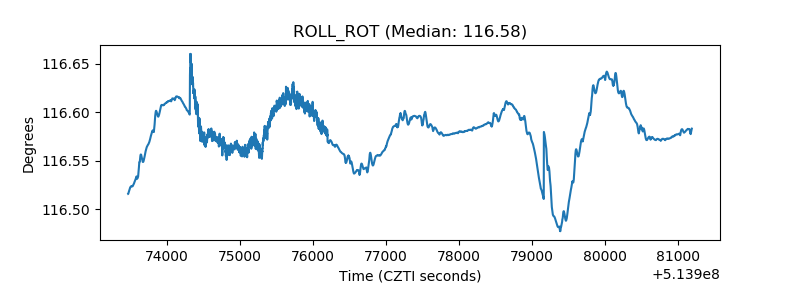 |
| _Roll_DEC | 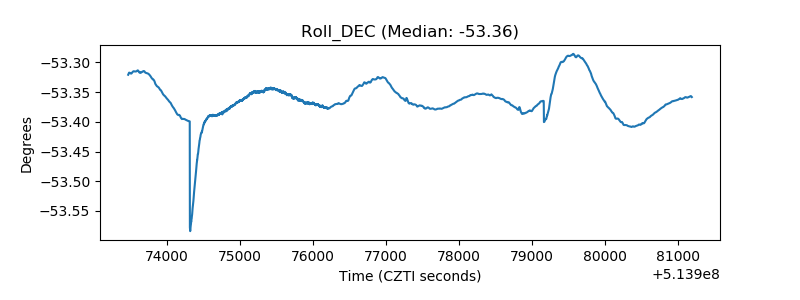 |
| _Roll_RA | 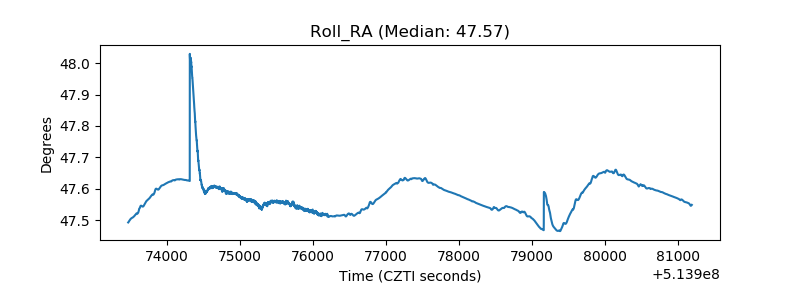 |
| Veto Counter | 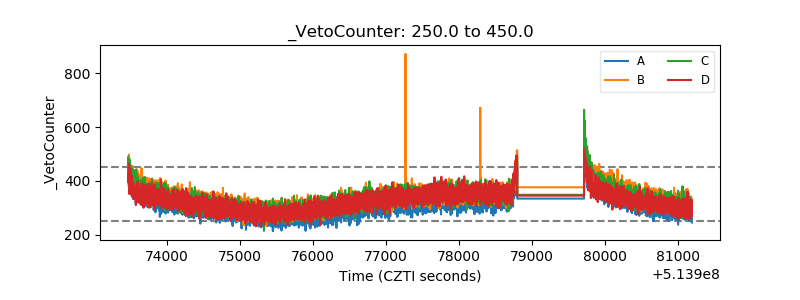 |