| Param | Original file | Final file |
|---|---|---|
| Filename | modeM0/AS1A14_083T10_9000006566_57071cztM0_level2.fits | modeM0/AS1A14_083T10_9000006566_57071cztM0_level2_quad_clean.evt |
| Size (bytes) | 542,010,240 | 92,136,960 |
| Size | 516.9 MB | 87.9 MB |
| Events in quadrant A | 3,354,155 | 629,280 |
| Events in quadrant B | 4,295,322 | 644,143 |
| Events in quadrant C | 5,467,982 | 555,215 |
| Events in quadrant D | 6,432,697 | 500,388 |
| Mode M9 | |||
|---|---|---|---|
| Quadrant | BADHDUFLAG | Total packets | Discarded packets |
| A | 0 | 13 | 0 |
| B | 0 | 14 | 0 |
| C | 0 | 14 | 0 |
| D | 0 | 14 | 0 |
| Mode M0 | |||
|---|---|---|---|
| Quadrant | BADHDUFLAG | Total packets | Discarded packets |
| A | 0 | 14775 | 2 |
| B | 0 | 17518 | 2 |
| C | 0 | 20758 | 5 |
| D | 0 | 23777 | 2 |
| Mode SS | |||
|---|---|---|---|
| Quadrant | BADHDUFLAG | Total packets | Discarded packets |
| A | 0 | 134 | 0 |
| B | 0 | 134 | 0 |
| C | 0 | 134 | 0 |
| D | 0 | 134 | 0 |
| Quadrant | Total seconds | Saturated seconds | Saturation percentage |
|---|---|---|---|
| A | 6608 | 159 | 2.406174% |
| B | 6608 | 501 | 7.581719% |
| C | 6607 | 693 | 10.488875% |
| D | 6607 | 888 | 13.440291% |
Noise dominated data is calculated using 1-second bins in cleaned event files. If a bin has >2000 counts, and if more than 50% of those come from <1% of pixels, then it is considered to be noise-dominated and hence unusable.
| Quadrant | # 1 sec bins | Bins with >0 counts | Bins with >2000 counts | High rate bins dominated by noise | Noise dominated (total time) | Noise dominated (detector-on time) | Marked lightcurve |
|---|---|---|---|---|---|---|---|
| A | 7658 | 6608 | 136 | 136 | 1.78% | 2.06% | 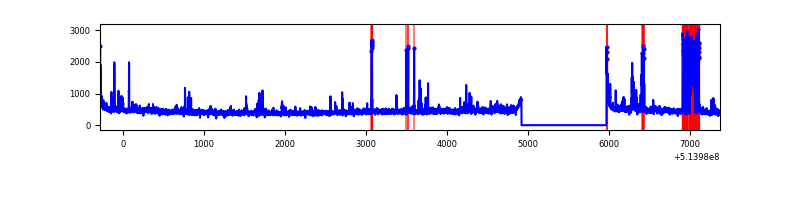 |
| B | 7658 | 6608 | 266 | 266 | 3.47% | 4.03% | 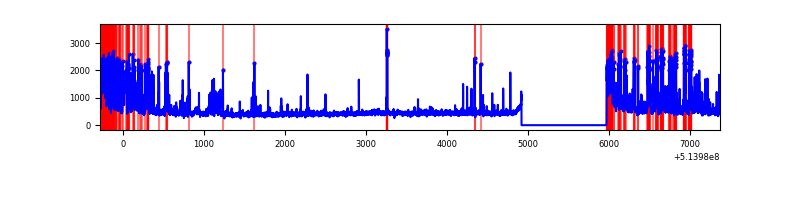 |
| C | 7657 | 6607 | 627 | 627 | 8.19% | 9.49% | 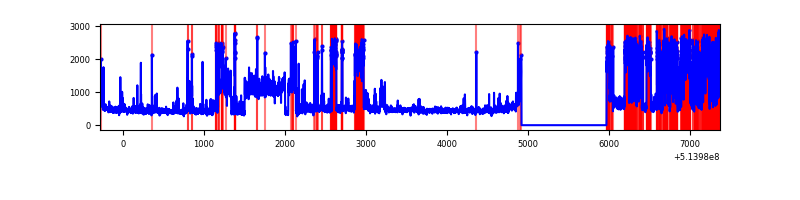 |
| D | 7657 | 6608 | 965 | 965 | 12.60% | 14.60% | 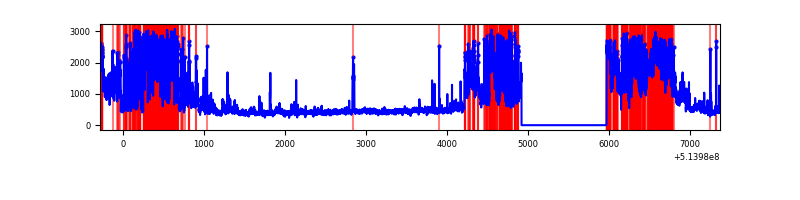 |
Top three noisy pixels from each quadrant. If the there are fewer than three noisy pixels in the level2.evt file, extra rows are filled as -1
| Pixel properties | Quadrant properties | ||||||
|---|---|---|---|---|---|---|---|
| Quadrant | DetID | PixID | Counts | Sigma | Mean | Median | Sigma |
| A | 7 | 64 | 378942 | 2162.47 | 708 | 690 | 174.9 |
| A | 3 | 14 | 88841 | 503.96 | 708 | 690 | 174.9 |
| A | 10 | 251 | 65858 | 372.57 | 708 | 690 | 174.9 |
| B | 10 | 16 | 904399 | 6272.03 | 676 | 652 | 144.1 |
| B | 4 | 171 | 421220 | 2918.75 | 676 | 652 | 144.1 |
| B | 0 | 63 | 63796 | 438.22 | 676 | 652 | 144.1 |
| C | 1 | 16 | 1455662 | 7981.73 | 663 | 658 | 182.3 |
| C | 12 | 254 | 1059556 | 5808.81 | 663 | 658 | 182.3 |
| C | 14 | 245 | 96806 | 527.44 | 663 | 658 | 182.3 |
| D | 12 | 33 | 2173461 | 11732.65 | 641 | 611 | 185.2 |
| D | 15 | 142 | 1534493 | 8282.44 | 641 | 611 | 185.2 |
| D | 8 | 48 | 59526 | 318.12 | 641 | 611 | 185.2 |
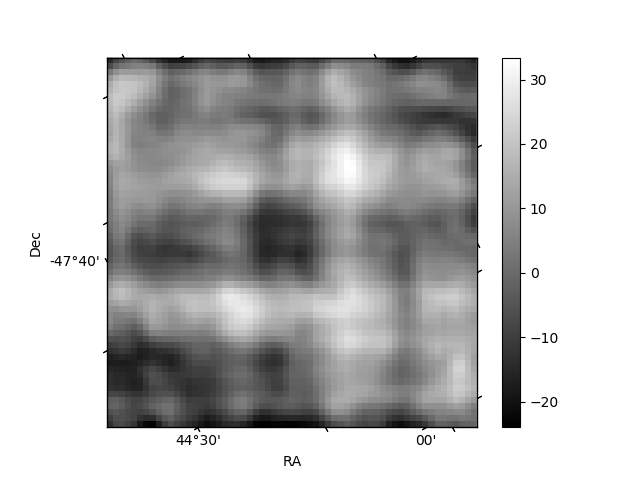
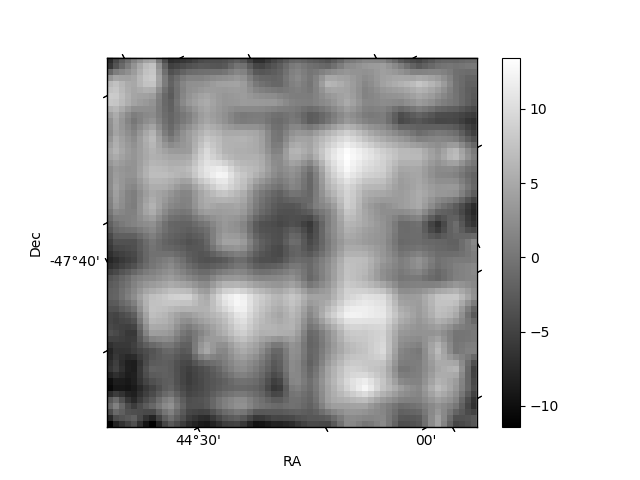
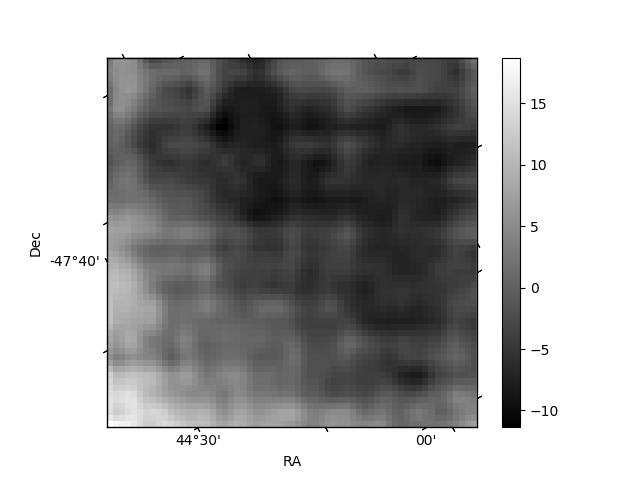
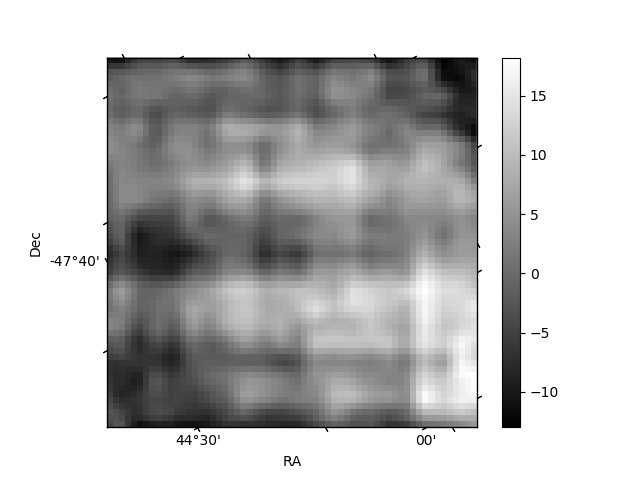
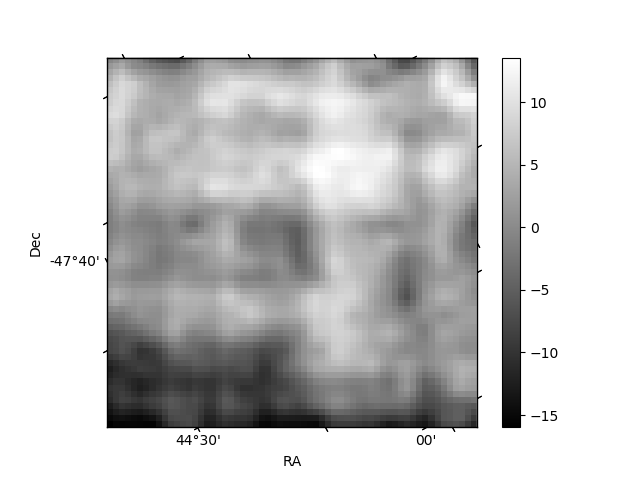
Histogram calculated using DETX and DETY for each event in the final _common_clean file
| Quadrant A | 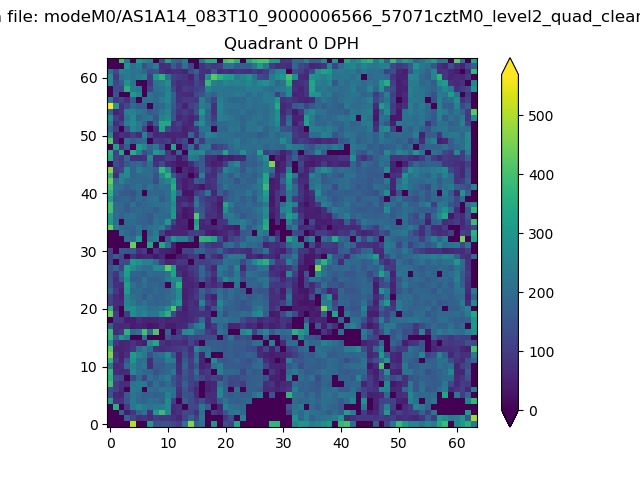 |
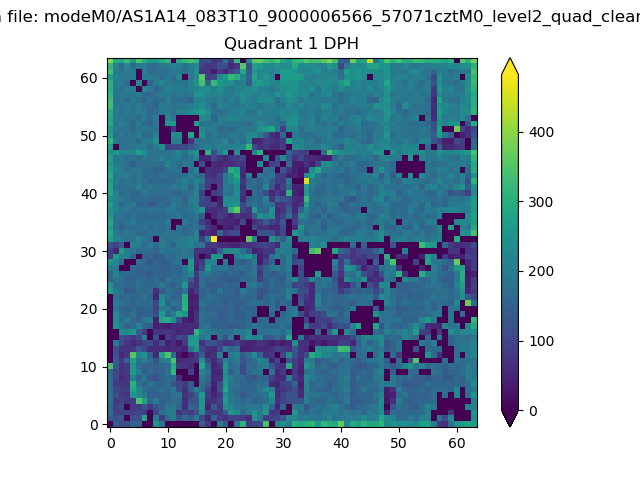 |
Quadrant B |
|---|---|---|---|
| Quadrant D | 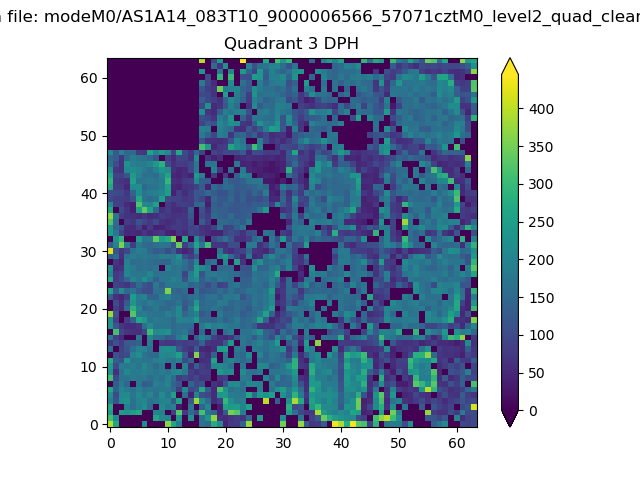 |
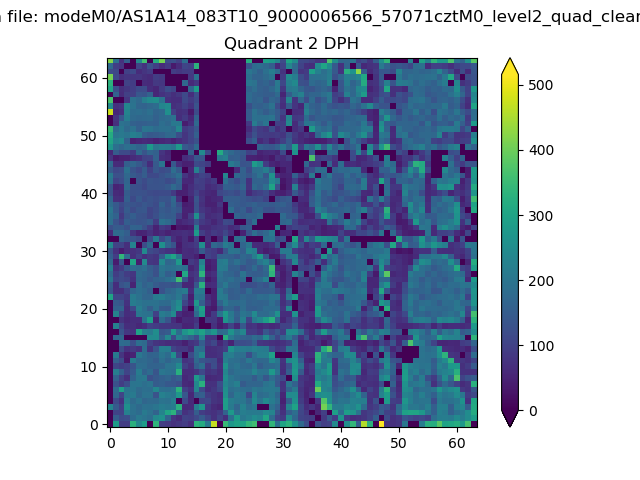 |
Quadrant C |
| Plot type | Count rate plots | Images |
|---|---|---|
| Comparison with Poisson distribution Blue bars denote a histogram of data divided into 1 sec bins. Red curve is a Poisson curve with rate = median count rate of data. |
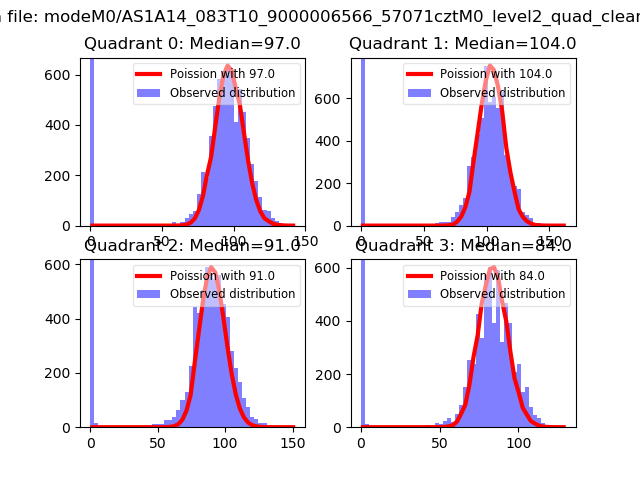 |
 |
| Quadrant-wise count rates Data is divided into 100 sec bins |
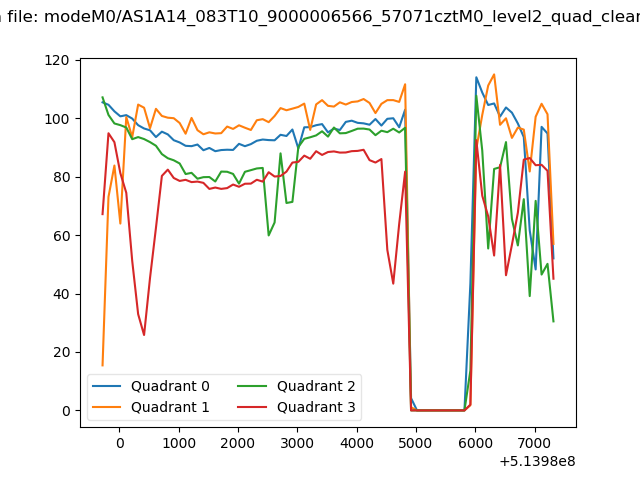 |
|
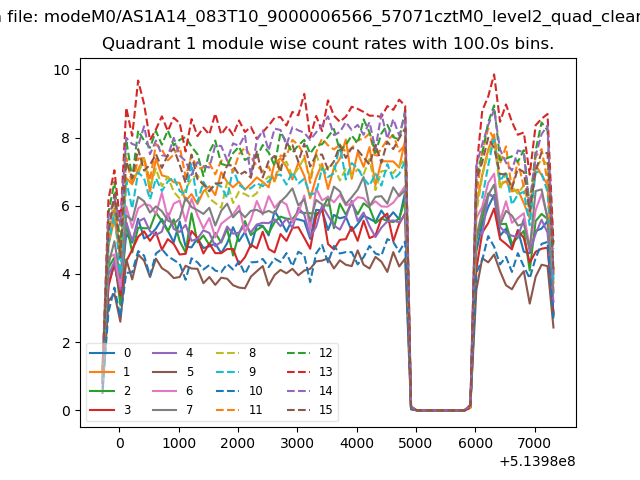
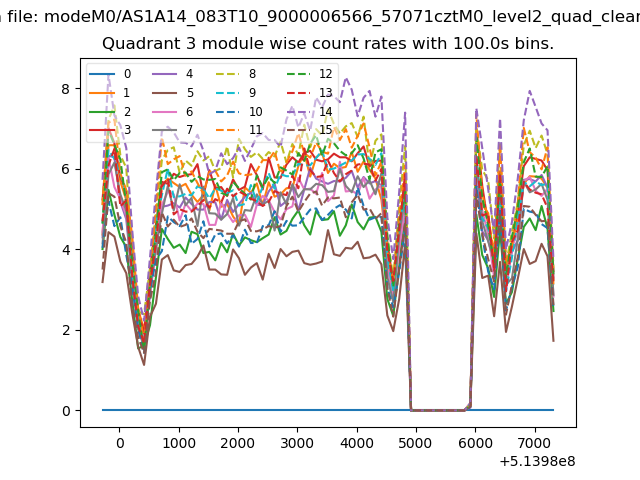
| Module-wise count rates for Quadrant A Data is divided into 100 sec bins |
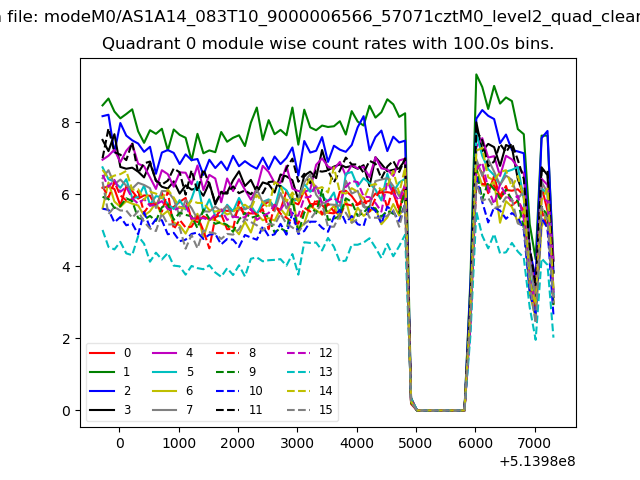 |
 |
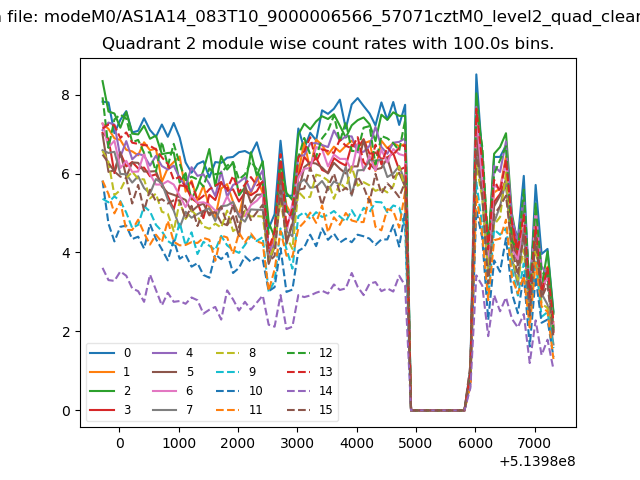
| Module-wise count rates for Quadrant B Data is divided into 100 sec bins |
 |
 |
| Module-wise count rates for Quadrant C Data is divided into 100 sec bins |
 |
 |
| Module-wise count rates for Quadrant D Data is divided into 100 sec bins |
 |
 |
| Parameter | Plot |
|---|---|
| CZT HV Monitor | 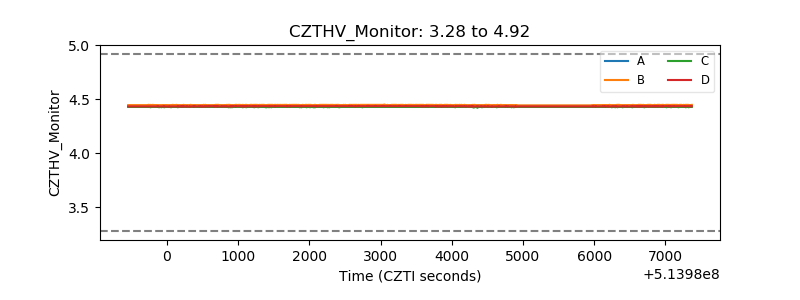 |
| D_VDD | 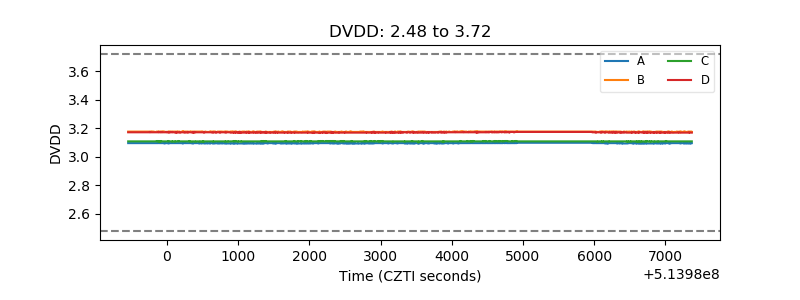 |
| Temperature 1 | 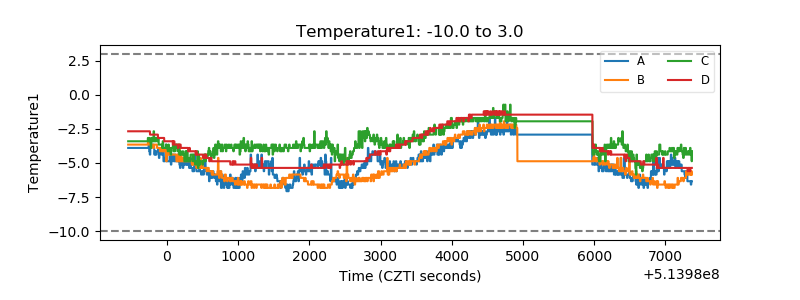 |
| Veto HV Monitor | 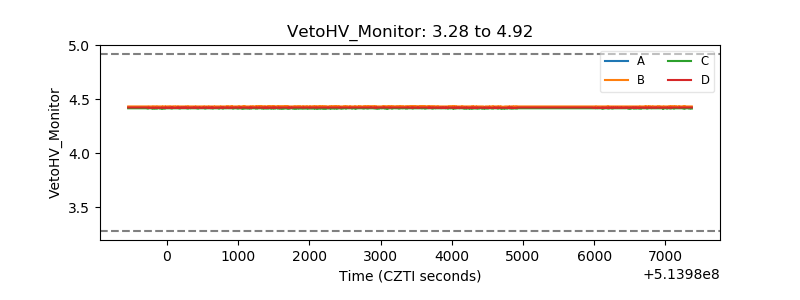 |
| Veto LLD | 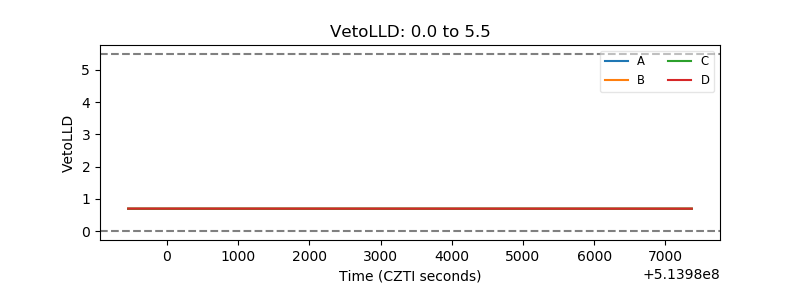 |
| Alpha Counter | 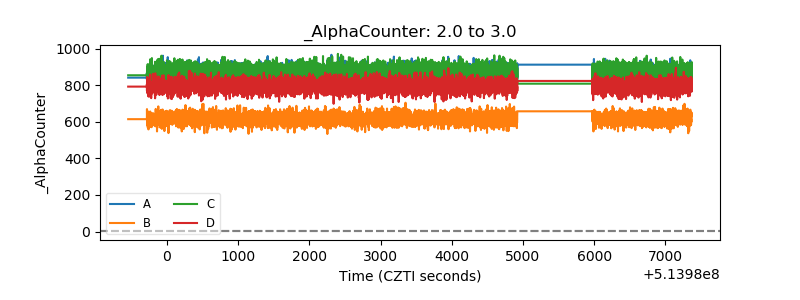 |
| _CPM_Rate | 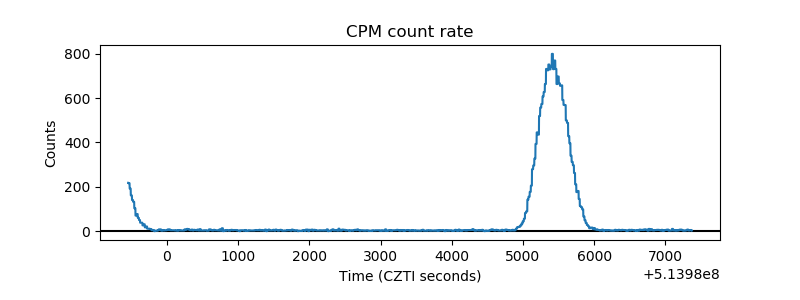 |
| CZT Counter | 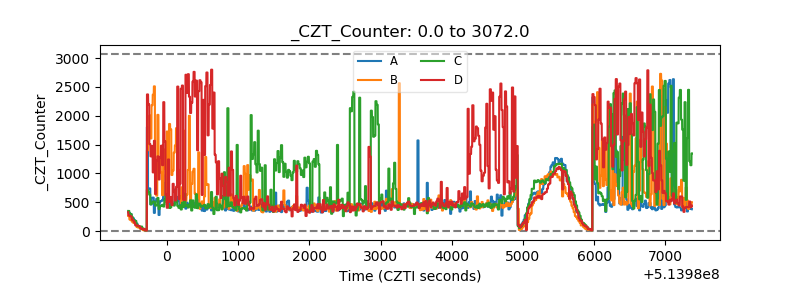 |
| +2.5 Volts monitor |  |
| +5 Volts monitor |  |
| _ROLL_ROT | 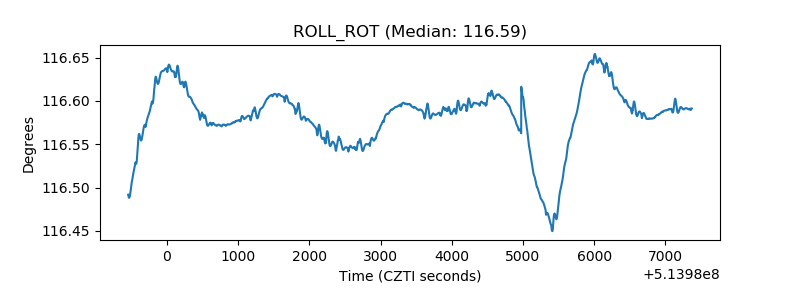 |
| _Roll_DEC | 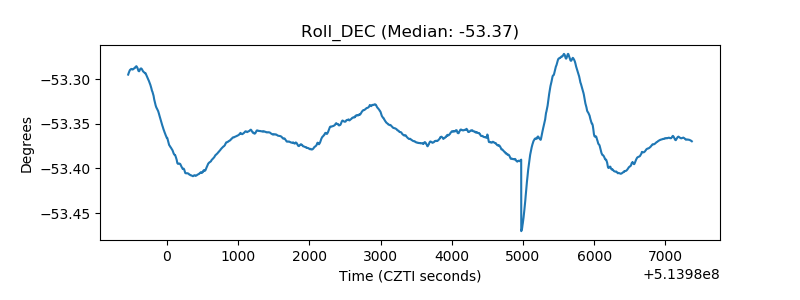 |
| _Roll_RA | 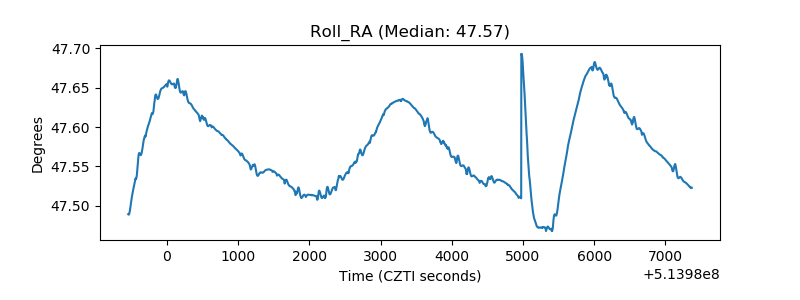 |
| Veto Counter | 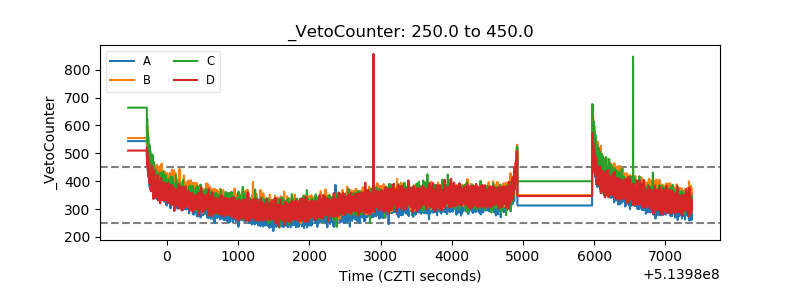 |