| Param | Original file | Final file |
|---|---|---|
| Filename | modeM0/AS1A14_083T10_9000006566_57073cztM0_level2.fits | modeM0/AS1A14_083T10_9000006566_57073cztM0_level2_quad_clean.evt |
| Size (bytes) | 998,179,200 | 162,512,640 |
| Size | 951.9 MB | 155.0 MB |
| Events in quadrant A | 5,644,812 | 1,140,942 |
| Events in quadrant B | 6,870,174 | 1,168,479 |
| Events in quadrant C | 11,982,646 | 919,606 |
| Events in quadrant D | 11,559,308 | 893,888 |
| Mode M9 | |||
|---|---|---|---|
| Quadrant | BADHDUFLAG | Total packets | Discarded packets |
| A | 0 | 27 | 0 |
| B | 0 | 28 | 0 |
| C | 0 | 28 | 0 |
| D | 0 | 28 | 0 |
| Mode M0 | |||
|---|---|---|---|
| Quadrant | BADHDUFLAG | Total packets | Discarded packets |
| A | 0 | 25047 | 3 |
| B | 0 | 28373 | 3 |
| C | 0 | 43536 | 3 |
| D | 0 | 42166 | 3 |
| Mode SS | |||
|---|---|---|---|
| Quadrant | BADHDUFLAG | Total packets | Discarded packets |
| A | 0 | 234 | 0 |
| B | 0 | 234 | 0 |
| C | 0 | 234 | 0 |
| D | 0 | 234 | 0 |
| Quadrant | Total seconds | Saturated seconds | Saturation percentage |
|---|---|---|---|
| A | 11532 | 184 | 1.595560% |
| B | 11531 | 657 | 5.697685% |
| C | 11531 | 2149 | 18.636718% |
| D | 11531 | 1542 | 13.372648% |
Noise dominated data is calculated using 1-second bins in cleaned event files. If a bin has >2000 counts, and if more than 50% of those come from <1% of pixels, then it is considered to be noise-dominated and hence unusable.
| Quadrant | # 1 sec bins | Bins with >0 counts | Bins with >2000 counts | High rate bins dominated by noise | Noise dominated (total time) | Noise dominated (detector-on time) | Marked lightcurve |
|---|---|---|---|---|---|---|---|
| A | 13862 | 11533 | 131 | 131 | 0.95% | 1.14% | 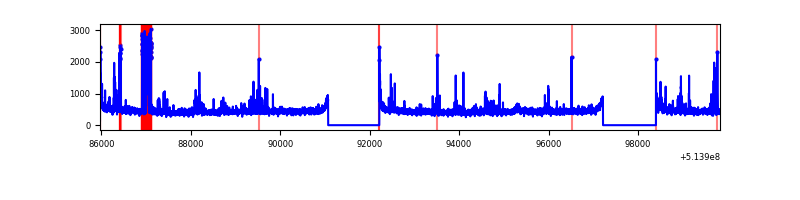 |
| B | 13861 | 11532 | 376 | 376 | 2.71% | 3.26% | 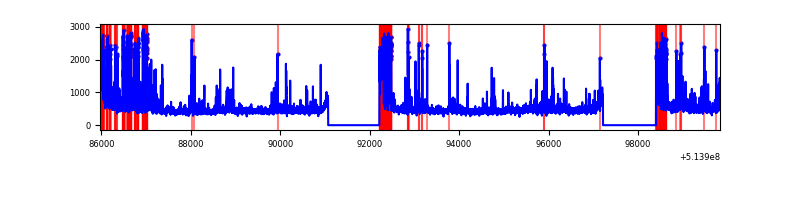 |
| C | 13861 | 11532 | 1894 | 1894 | 13.66% | 16.42% | 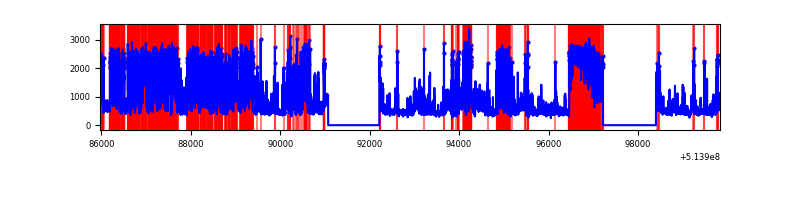 |
| D | 13861 | 11531 | 1638 | 1638 | 11.82% | 14.21% | 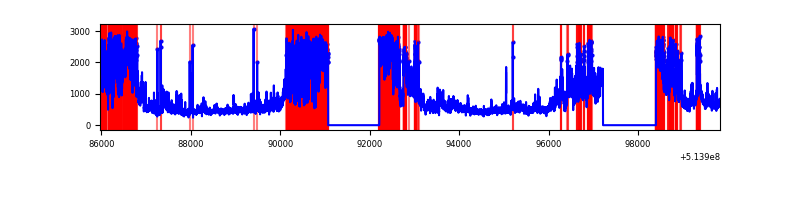 |
Top three noisy pixels from each quadrant. If the there are fewer than three noisy pixels in the level2.evt file, extra rows are filled as -1
| Pixel properties | Quadrant properties | ||||||
|---|---|---|---|---|---|---|---|
| Quadrant | DetID | PixID | Counts | Sigma | Mean | Median | Sigma |
| A | 7 | 64 | 378963 | 1205.14 | 1270 | 1237 | 313.4 |
| A | 4 | 13 | 110754 | 349.42 | 1270 | 1237 | 313.4 |
| A | 3 | 14 | 97409 | 306.84 | 1270 | 1237 | 313.4 |
| B | 10 | 16 | 1415271 | 5527.12 | 1215 | 1171 | 255.8 |
| B | 0 | 63 | 135586 | 525.37 | 1215 | 1171 | 255.8 |
| B | 10 | 32 | 103163 | 398.64 | 1215 | 1171 | 255.8 |
| C | 12 | 254 | 2911656 | 9308.74 | 1151 | 1140 | 312.7 |
| C | 1 | 16 | 1768999 | 5654.16 | 1151 | 1140 | 312.7 |
| C | 15 | 198 | 1653594 | 5285.06 | 1151 | 1140 | 312.7 |
| D | 12 | 33 | 3294984 | 10104.94 | 1147 | 1091 | 326.0 |
| D | 15 | 142 | 3217919 | 9868.52 | 1147 | 1091 | 326.0 |
| D | 7 | 96 | 102310 | 310.52 | 1147 | 1091 | 326.0 |
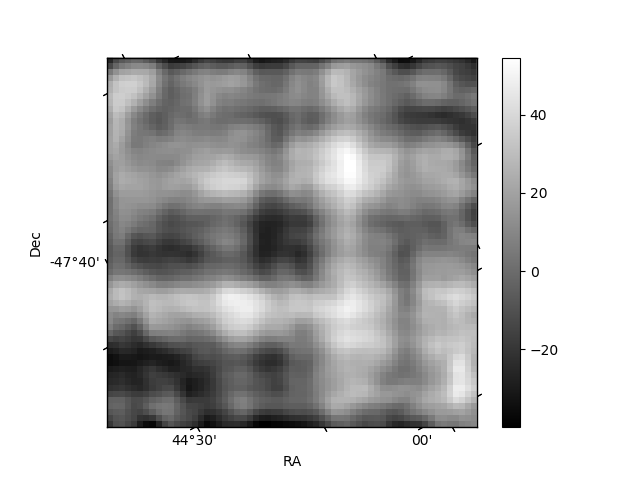
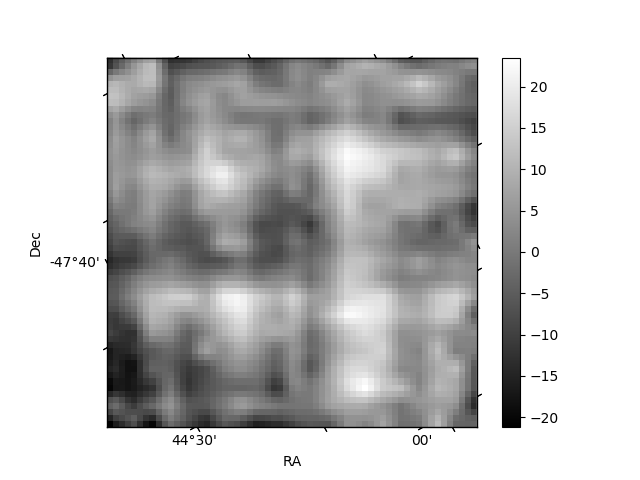
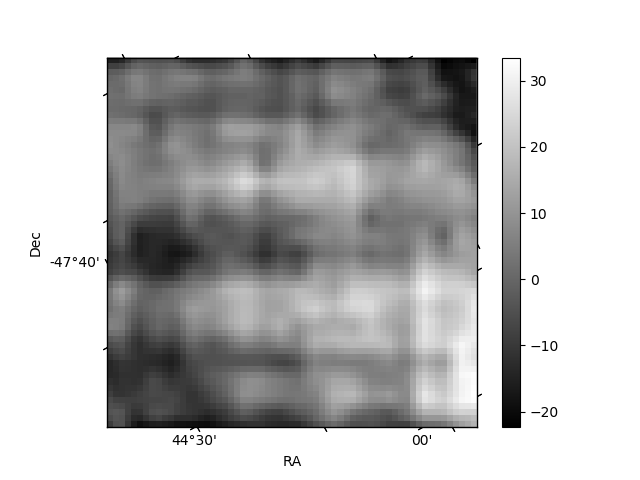
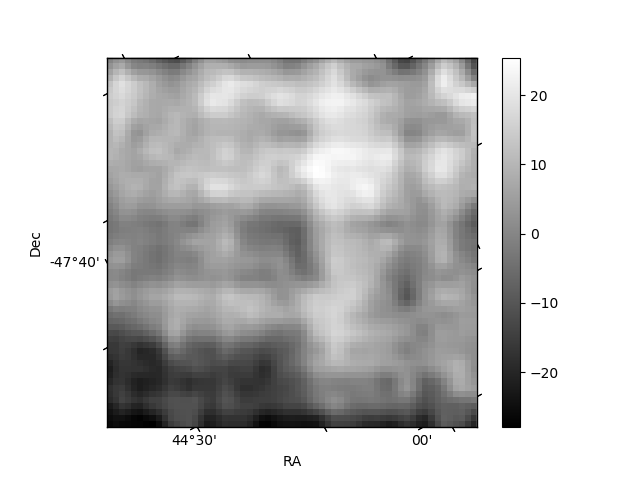
Histogram calculated using DETX and DETY for each event in the final _common_clean file
| Quadrant A | 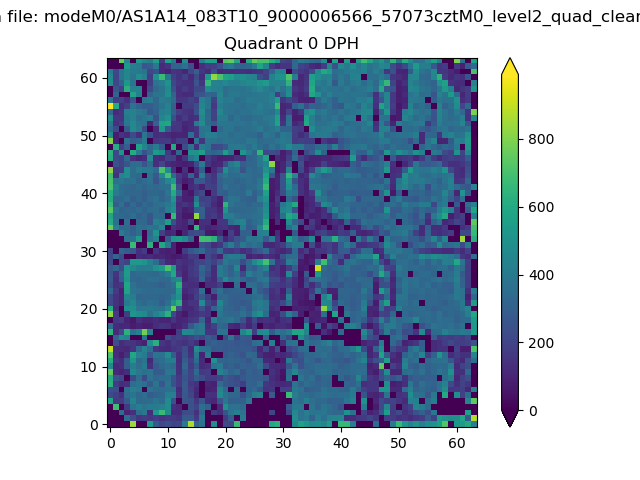 |
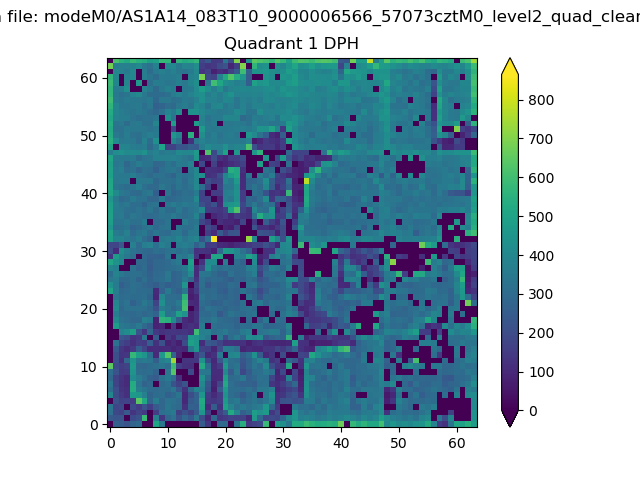 |
Quadrant B |
|---|---|---|---|
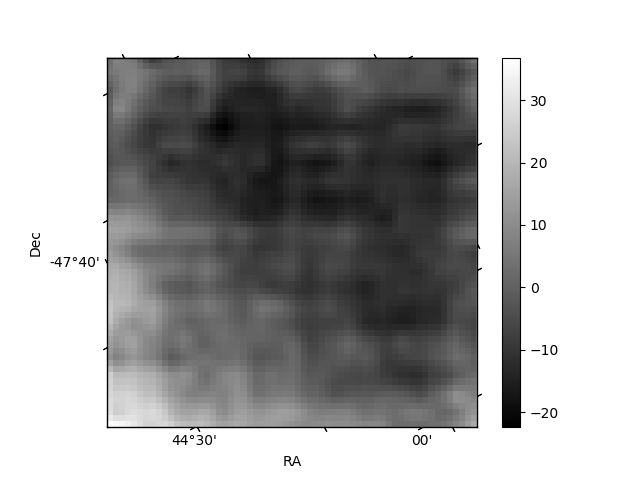
| Quadrant D | 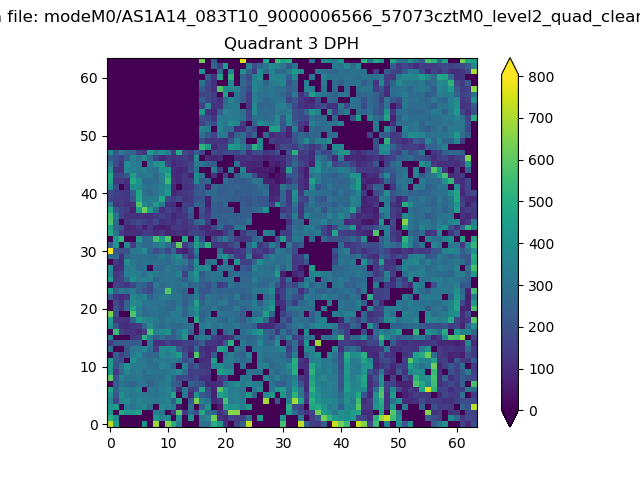 |
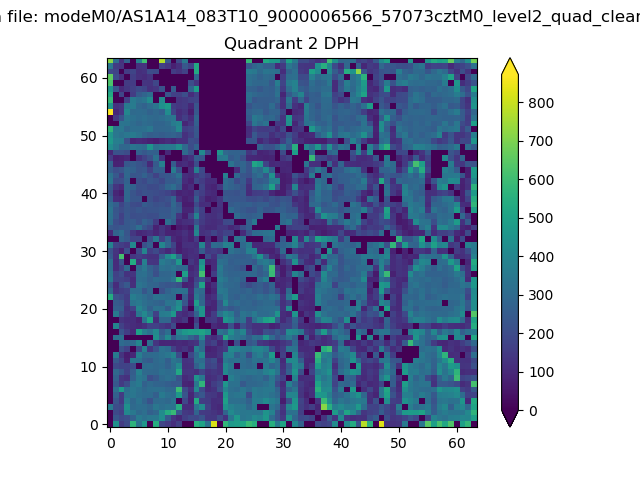 |
Quadrant C |
| Plot type | Count rate plots | Images |
|---|---|---|
| Comparison with Poisson distribution Blue bars denote a histogram of data divided into 1 sec bins. Red curve is a Poisson curve with rate = median count rate of data. |
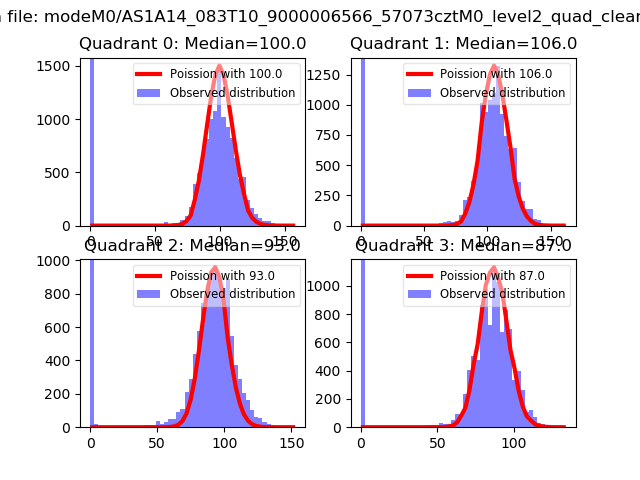 |
 |
| Quadrant-wise count rates Data is divided into 100 sec bins |
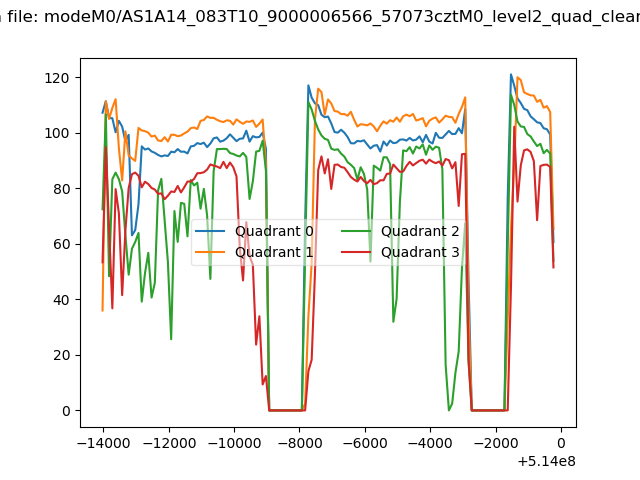 |
|
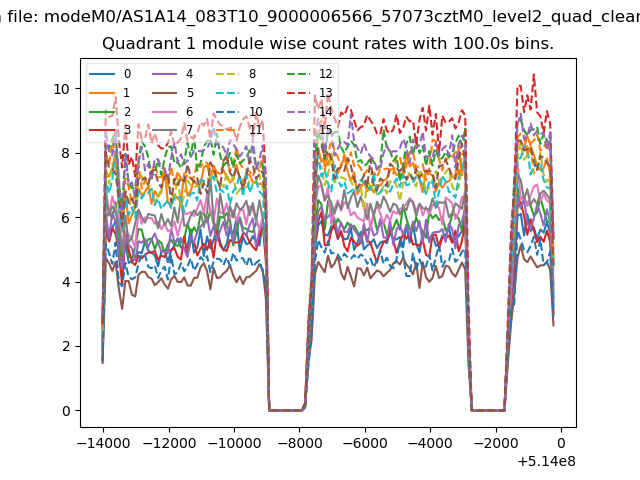
| Module-wise count rates for Quadrant A Data is divided into 100 sec bins |
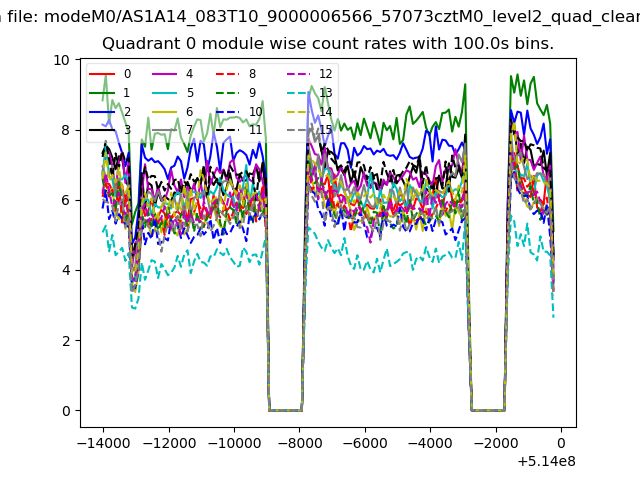 |
 |
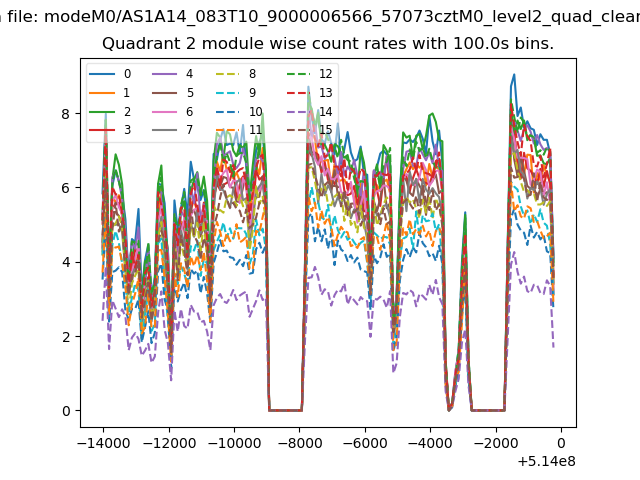
| Module-wise count rates for Quadrant B Data is divided into 100 sec bins |
 |
 |
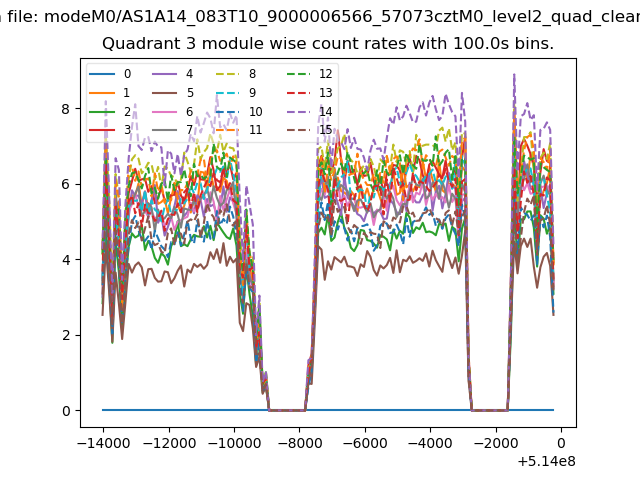
| Module-wise count rates for Quadrant C Data is divided into 100 sec bins |
 |
 |
| Module-wise count rates for Quadrant D Data is divided into 100 sec bins |
 |
 |
| Parameter | Plot |
|---|---|
| CZT HV Monitor | 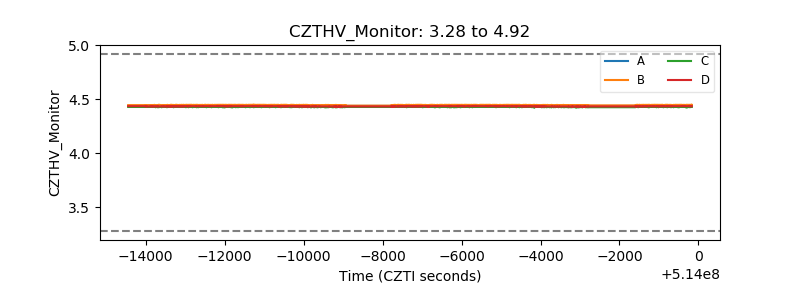 |
| D_VDD | 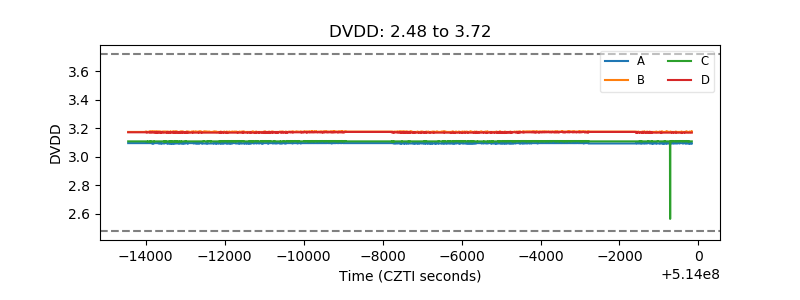 |
| Temperature 1 | 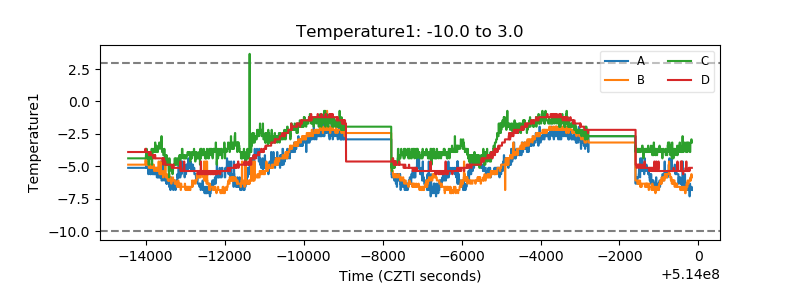 |
| Veto HV Monitor | 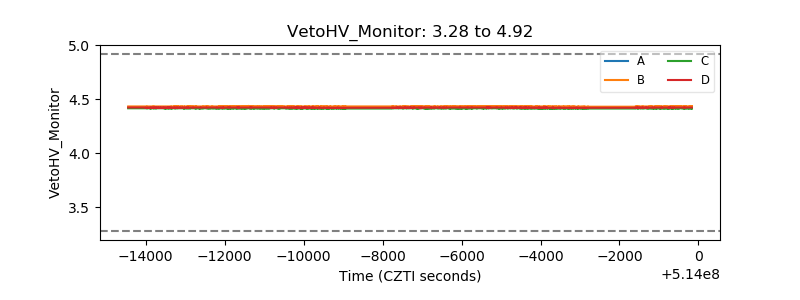 |
| Veto LLD | 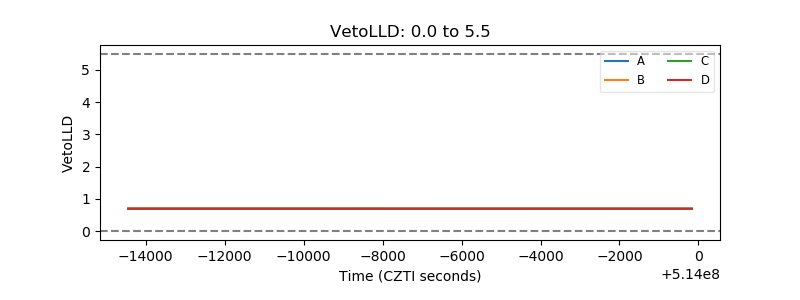 |
| Alpha Counter | 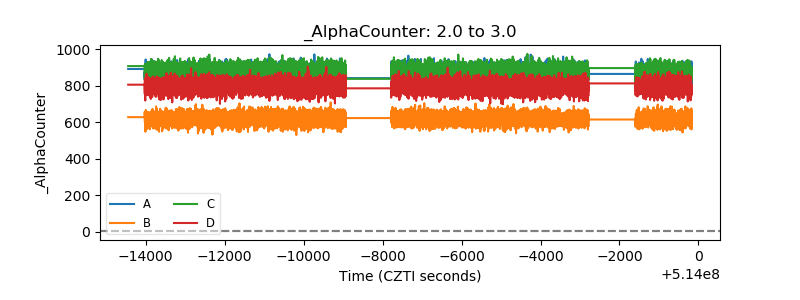 |
| _CPM_Rate | 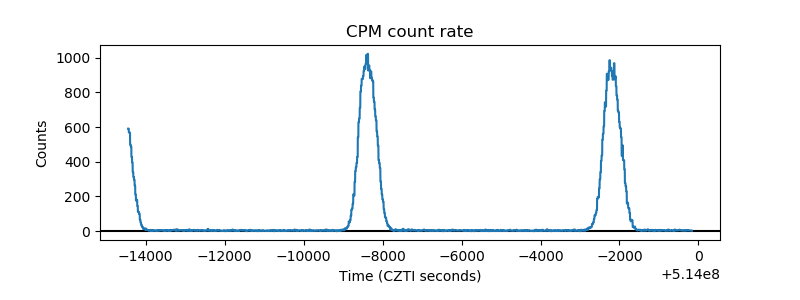 |
| CZT Counter | 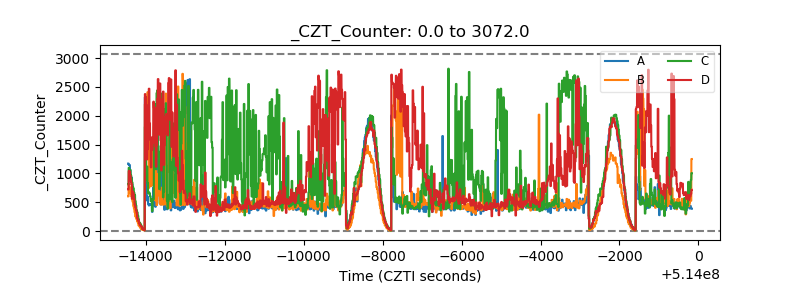 |
| +2.5 Volts monitor |  |
| +5 Volts monitor |  |
| _ROLL_ROT | 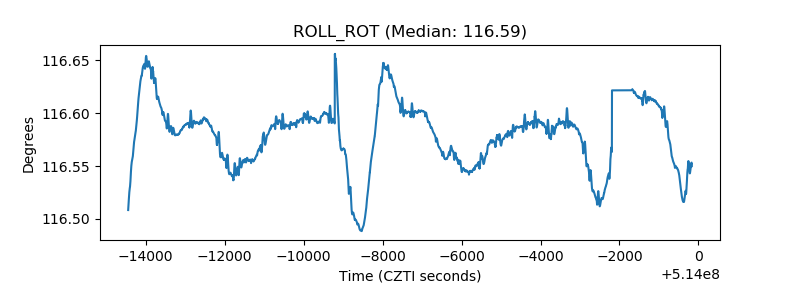 |
| _Roll_DEC | 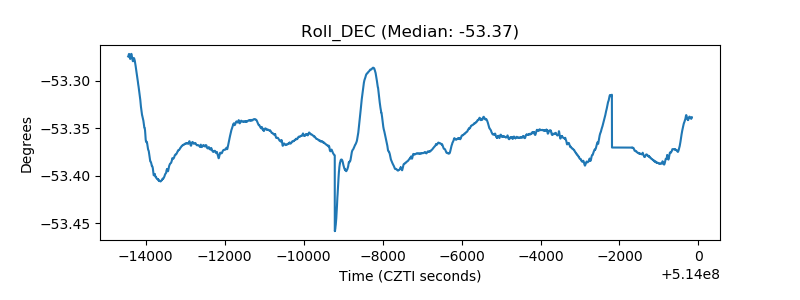 |
| _Roll_RA | 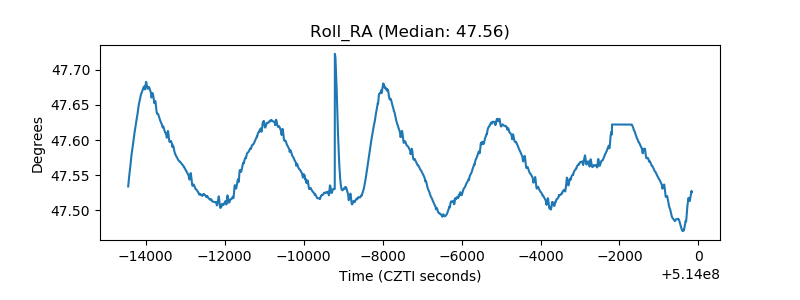 |
| Veto Counter | 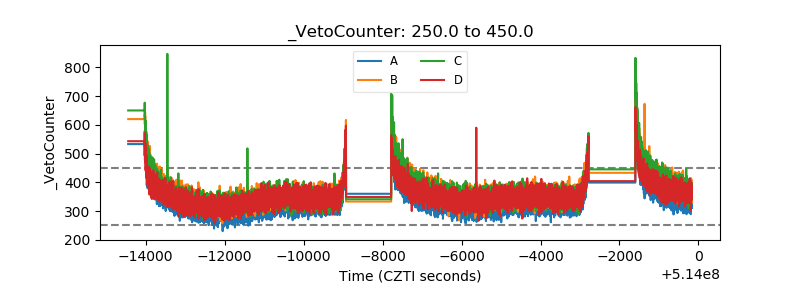 |