| Param | Original file | Final file |
|---|---|---|
| Filename | modeM0/AS1A14_083T10_9000006566_57074cztM0_level2.fits | modeM0/AS1A14_083T10_9000006566_57074cztM0_level2_quad_clean.evt |
| Size (bytes) | 289,851,840 | 50,806,080 |
| Size | 276.4 MB | 48.5 MB |
| Events in quadrant A | 1,650,836 | 348,641 |
| Events in quadrant B | 2,327,353 | 361,412 |
| Events in quadrant C | 2,849,975 | 298,041 |
| Events in quadrant D | 3,624,013 | 279,785 |
| Mode M9 | |||
|---|---|---|---|
| Quadrant | BADHDUFLAG | Total packets | Discarded packets |
| A | 0 | 12 | 0 |
| B | 0 | 12 | 0 |
| C | 0 | 12 | 0 |
| D | 0 | 13 | 1 |
| Mode M0 | |||
|---|---|---|---|
| Quadrant | BADHDUFLAG | Total packets | Discarded packets |
| A | 0 | 7573 | 158 |
| B | 0 | 9551 | 241 |
| C | 0 | 11216 | 242 |
| D | 0 | 13449 | 304 |
| Mode SS | |||
|---|---|---|---|
| Quadrant | BADHDUFLAG | Total packets | Discarded packets |
| A | 0 | 75 | 5 |
| B | 0 | 75 | 5 |
| C | 0 | 75 | 5 |
| D | 0 | 72 | 2 |
| Quadrant | Total seconds | Saturated seconds | Saturation percentage |
|---|---|---|---|
| A | 3550 | 37 | 1.042254% |
| B | 3548 | 191 | 5.383315% |
| C | 3549 | 415 | 11.693435% |
| D | 3544 | 448 | 12.641084% |
Noise dominated data is calculated using 1-second bins in cleaned event files. If a bin has >2000 counts, and if more than 50% of those come from <1% of pixels, then it is considered to be noise-dominated and hence unusable.
| Quadrant | # 1 sec bins | Bins with >0 counts | Bins with >2000 counts | High rate bins dominated by noise | Noise dominated (total time) | Noise dominated (detector-on time) | Marked lightcurve |
|---|---|---|---|---|---|---|---|
| A | 4892 | 3562 | 11 | 11 | 0.22% | 0.31% | 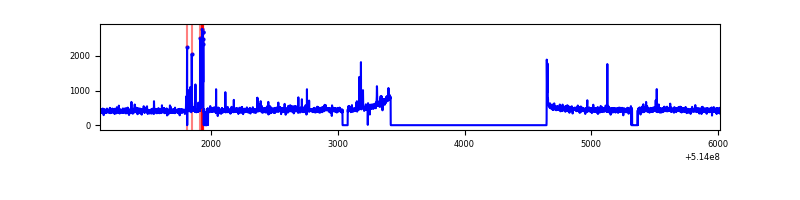 |
| B | 4892 | 3558 | 74 | 74 | 1.51% | 2.08% | 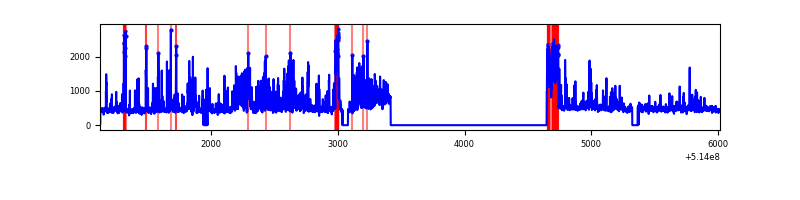 |
| C | 4892 | 3562 | 374 | 374 | 7.65% | 10.50% | 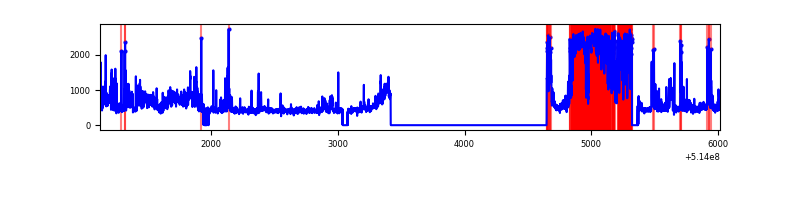 |
| D | 4892 | 3553 | 490 | 490 | 10.02% | 13.79% | 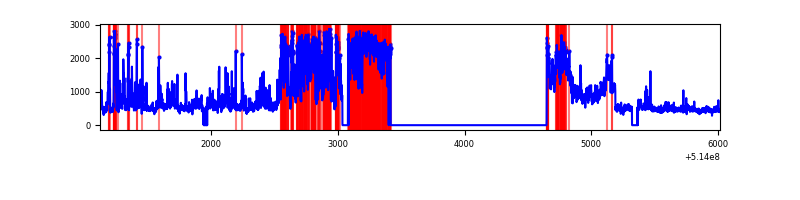 |
Top three noisy pixels from each quadrant. If the there are fewer than three noisy pixels in the level2.evt file, extra rows are filled as -1
| Pixel properties | Quadrant properties | ||||||
|---|---|---|---|---|---|---|---|
| Quadrant | DetID | PixID | Counts | Sigma | Mean | Median | Sigma |
| A | 13 | 248 | 42568 | 426.45 | 402 | 392 | 98.9 |
| A | 8 | 249 | 12964 | 127.12 | 402 | 392 | 98.9 |
| A | 10 | 251 | 9856 | 95.69 | 402 | 392 | 98.9 |
| B | 4 | 171 | 511570 | 6105.16 | 388 | 374 | 83.7 |
| B | 10 | 16 | 153867 | 1833.15 | 388 | 374 | 83.7 |
| B | 10 | 32 | 39559 | 467.98 | 388 | 374 | 83.7 |
| C | 15 | 198 | 890070 | 8698.96 | 370 | 367 | 102.3 |
| C | 1 | 16 | 226500 | 2210.99 | 370 | 367 | 102.3 |
| C | 12 | 254 | 150798 | 1470.82 | 370 | 367 | 102.3 |
| D | 12 | 33 | 1395876 | 13450.73 | 367 | 351 | 103.8 |
| D | 15 | 142 | 588424 | 5668.13 | 367 | 351 | 103.8 |
| D | 3 | 12 | 61487 | 589.26 | 367 | 351 | 103.8 |
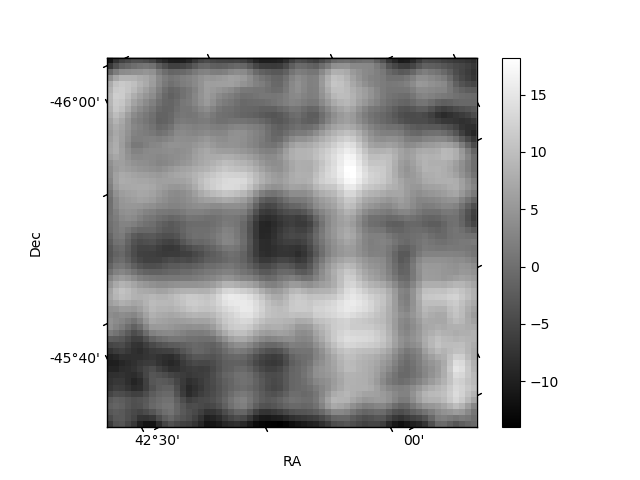
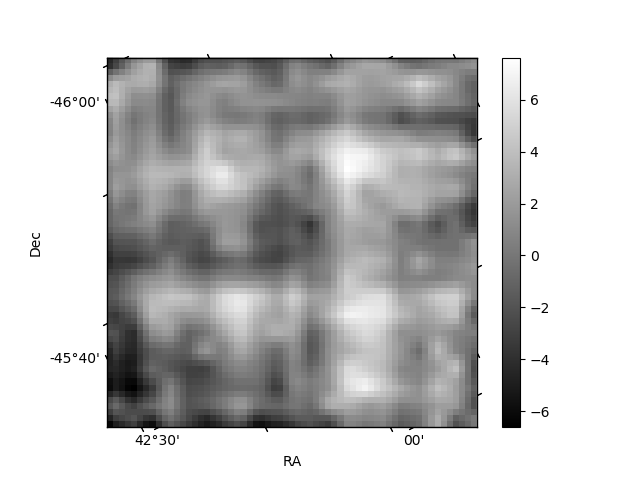
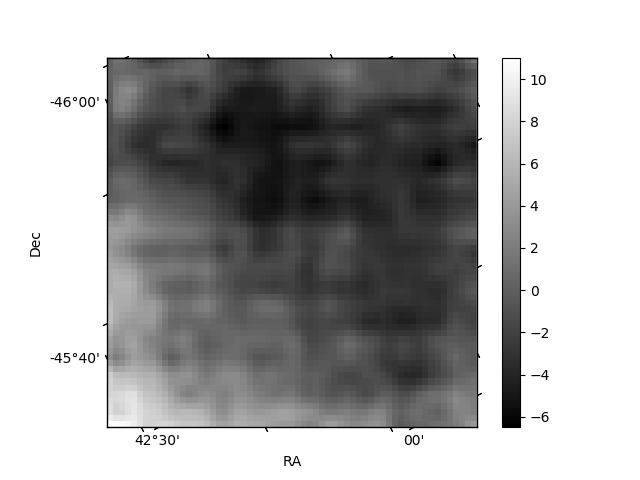
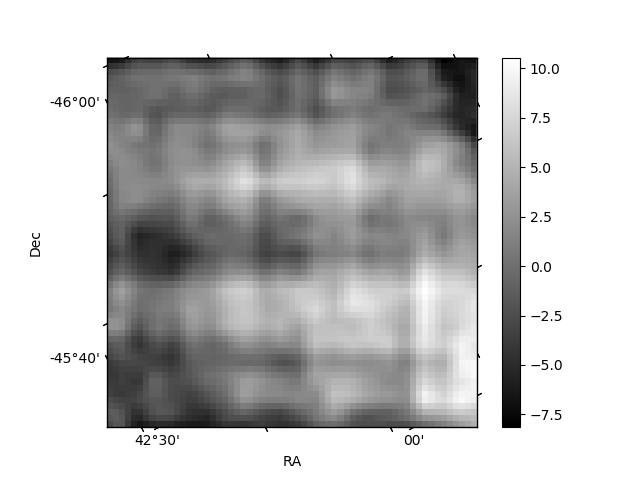
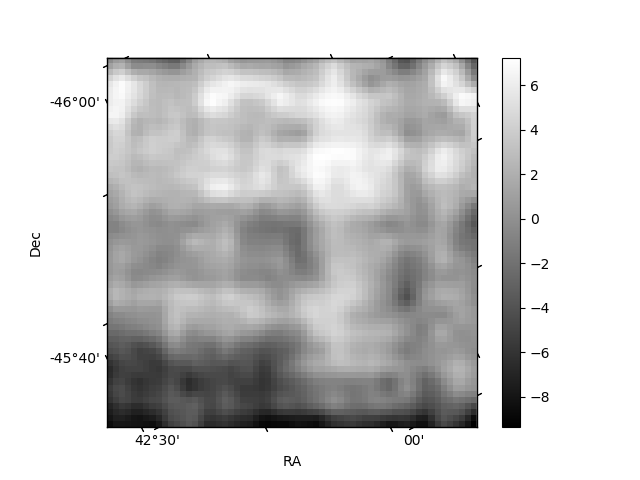
Histogram calculated using DETX and DETY for each event in the final _common_clean file
| Quadrant A | 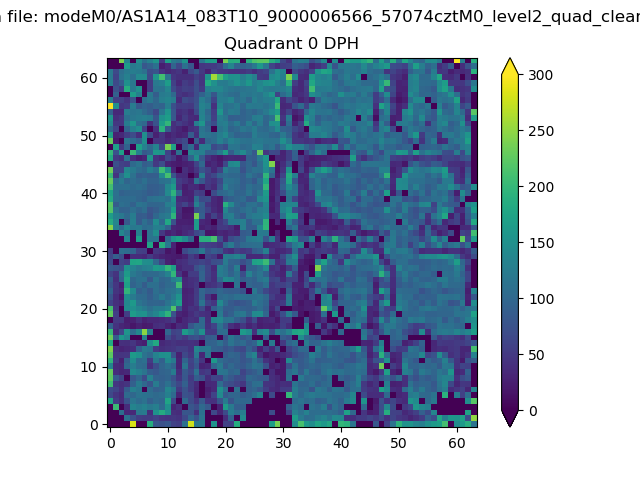 |
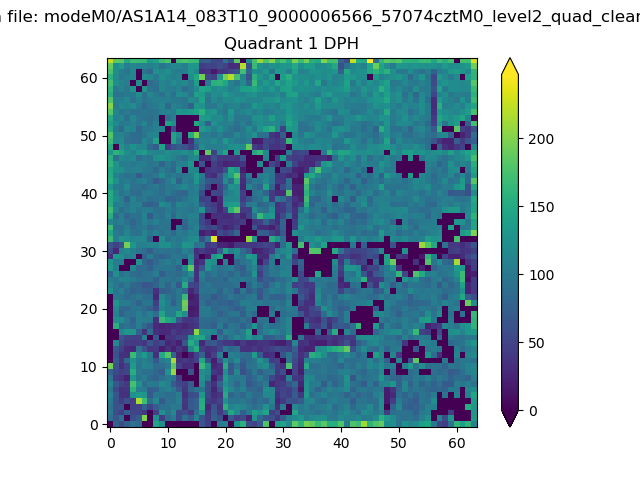 |
Quadrant B |
|---|---|---|---|
| Quadrant D | 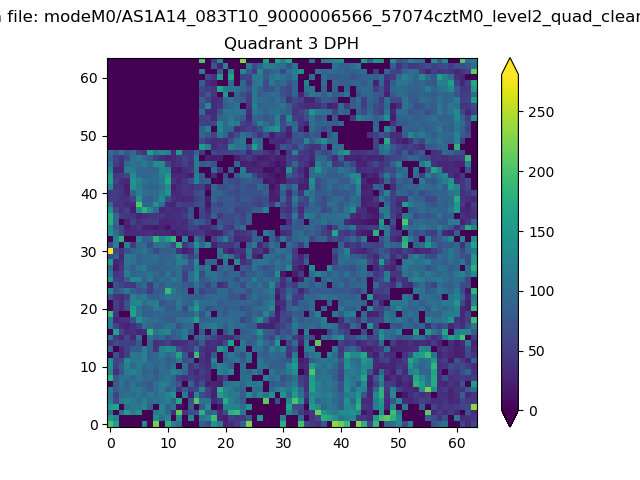 |
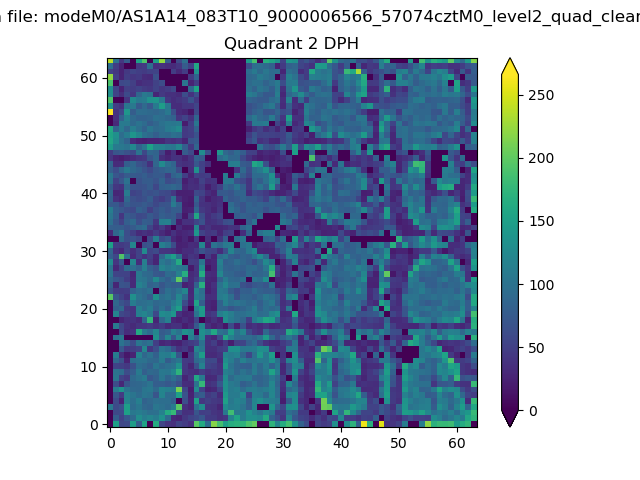 |
Quadrant C |
| Plot type | Count rate plots | Images |
|---|---|---|
| Comparison with Poisson distribution Blue bars denote a histogram of data divided into 1 sec bins. Red curve is a Poisson curve with rate = median count rate of data. |
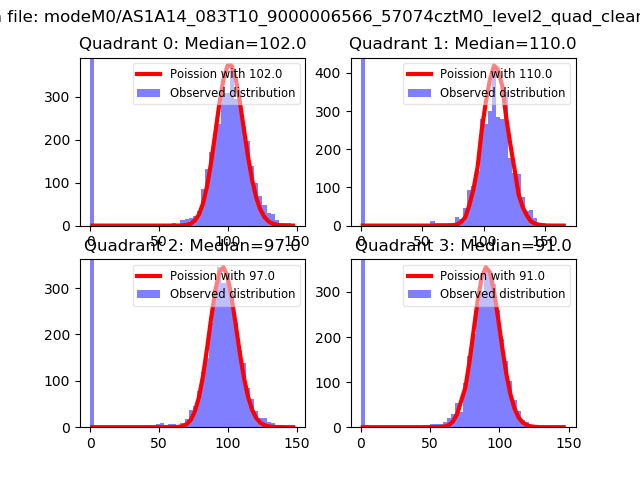 |
 |
| Quadrant-wise count rates Data is divided into 100 sec bins |
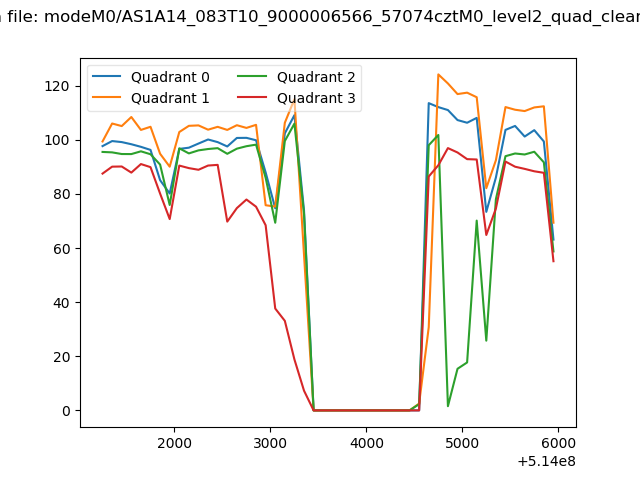 |
|
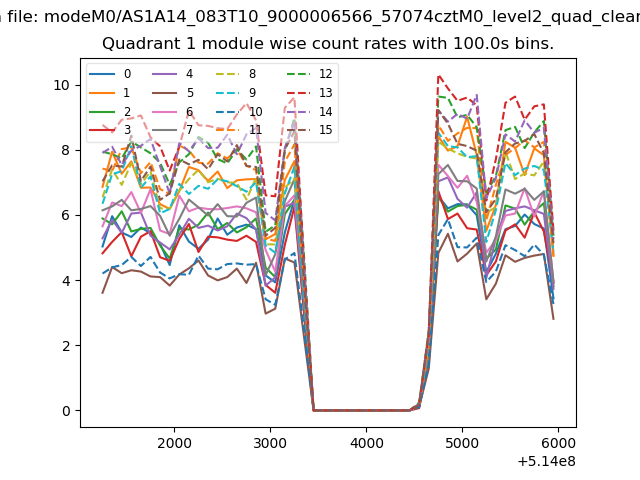
| Module-wise count rates for Quadrant A Data is divided into 100 sec bins |
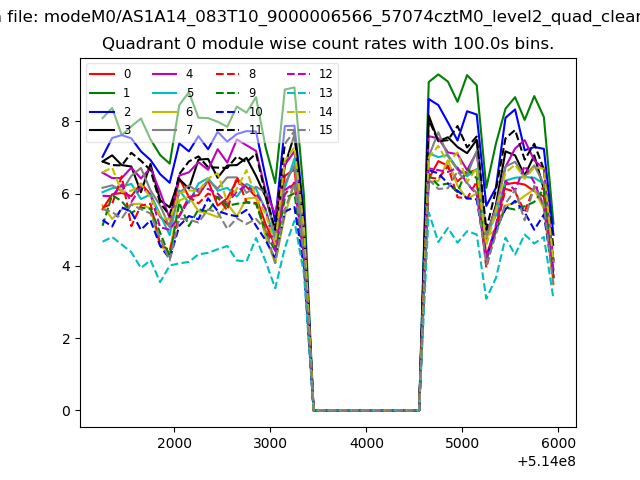 |
 |
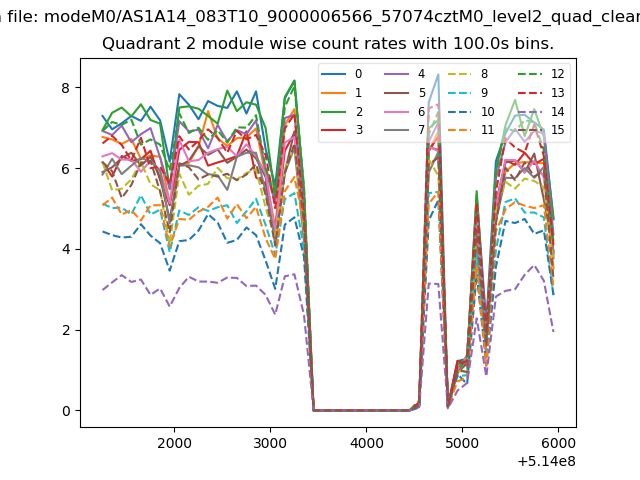
| Module-wise count rates for Quadrant B Data is divided into 100 sec bins |
 |
 |
| Module-wise count rates for Quadrant C Data is divided into 100 sec bins |
 |
 |
| Module-wise count rates for Quadrant D Data is divided into 100 sec bins |
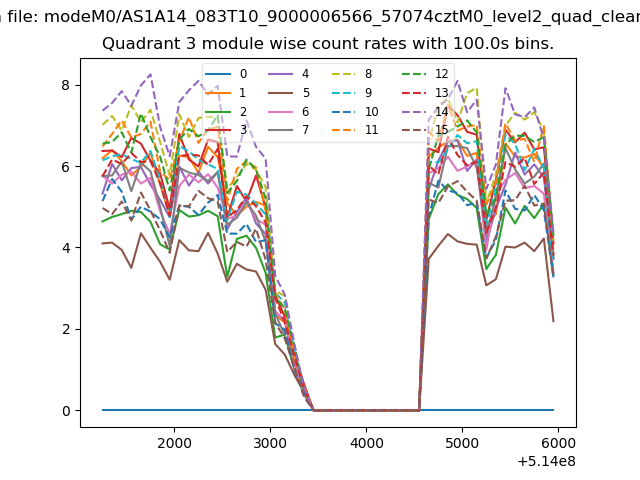 |
 |
| Parameter | Plot |
|---|---|
| CZT HV Monitor | 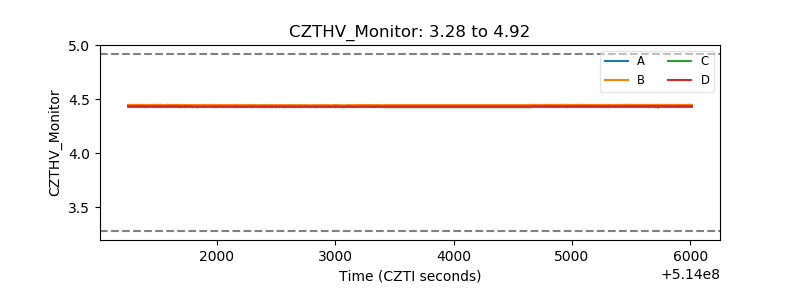 |
| D_VDD | 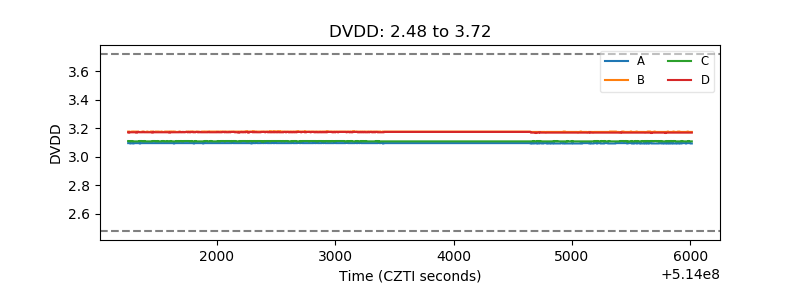 |
| Temperature 1 | 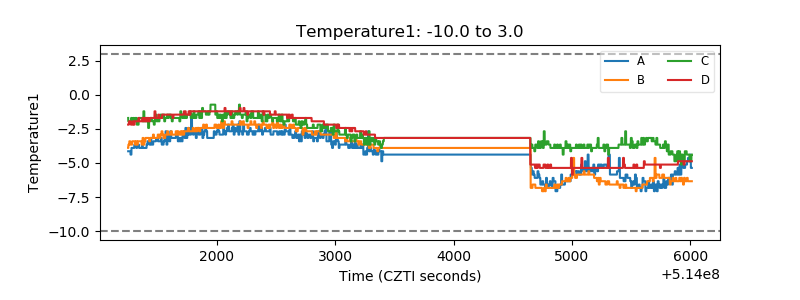 |
| Veto HV Monitor | 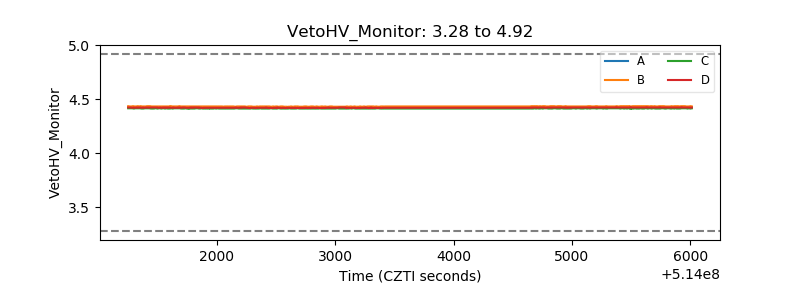 |
| Veto LLD | 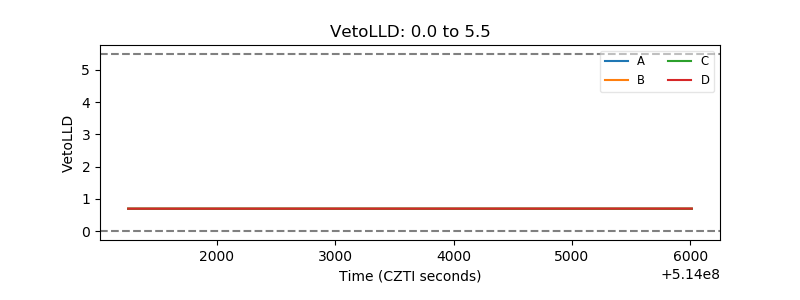 |
| Alpha Counter | 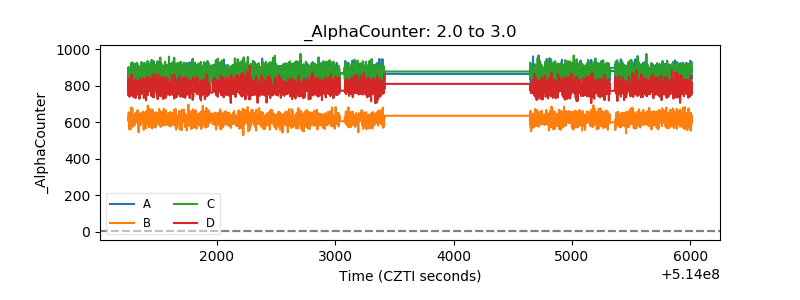 |
| _CPM_Rate | 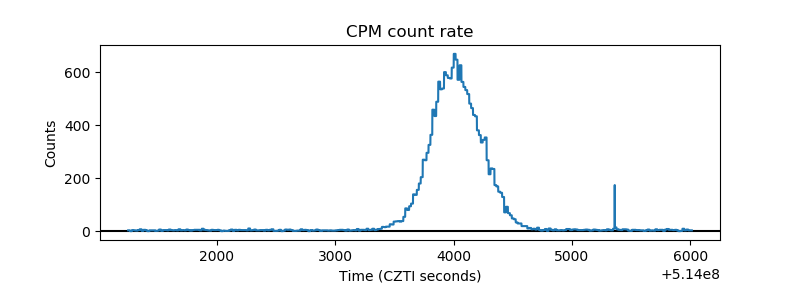 |
| CZT Counter | 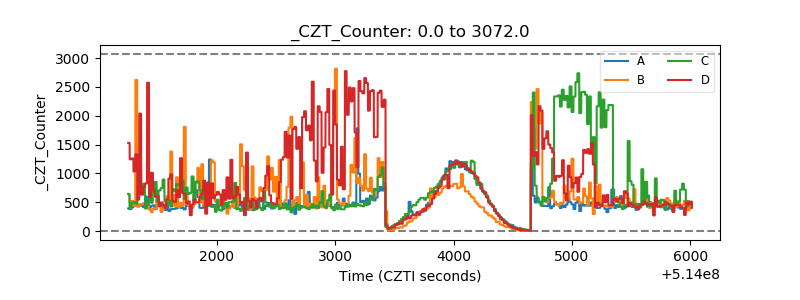 |
| +2.5 Volts monitor | 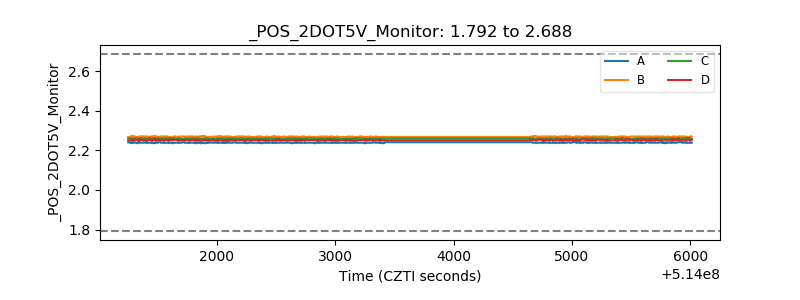 |
| +5 Volts monitor | 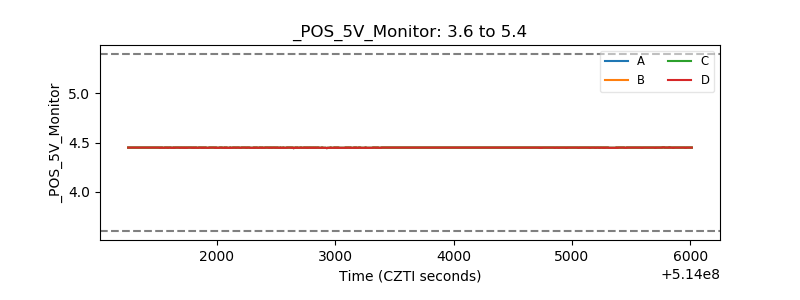 |
| _ROLL_ROT | 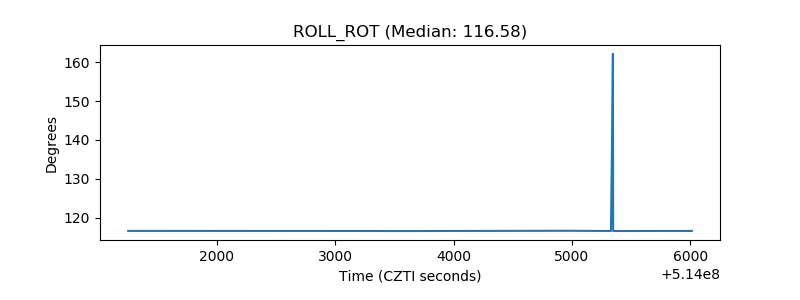 |
| _Roll_DEC | 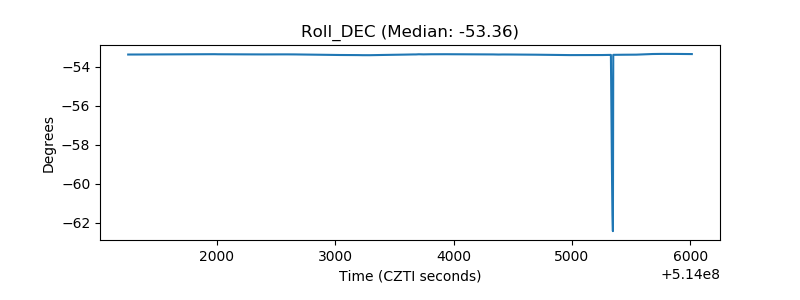 |
| _Roll_RA | 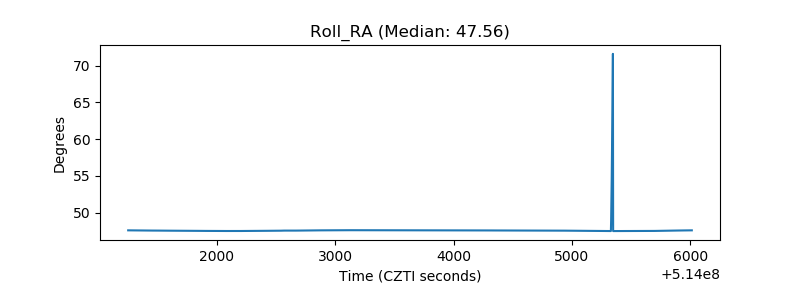 |
| Veto Counter | 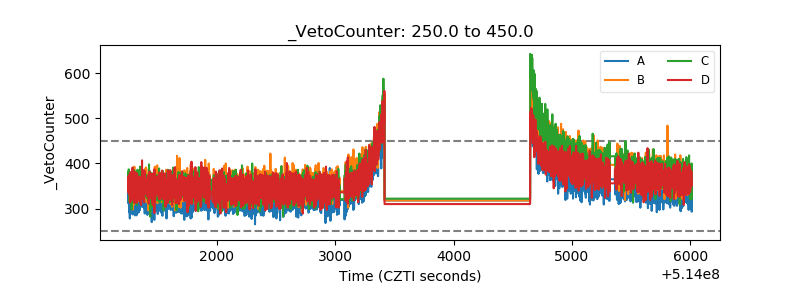 |