| Param | Original file | Final file |
|---|---|---|
| Filename | modeM0/AS1A14_083T10_9000006566_57075cztM0_level2.fits | modeM0/AS1A14_083T10_9000006566_57075cztM0_level2_quad_clean.evt |
| Size (bytes) | 468,800,640 | 93,911,040 |
| Size | 447.1 MB | 89.6 MB |
| Events in quadrant A | 3,052,895 | 635,734 |
| Events in quadrant B | 3,526,703 | 664,993 |
| Events in quadrant C | 6,538,813 | 527,716 |
| Events in quadrant D | 3,736,544 | 567,347 |
| Mode M9 | |||
|---|---|---|---|
| Quadrant | BADHDUFLAG | Total packets | Discarded packets |
| A | 0 | 10 | 0 |
| B | 0 | 10 | 0 |
| C | 0 | 10 | 0 |
| D | 0 | 10 | 0 |
| Mode M0 | |||
|---|---|---|---|
| Quadrant | BADHDUFLAG | Total packets | Discarded packets |
| A | 0 | 13647 | 1 |
| B | 0 | 14951 | 1 |
| C | 0 | 23736 | 1 |
| D | 0 | 15278 | 1 |
| Mode SS | |||
|---|---|---|---|
| Quadrant | BADHDUFLAG | Total packets | Discarded packets |
| A | 0 | 132 | 0 |
| B | 0 | 132 | 0 |
| C | 0 | 132 | 0 |
| D | 0 | 132 | 0 |
| Quadrant | Total seconds | Saturated seconds | Saturation percentage |
|---|---|---|---|
| A | 6415 | 88 | 1.371785% |
| B | 6416 | 281 | 4.379676% |
| C | 6416 | 984 | 15.336658% |
| D | 6416 | 99 | 1.543017% |
Noise dominated data is calculated using 1-second bins in cleaned event files. If a bin has >2000 counts, and if more than 50% of those come from <1% of pixels, then it is considered to be noise-dominated and hence unusable.
| Quadrant | # 1 sec bins | Bins with >0 counts | Bins with >2000 counts | High rate bins dominated by noise | Noise dominated (total time) | Noise dominated (detector-on time) | Marked lightcurve |
|---|---|---|---|---|---|---|---|
| A | 7485 | 6415 | 23 | 23 | 0.31% | 0.36% | 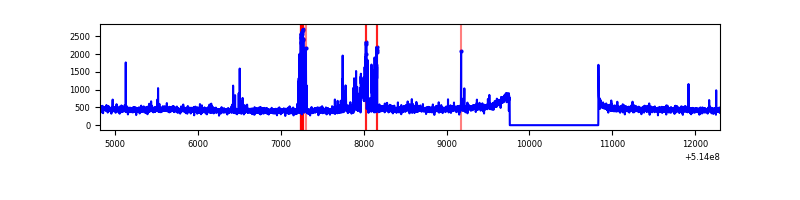 |
| B | 7486 | 6416 | 84 | 84 | 1.12% | 1.31% | 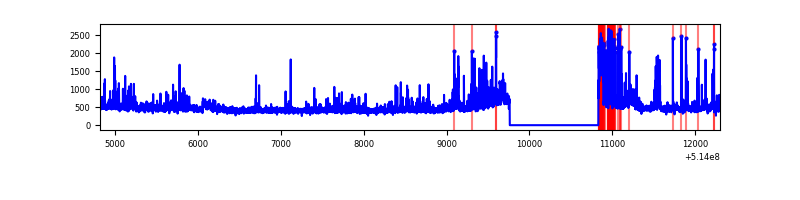 |
| C | 7486 | 6416 | 802 | 802 | 10.71% | 12.50% | 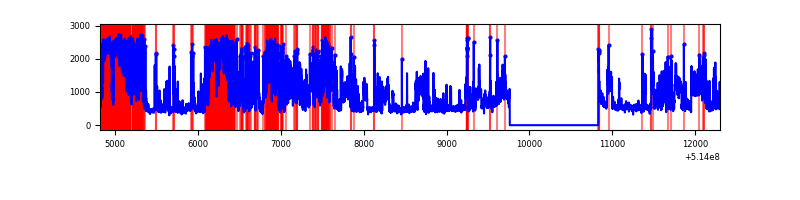 |
| D | 7486 | 6416 | 27 | 27 | 0.36% | 0.42% | 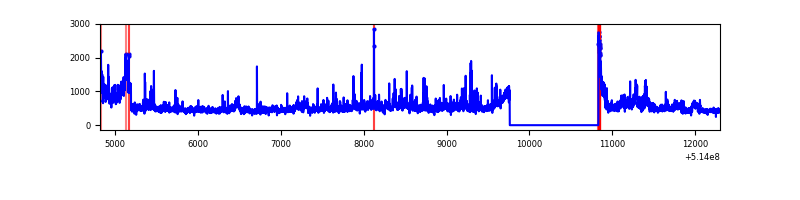 |
Top three noisy pixels from each quadrant. If the there are fewer than three noisy pixels in the level2.evt file, extra rows are filled as -1
| Pixel properties | Quadrant properties | ||||||
|---|---|---|---|---|---|---|---|
| Quadrant | DetID | PixID | Counts | Sigma | Mean | Median | Sigma |
| A | 4 | 249 | 174043 | 1000.53 | 711 | 694 | 173.3 |
| A | 4 | 13 | 71610 | 409.31 | 711 | 694 | 173.3 |
| A | 13 | 248 | 31186 | 175.99 | 711 | 694 | 173.3 |
| B | 10 | 16 | 379825 | 2566.19 | 692 | 668 | 147.8 |
| B | 4 | 171 | 221007 | 1491.29 | 692 | 668 | 147.8 |
| B | 0 | 63 | 39808 | 264.91 | 692 | 668 | 147.8 |
| C | 15 | 198 | 2490625 | 13947.74 | 659 | 655 | 178.5 |
| C | 1 | 16 | 948758 | 5310.87 | 659 | 655 | 178.5 |
| C | 12 | 254 | 227344 | 1269.81 | 659 | 655 | 178.5 |
| D | 15 | 142 | 645940 | 3365.35 | 689 | 657 | 191.7 |
| D | 12 | 33 | 177217 | 920.81 | 689 | 657 | 191.7 |
| D | 2 | 249 | 44583 | 229.09 | 689 | 657 | 191.7 |
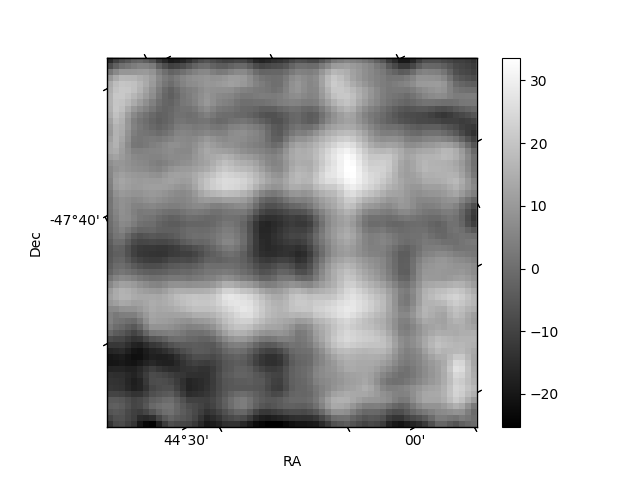
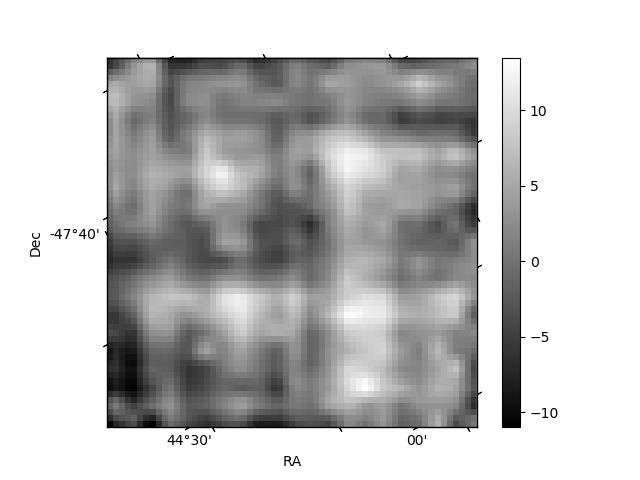
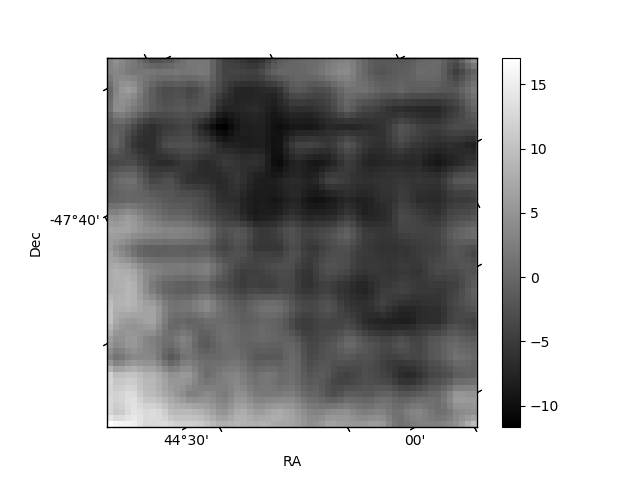
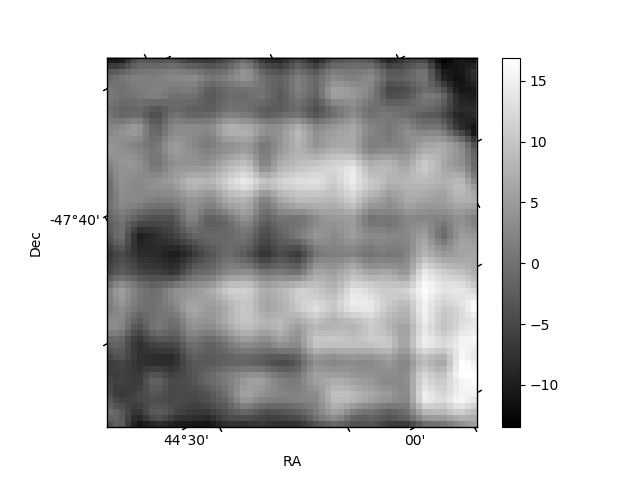
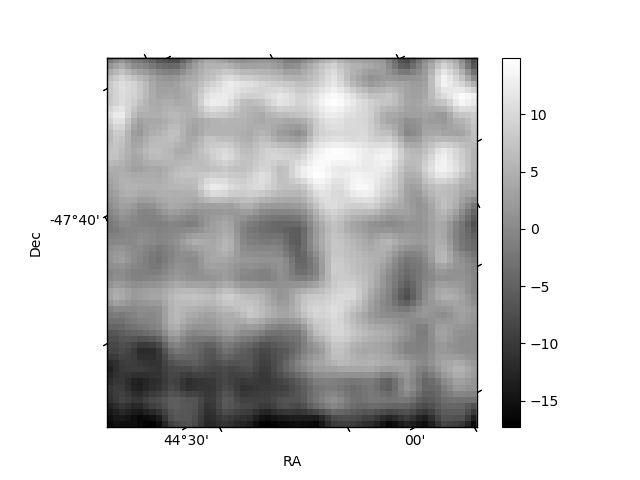
Histogram calculated using DETX and DETY for each event in the final _common_clean file
| Quadrant A | 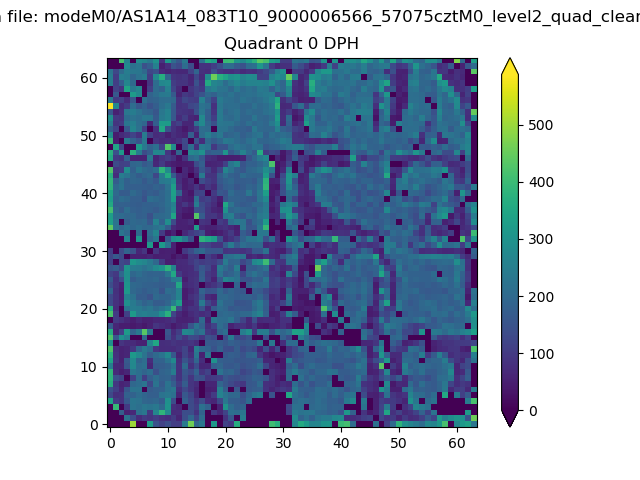 |
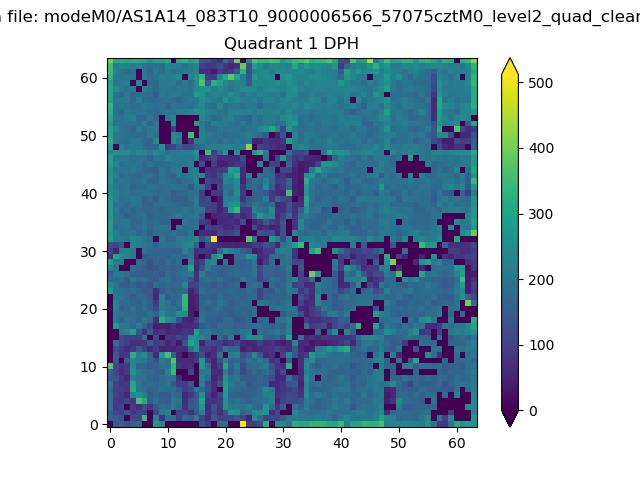 |
Quadrant B |
|---|---|---|---|
| Quadrant D | 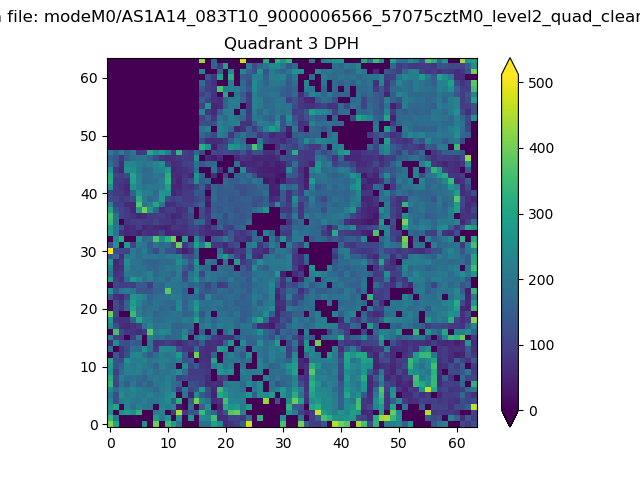 |
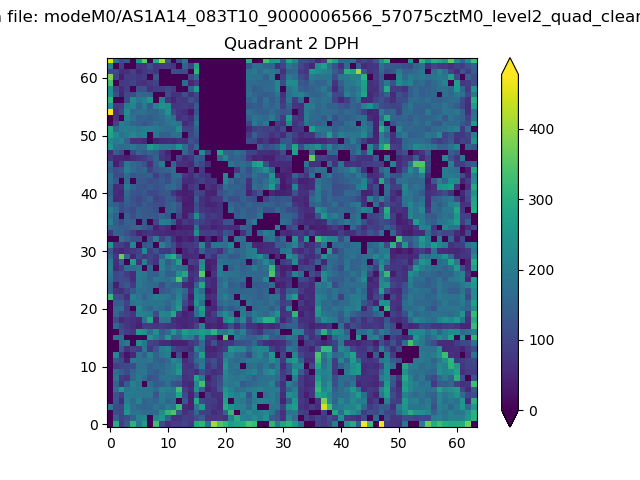 |
Quadrant C |
| Plot type | Count rate plots | Images |
|---|---|---|
| Comparison with Poisson distribution Blue bars denote a histogram of data divided into 1 sec bins. Red curve is a Poisson curve with rate = median count rate of data. |
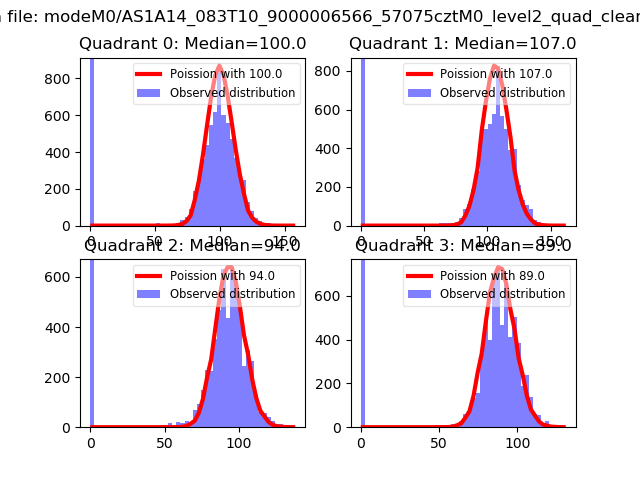 |
 |
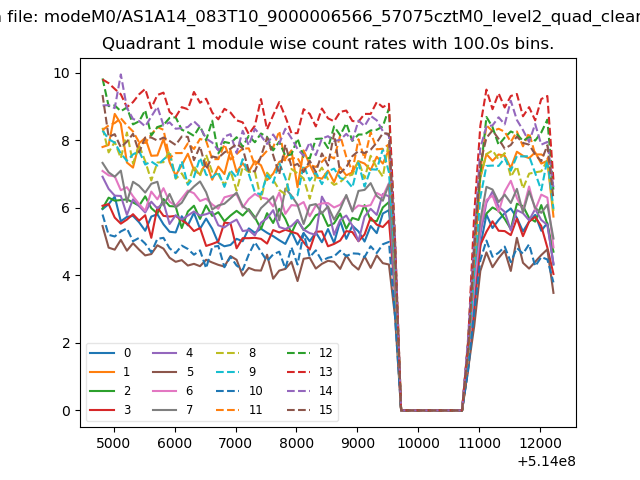
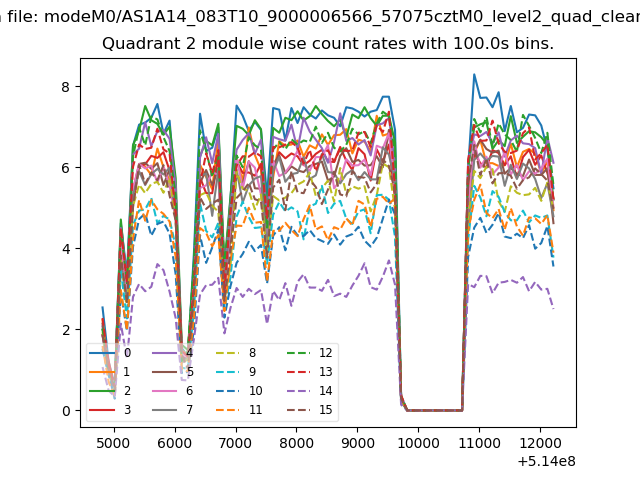
| Quadrant-wise count rates Data is divided into 100 sec bins |
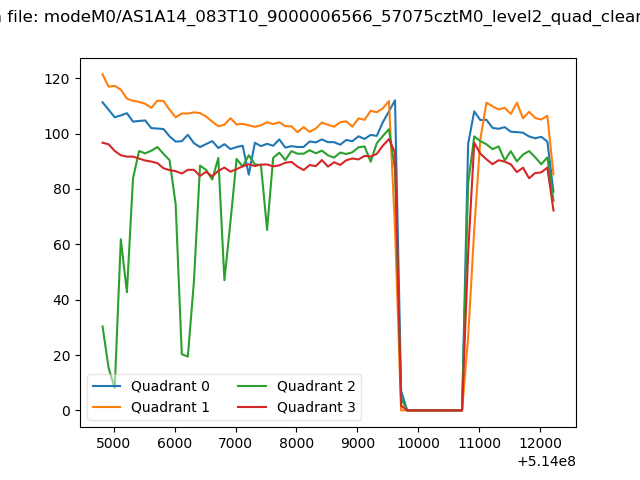 |
|
| Module-wise count rates for Quadrant A Data is divided into 100 sec bins |
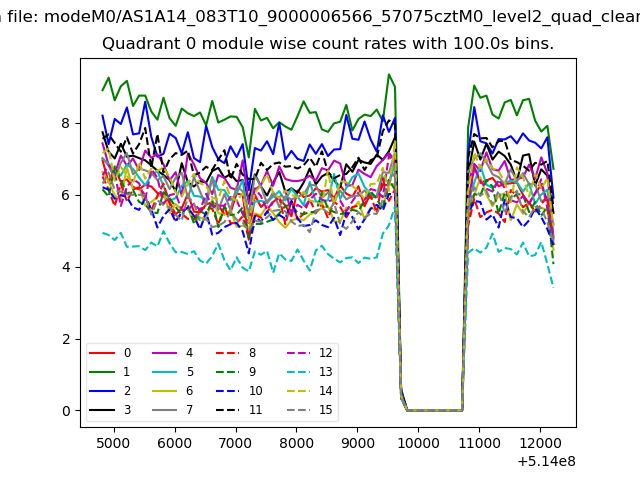 |
 |
| Module-wise count rates for Quadrant B Data is divided into 100 sec bins |
 |
 |
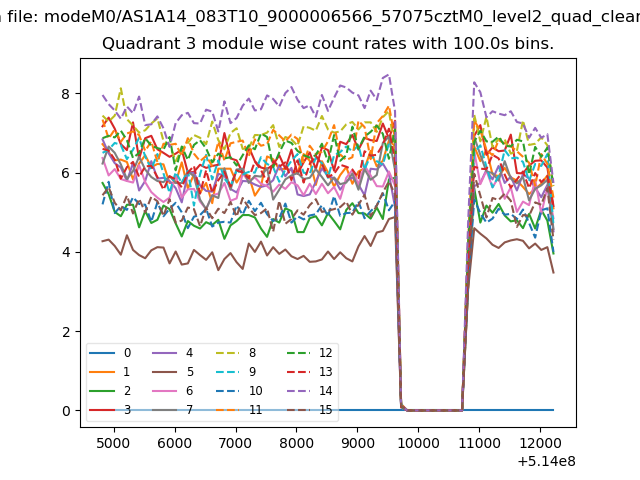
| Module-wise count rates for Quadrant C Data is divided into 100 sec bins |
 |
 |
| Module-wise count rates for Quadrant D Data is divided into 100 sec bins |
 |
 |
| Parameter | Plot |
|---|---|
| CZT HV Monitor | 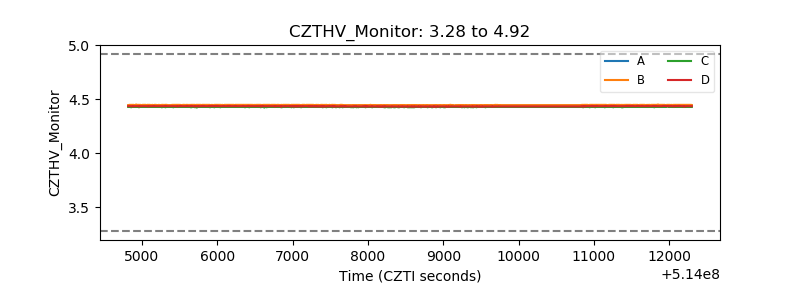 |
| D_VDD | 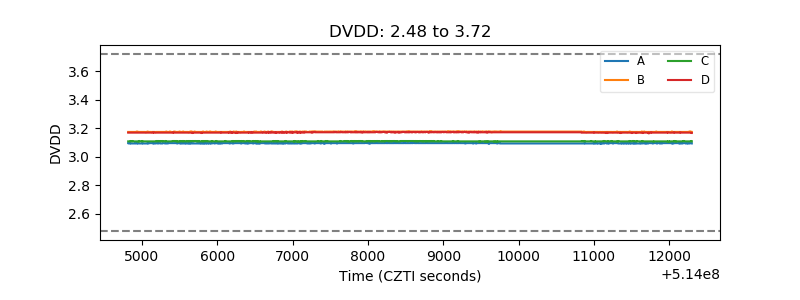 |
| Temperature 1 | 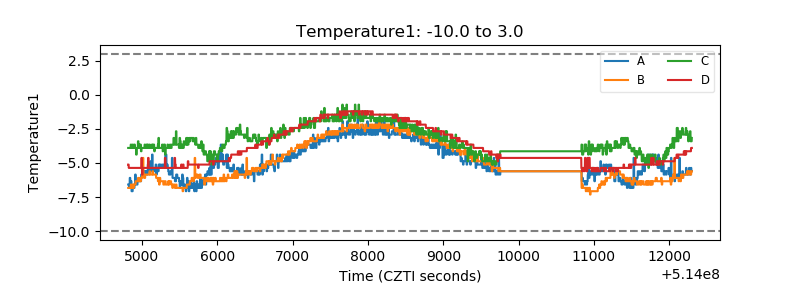 |
| Veto HV Monitor | 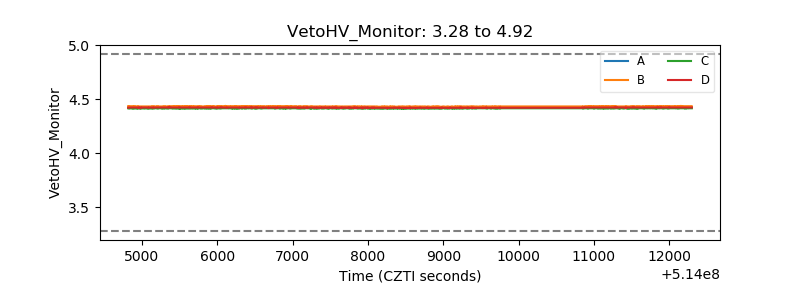 |
| Veto LLD | 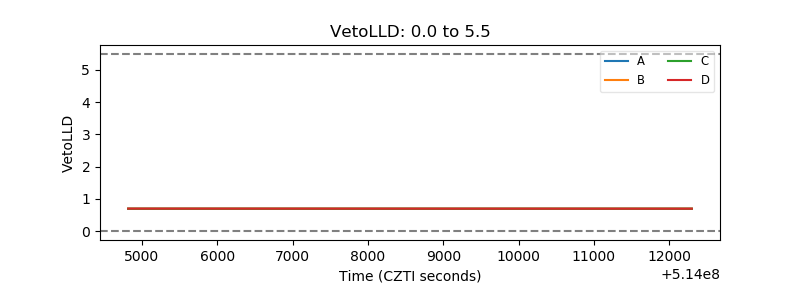 |
| Alpha Counter | 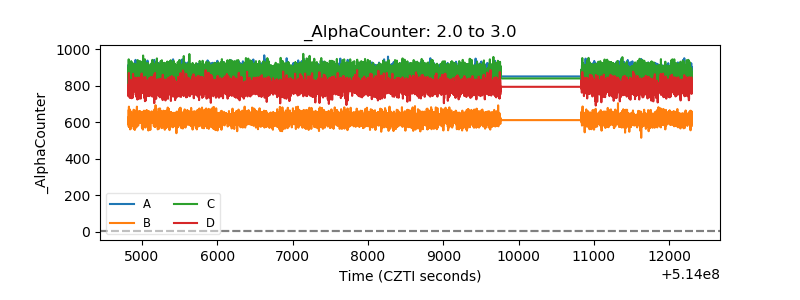 |
| _CPM_Rate | 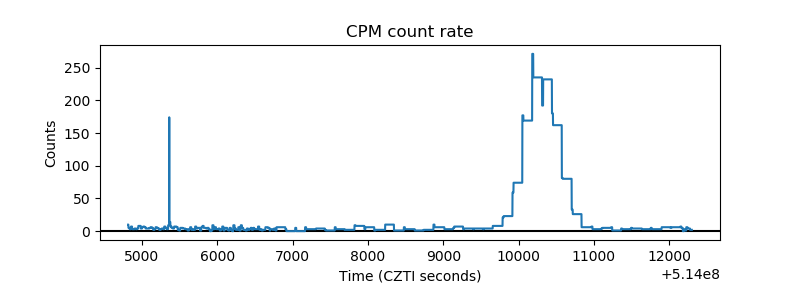 |
| CZT Counter | 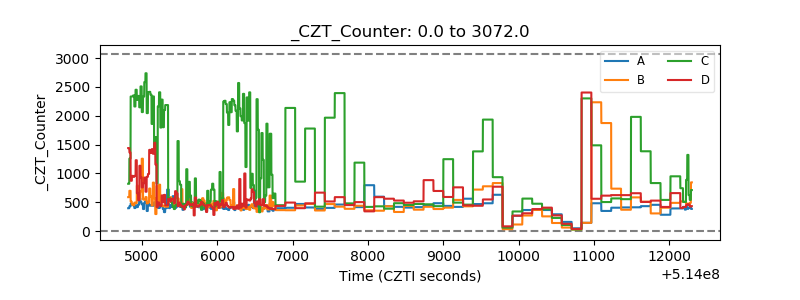 |
| +2.5 Volts monitor |  |
| +5 Volts monitor |  |
| _ROLL_ROT | 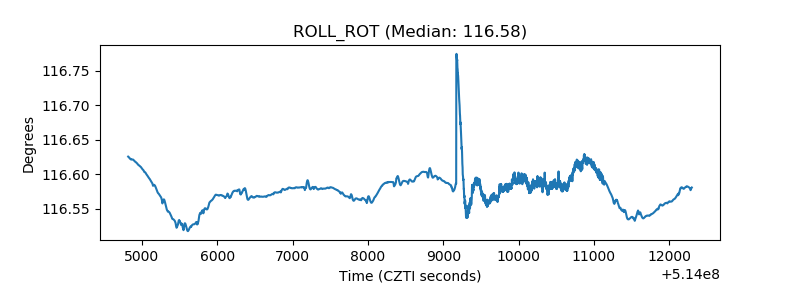 |
| _Roll_DEC | 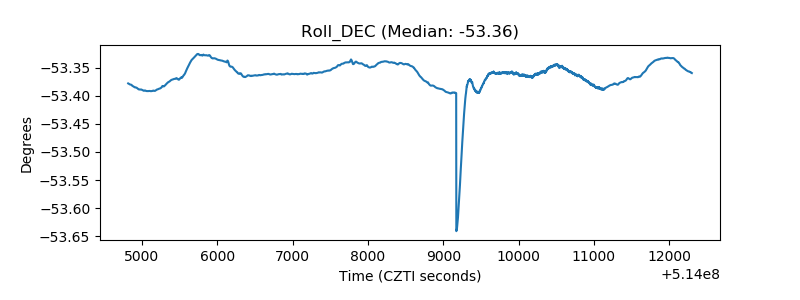 |
| _Roll_RA | 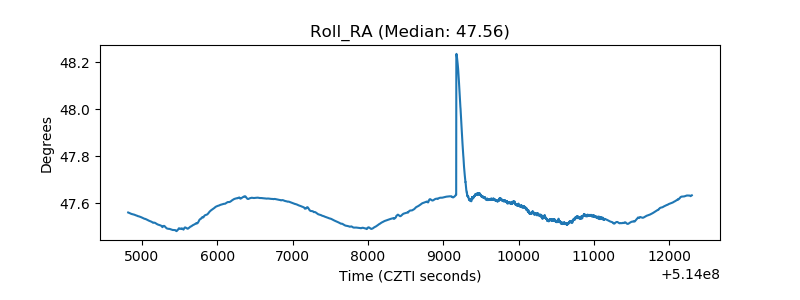 |
| Veto Counter | 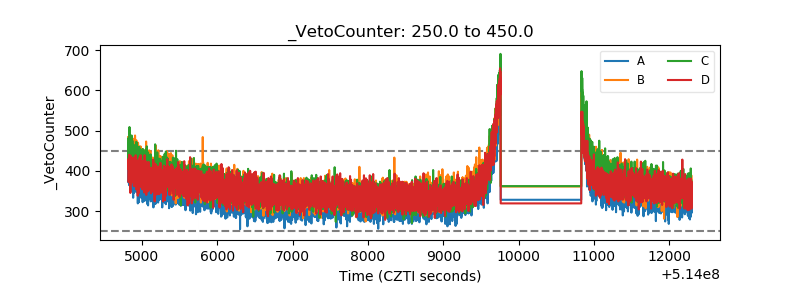 |