| Param | Original file | Final file |
|---|---|---|
| Filename | modeM0/AS1A14_083T10_9000006566_57076cztM0_level2.fits | modeM0/AS1A14_083T10_9000006566_57076cztM0_level2_quad_clean.evt |
| Size (bytes) | 479,350,080 | 93,484,800 |
| Size | 457.1 MB | 89.2 MB |
| Events in quadrant A | 3,693,371 | 583,985 |
| Events in quadrant B | 4,172,756 | 653,445 |
| Events in quadrant C | 5,453,626 | 576,845 |
| Events in quadrant D | 3,911,442 | 556,613 |
| Mode M9 | |||
|---|---|---|---|
| Quadrant | BADHDUFLAG | Total packets | Discarded packets |
| A | 0 | 8 | 0 |
| B | 0 | 8 | 0 |
| C | 0 | 8 | 0 |
| D | 0 | 8 | 0 |
| Mode M0 | |||
|---|---|---|---|
| Quadrant | BADHDUFLAG | Total packets | Discarded packets |
| A | 0 | 15744 | 1 |
| B | 0 | 16987 | 1 |
| C | 0 | 20657 | 1 |
| D | 0 | 16169 | 1 |
| Mode SS | |||
|---|---|---|---|
| Quadrant | BADHDUFLAG | Total packets | Discarded packets |
| A | 0 | 134 | 0 |
| B | 0 | 134 | 0 |
| C | 0 | 134 | 0 |
| D | 0 | 134 | 0 |
| Quadrant | Total seconds | Saturated seconds | Saturation percentage |
|---|---|---|---|
| A | 6593 | 635 | 9.631427% |
| B | 6594 | 404 | 6.126782% |
| C | 6594 | 491 | 7.446163% |
| D | 6594 | 267 | 4.049136% |
Noise dominated data is calculated using 1-second bins in cleaned event files. If a bin has >2000 counts, and if more than 50% of those come from <1% of pixels, then it is considered to be noise-dominated and hence unusable.
| Quadrant | # 1 sec bins | Bins with >0 counts | Bins with >2000 counts | High rate bins dominated by noise | Noise dominated (total time) | Noise dominated (detector-on time) | Marked lightcurve |
|---|---|---|---|---|---|---|---|
| A | 7432 | 6592 | 234 | 234 | 3.15% | 3.55% | 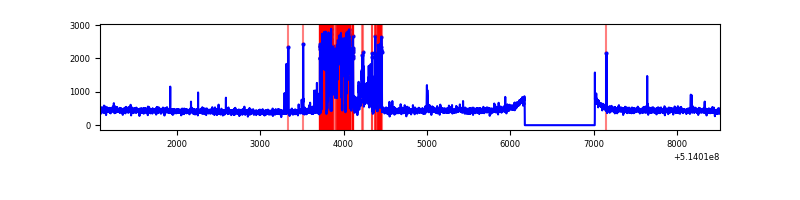 |
| B | 7433 | 6593 | 190 | 190 | 2.56% | 2.88% | 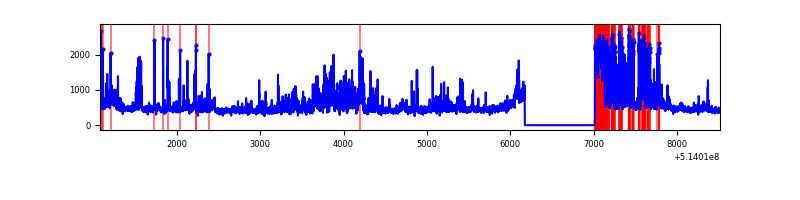 |
| C | 7433 | 6593 | 327 | 327 | 4.40% | 4.96% | 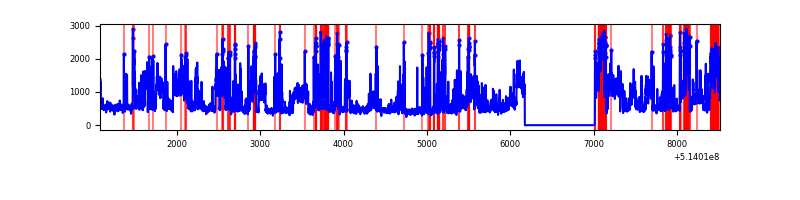 |
| D | 7433 | 6594 | 189 | 189 | 2.54% | 2.87% | 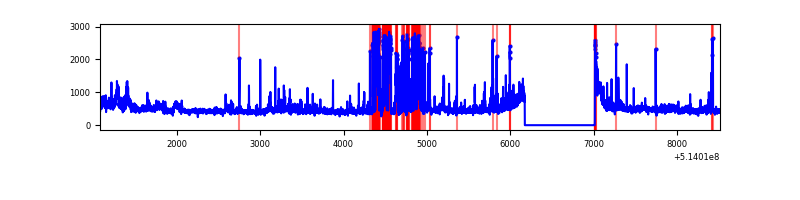 |
Top three noisy pixels from each quadrant. If the there are fewer than three noisy pixels in the level2.evt file, extra rows are filled as -1
| Pixel properties | Quadrant properties | ||||||
|---|---|---|---|---|---|---|---|
| Quadrant | DetID | PixID | Counts | Sigma | Mean | Median | Sigma |
| A | 13 | 248 | 980566 | 5993.8 | 670 | 651 | 163.5 |
| A | 4 | 249 | 50687 | 306.05 | 670 | 651 | 163.5 |
| A | 10 | 251 | 26545 | 158.38 | 670 | 651 | 163.5 |
| B | 10 | 16 | 775280 | 5258.58 | 687 | 663 | 147.3 |
| B | 4 | 171 | 509040 | 3451.18 | 687 | 663 | 147.3 |
| B | 0 | 63 | 58449 | 392.29 | 687 | 663 | 147.3 |
| C | 1 | 16 | 1217911 | 6550.36 | 682 | 675 | 185.8 |
| C | 12 | 254 | 967636 | 5203.55 | 682 | 675 | 185.8 |
| C | 15 | 198 | 360471 | 1936.18 | 682 | 675 | 185.8 |
| D | 12 | 33 | 592622 | 3056.81 | 688 | 658 | 193.7 |
| D | 15 | 142 | 273658 | 1409.73 | 688 | 658 | 193.7 |
| D | 3 | 12 | 71770 | 367.21 | 688 | 658 | 193.7 |
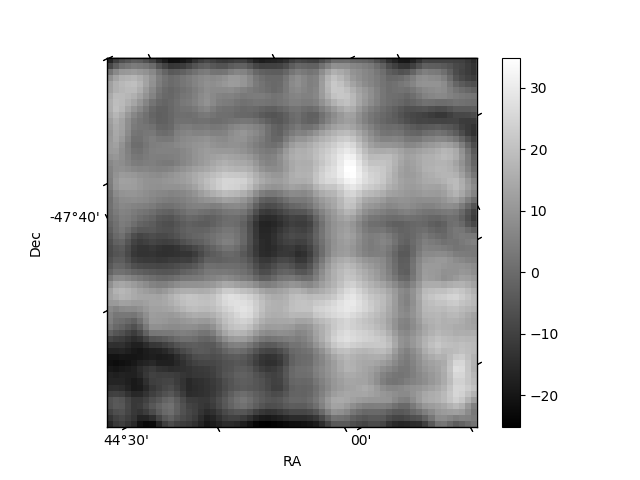
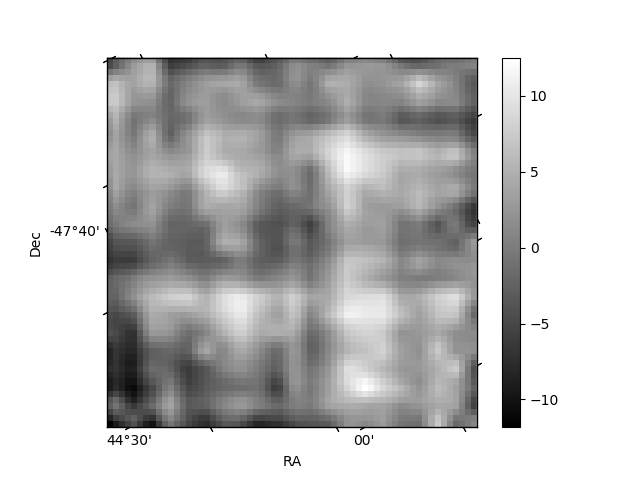
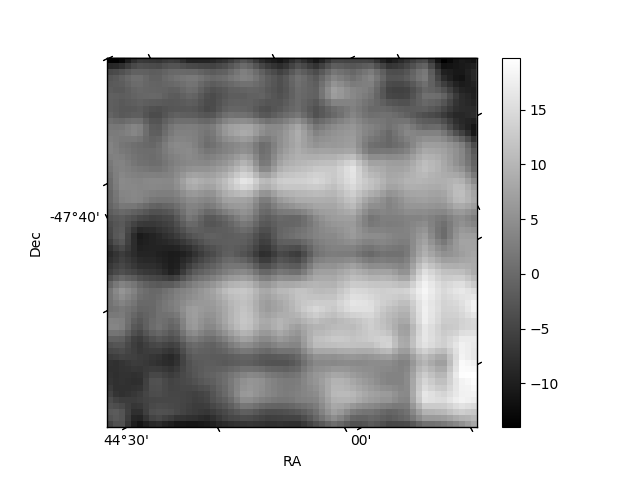
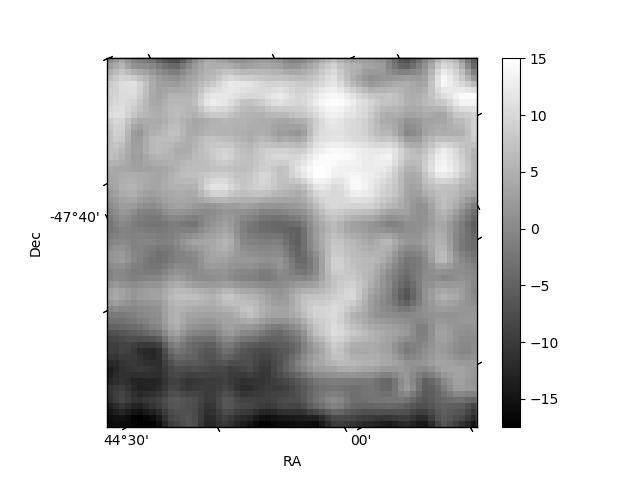
Histogram calculated using DETX and DETY for each event in the final _common_clean file
| Quadrant A | 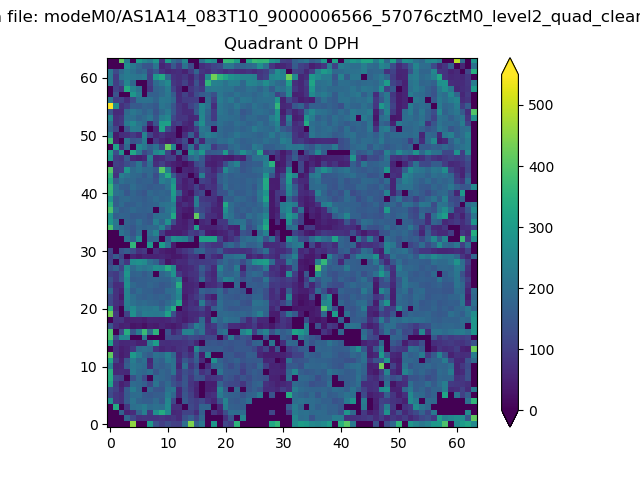 |
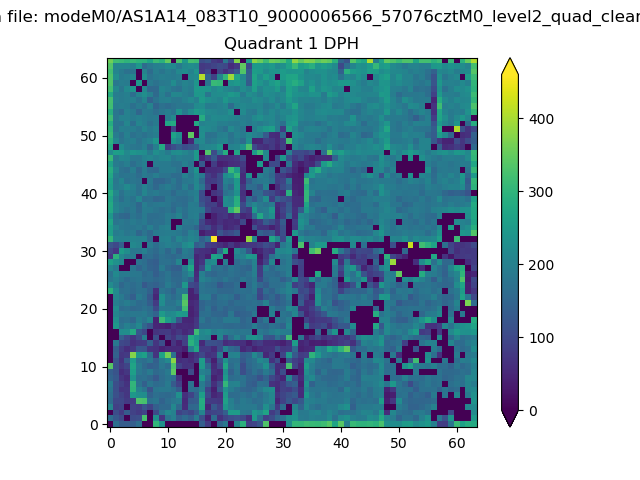 |
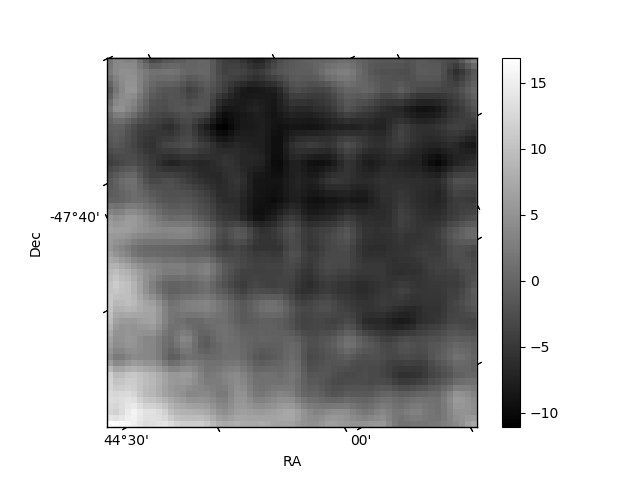
Quadrant B |
|---|---|---|---|
| Quadrant D | 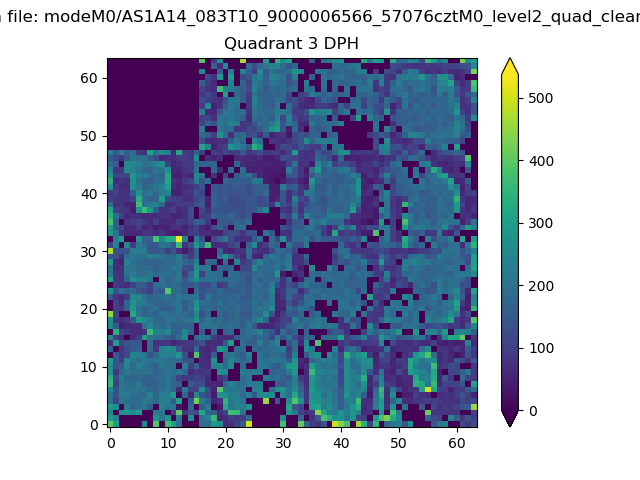 |
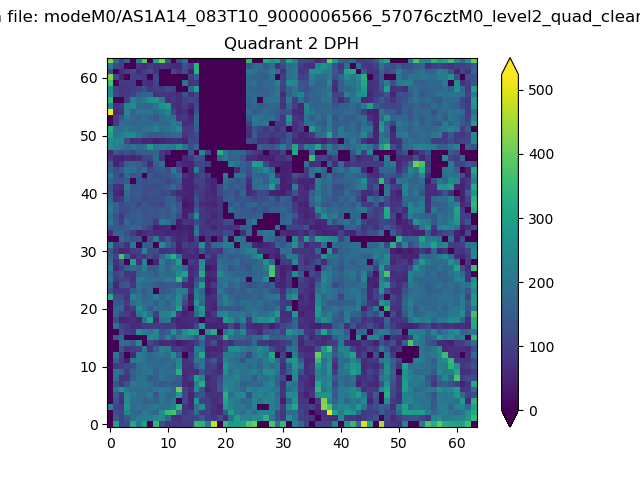 |
Quadrant C |
| Plot type | Count rate plots | Images |
|---|---|---|
| Comparison with Poisson distribution Blue bars denote a histogram of data divided into 1 sec bins. Red curve is a Poisson curve with rate = median count rate of data. |
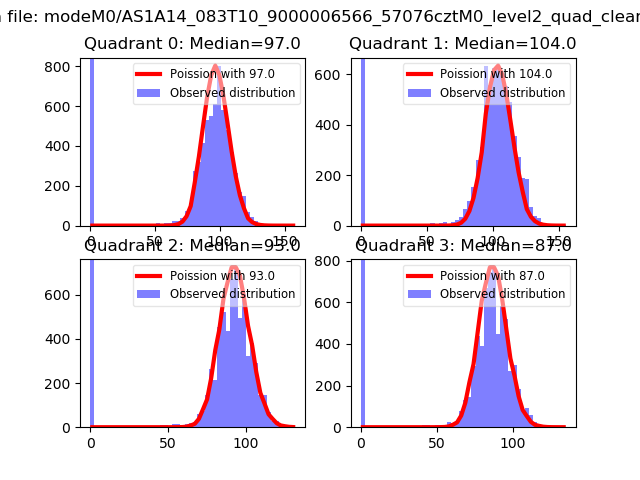 |
 |
| Quadrant-wise count rates Data is divided into 100 sec bins |
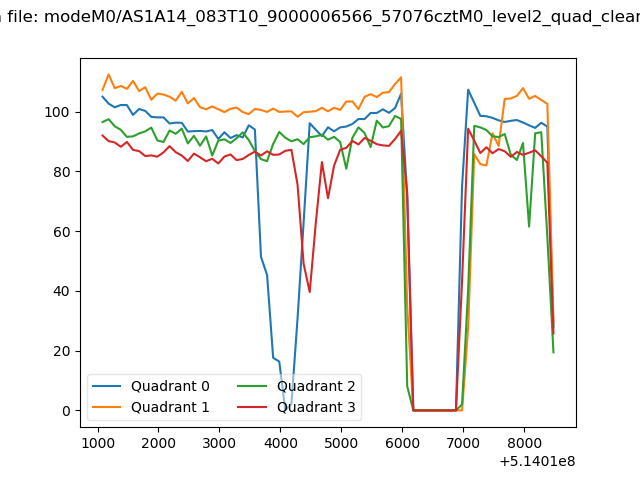 |
|
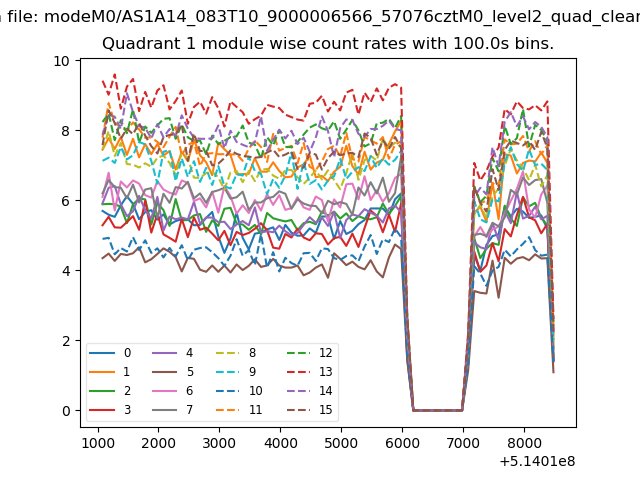
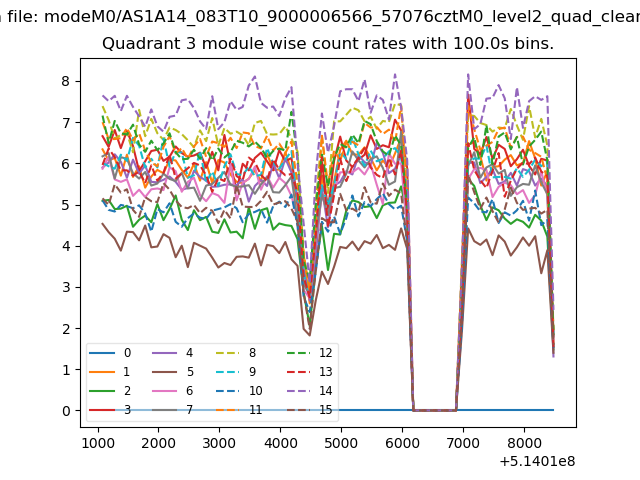
| Module-wise count rates for Quadrant A Data is divided into 100 sec bins |
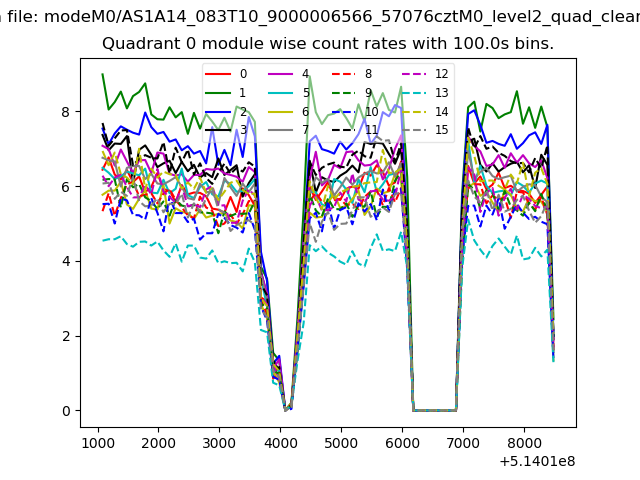 |
 |
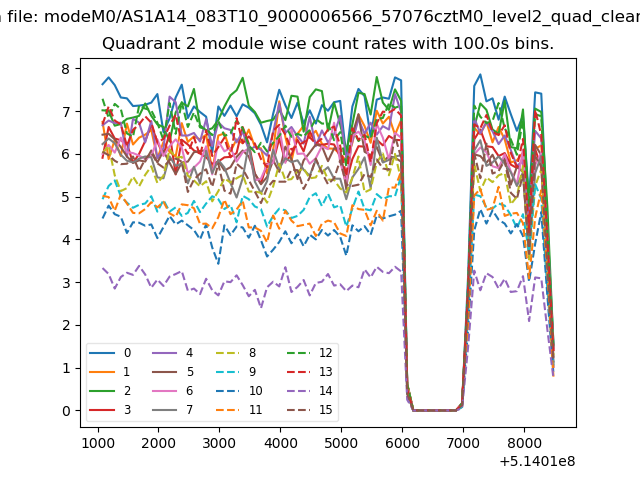
| Module-wise count rates for Quadrant B Data is divided into 100 sec bins |
 |
 |
| Module-wise count rates for Quadrant C Data is divided into 100 sec bins |
 |
 |
| Module-wise count rates for Quadrant D Data is divided into 100 sec bins |
 |
 |
| Parameter | Plot |
|---|---|
| CZT HV Monitor | 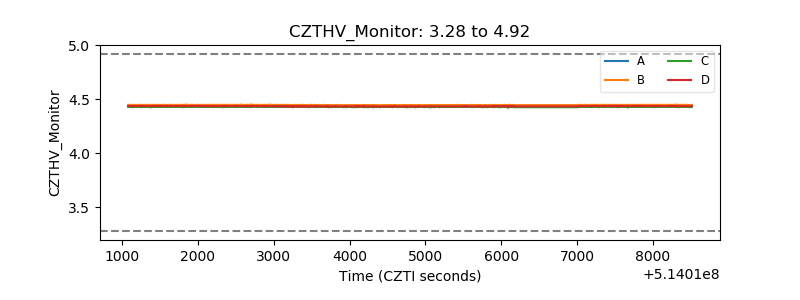 |
| D_VDD | 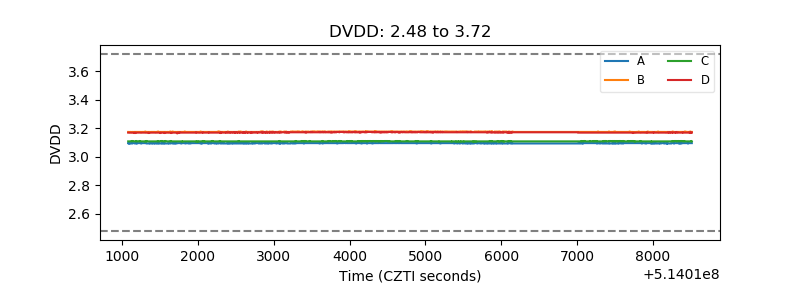 |
| Temperature 1 | 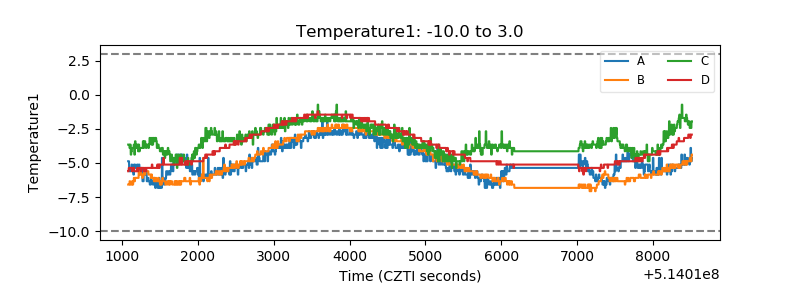 |
| Veto HV Monitor | 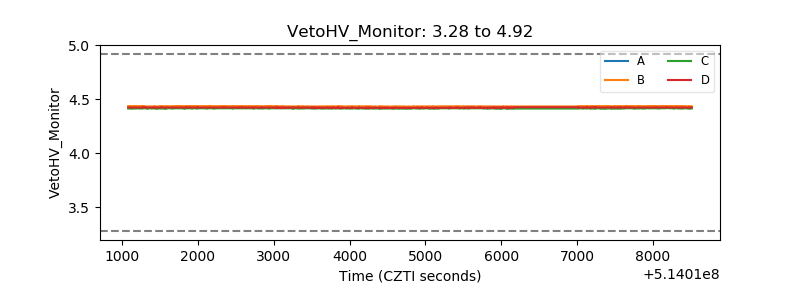 |
| Veto LLD | 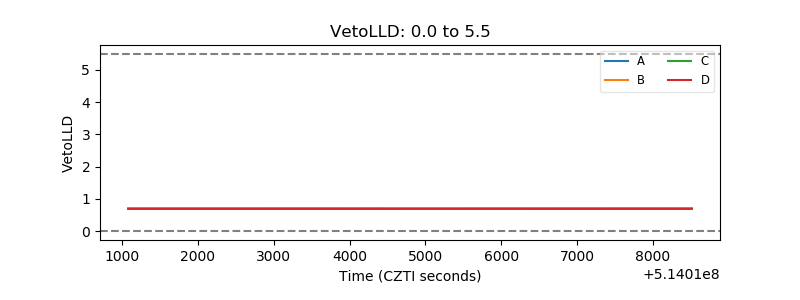 |
| Alpha Counter | 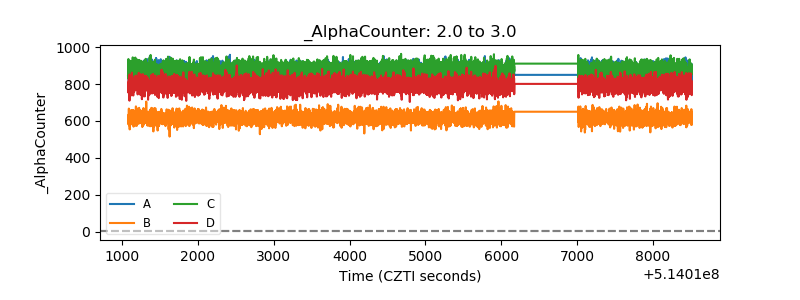 |
| _CPM_Rate | 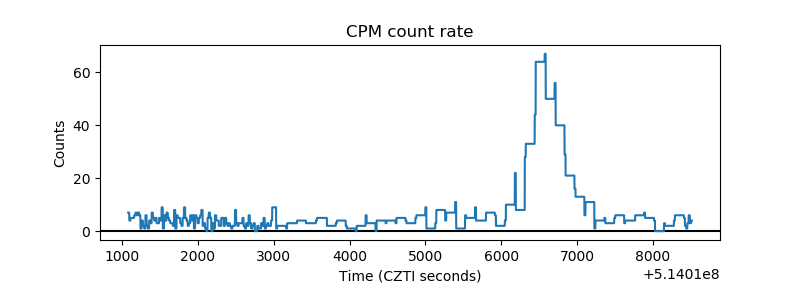 |
| CZT Counter | 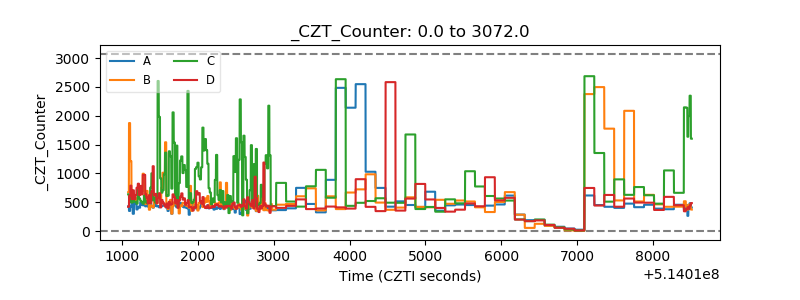 |
| +2.5 Volts monitor |  |
| +5 Volts monitor |  |
| _ROLL_ROT | 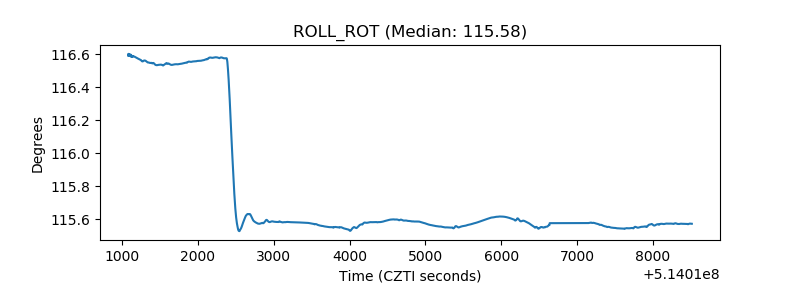 |
| _Roll_DEC | 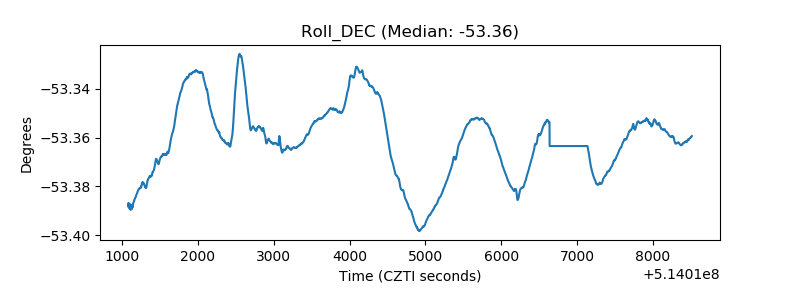 |
| _Roll_RA | 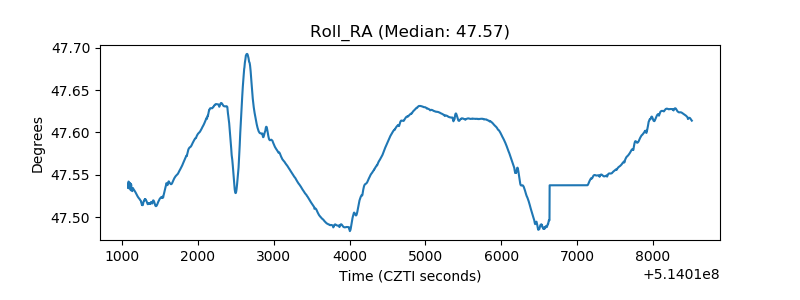 |
| Veto Counter | 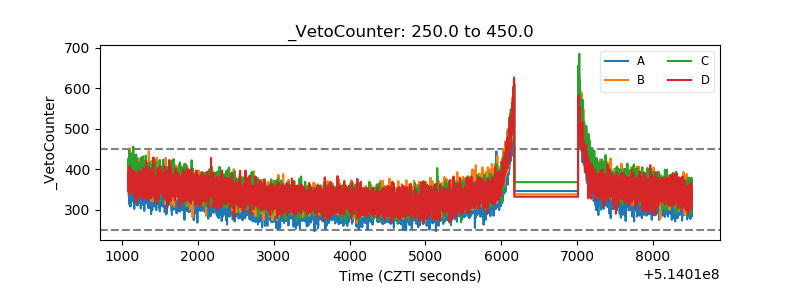 |