| Param | Original file | Final file |
|---|---|---|
| Filename | modeM0/AS1A14_083T10_9000006566_57078cztM0_level2.fits | modeM0/AS1A14_083T10_9000006566_57078cztM0_level2_quad_clean.evt |
| Size (bytes) | 542,891,520 | 107,565,120 |
| Size | 517.7 MB | 102.6 MB |
| Events in quadrant A | 3,308,563 | 711,534 |
| Events in quadrant B | 4,055,063 | 764,535 |
| Events in quadrant C | 5,496,490 | 662,325 |
| Events in quadrant D | 6,654,783 | 597,356 |
| Mode M0 | |||
|---|---|---|---|
| Quadrant | BADHDUFLAG | Total packets | Discarded packets |
| A | 0 | 15441 | 0 |
| B | 0 | 17302 | 0 |
| C | 0 | 21492 | 0 |
| D | 0 | 24902 | 0 |
| Mode SS | |||
|---|---|---|---|
| Quadrant | BADHDUFLAG | Total packets | Discarded packets |
| A | 0 | 150 | 0 |
| B | 0 | 150 | 0 |
| C | 0 | 150 | 0 |
| D | 0 | 150 | 0 |
| Quadrant | Total seconds | Saturated seconds | Saturation percentage |
|---|---|---|---|
| A | 7488 | 17 | 0.227030% |
| B | 7489 | 87 | 1.161704% |
| C | 7489 | 394 | 5.261050% |
| D | 7489 | 727 | 9.707571% |
Noise dominated data is calculated using 1-second bins in cleaned event files. If a bin has >2000 counts, and if more than 50% of those come from <1% of pixels, then it is considered to be noise-dominated and hence unusable.
| Quadrant | # 1 sec bins | Bins with >0 counts | Bins with >2000 counts | High rate bins dominated by noise | Noise dominated (total time) | Noise dominated (detector-on time) | Marked lightcurve |
|---|---|---|---|---|---|---|---|
| A | 7488 | 7488 | 7 | 7 | 0.09% | 0.09% | 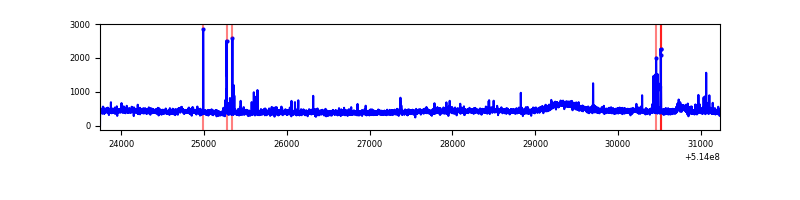 |
| B | 7489 | 7489 | 39 | 39 | 0.52% | 0.52% | 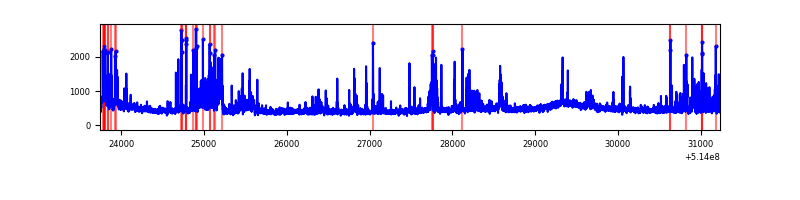 |
| C | 7489 | 7489 | 348 | 348 | 4.65% | 4.65% | 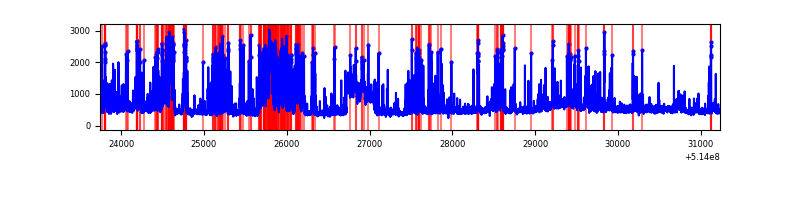 |
| D | 7489 | 7489 | 751 | 751 | 10.03% | 10.03% | 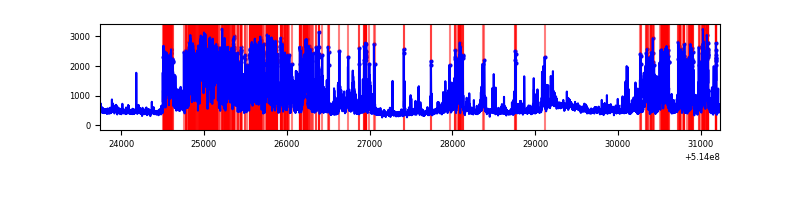 |
Top three noisy pixels from each quadrant. If the there are fewer than three noisy pixels in the level2.evt file, extra rows are filled as -1
| Pixel properties | Quadrant properties | ||||||
|---|---|---|---|---|---|---|---|
| Quadrant | DetID | PixID | Counts | Sigma | Mean | Median | Sigma |
| A | 3 | 14 | 86410 | 427.5 | 814 | 792 | 200.3 |
| A | 13 | 248 | 37240 | 181.99 | 814 | 792 | 200.3 |
| A | 10 | 251 | 18123 | 86.54 | 814 | 792 | 200.3 |
| B | 4 | 171 | 384004 | 2244.47 | 798 | 766 | 170.7 |
| B | 10 | 16 | 318096 | 1858.47 | 798 | 766 | 170.7 |
| B | 0 | 63 | 62198 | 359.78 | 798 | 766 | 170.7 |
| C | 12 | 254 | 826871 | 3958.51 | 775 | 770 | 208.7 |
| C | 15 | 198 | 485273 | 2321.64 | 775 | 770 | 208.7 |
| C | 14 | 245 | 329946 | 1577.34 | 775 | 770 | 208.7 |
| D | 12 | 33 | 2919210 | 13624.9 | 762 | 727 | 214.2 |
| D | 2 | 249 | 232469 | 1081.88 | 762 | 727 | 214.2 |
| D | 7 | 96 | 117647 | 545.84 | 762 | 727 | 214.2 |
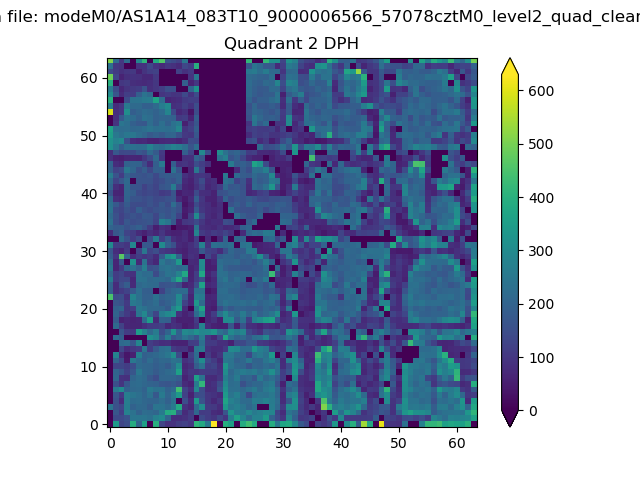
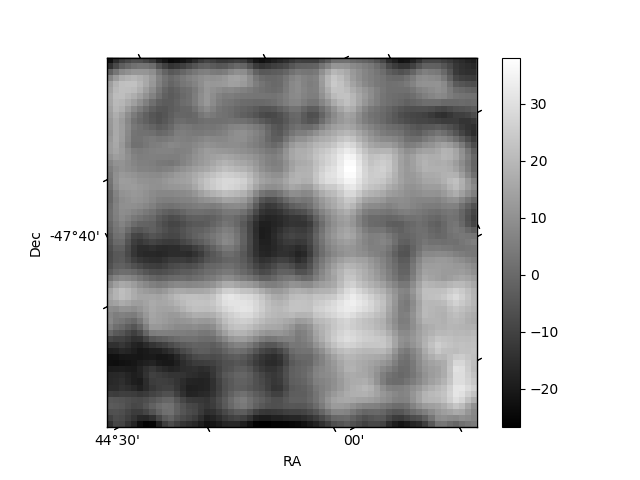
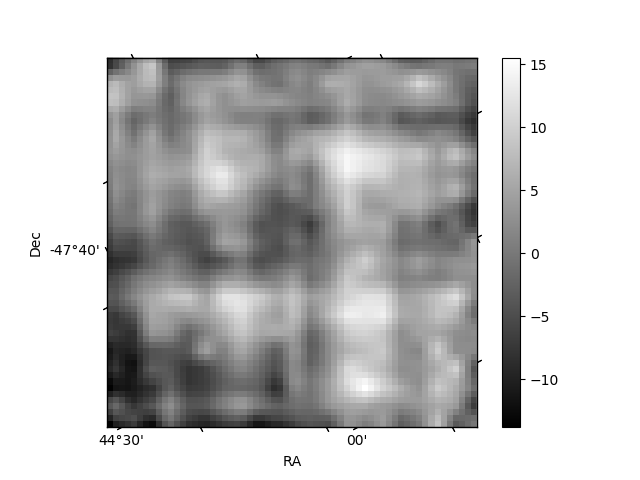
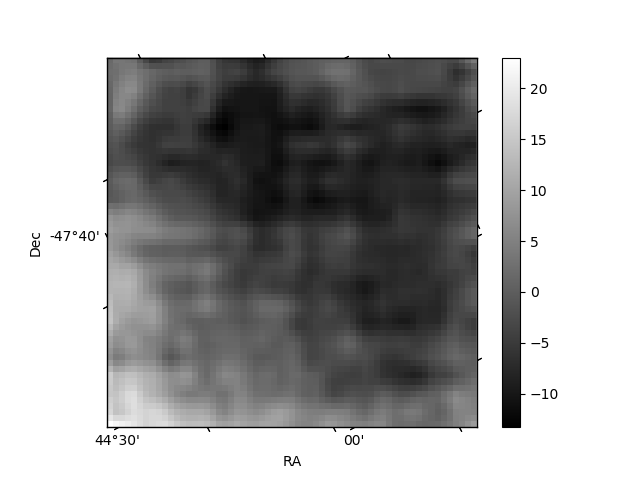
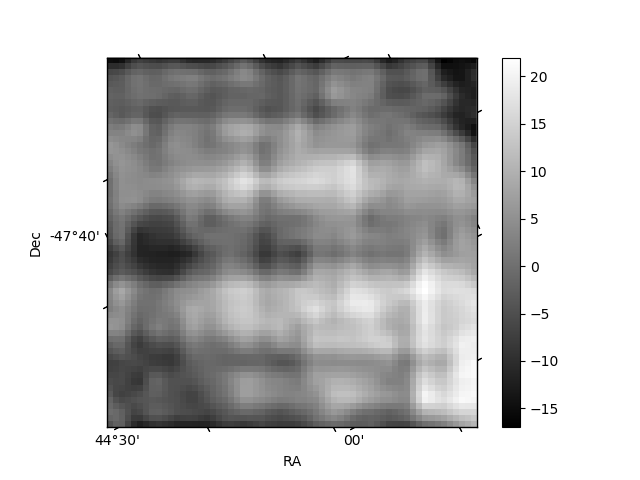
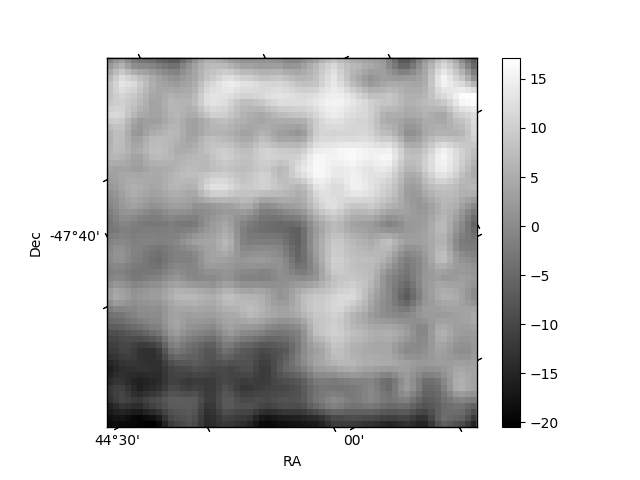
Histogram calculated using DETX and DETY for each event in the final _common_clean file
| Quadrant A | 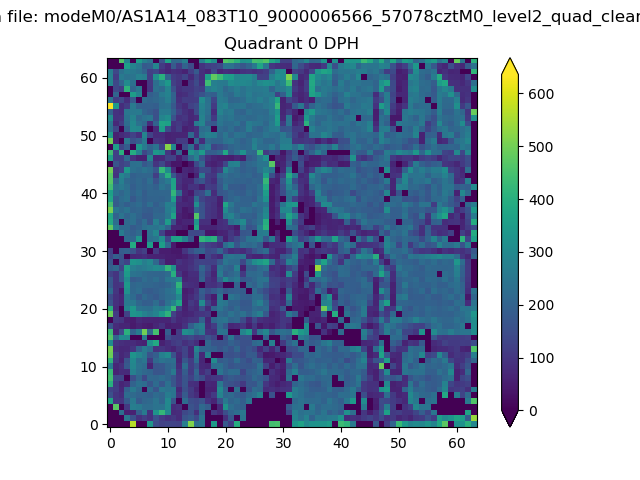 |
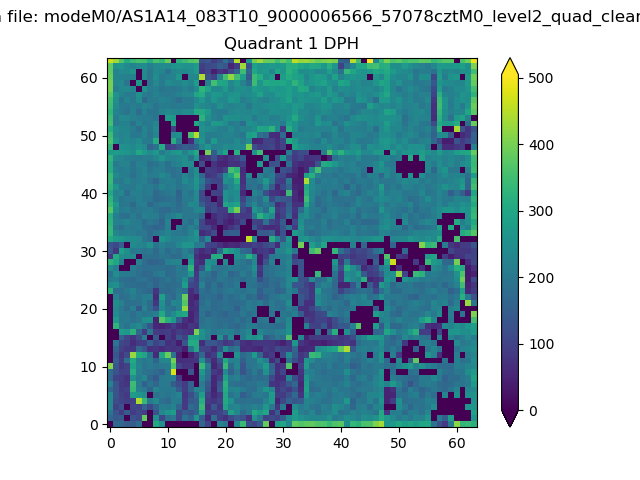 |
Quadrant B |
|---|---|---|---|
| Quadrant D | 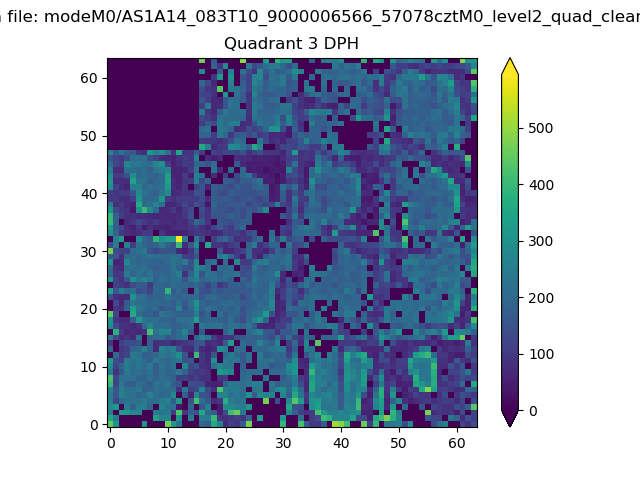 |
 |
Quadrant C |
| Plot type | Count rate plots | Images |
|---|---|---|
| Comparison with Poisson distribution Blue bars denote a histogram of data divided into 1 sec bins. Red curve is a Poisson curve with rate = median count rate of data. |
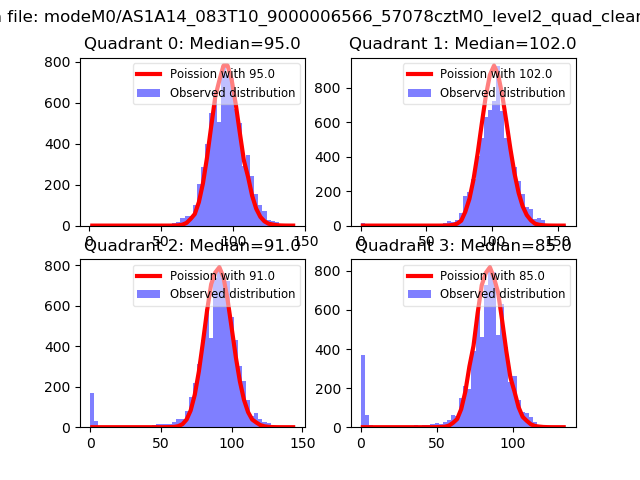 |
 |
| Quadrant-wise count rates Data is divided into 100 sec bins |
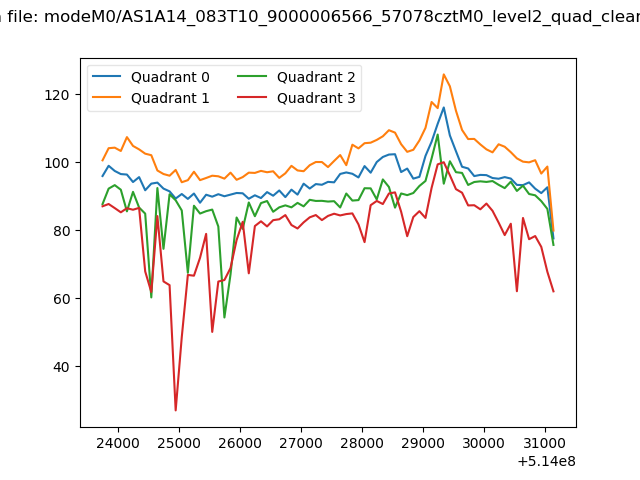 |
|
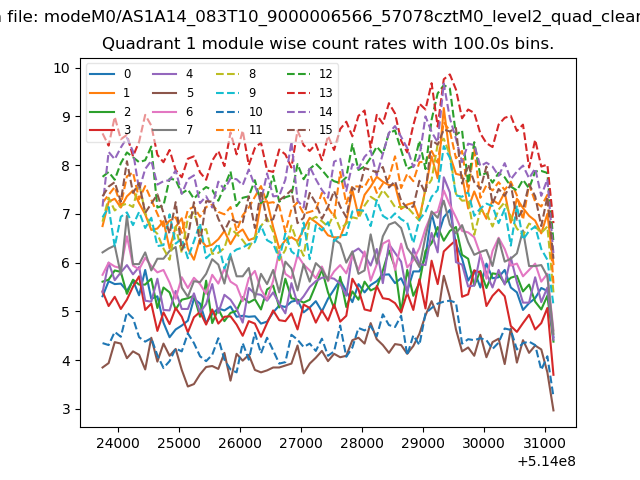
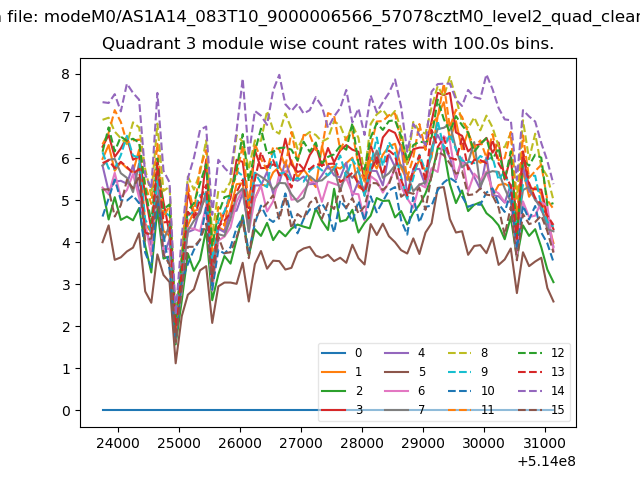
| Module-wise count rates for Quadrant A Data is divided into 100 sec bins |
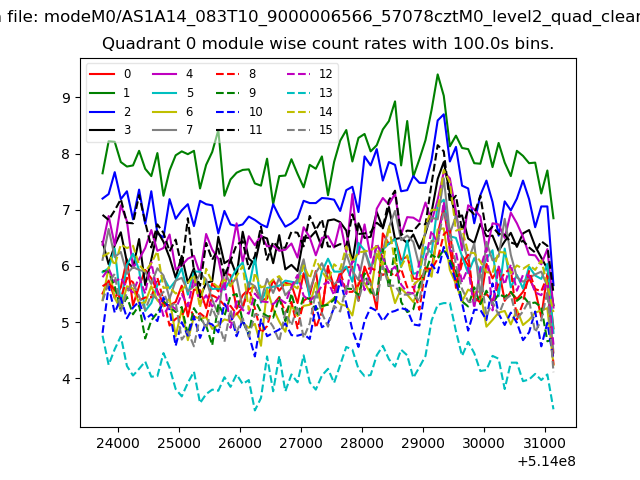 |
 |
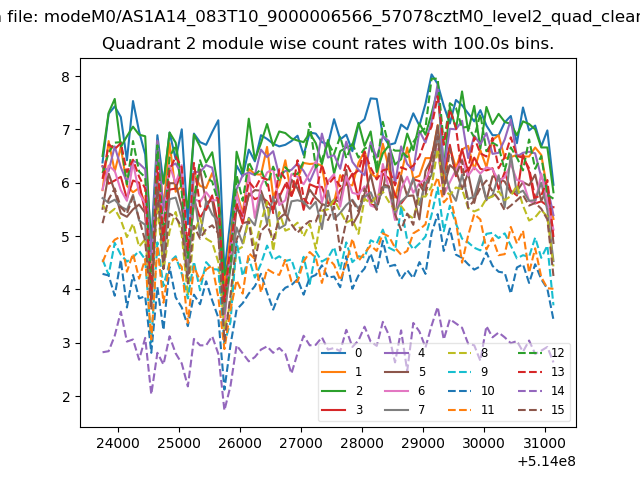
| Module-wise count rates for Quadrant B Data is divided into 100 sec bins |
 |
 |
| Module-wise count rates for Quadrant C Data is divided into 100 sec bins |
 |
 |
| Module-wise count rates for Quadrant D Data is divided into 100 sec bins |
 |
 |
| Parameter | Plot |
|---|---|
| CZT HV Monitor | 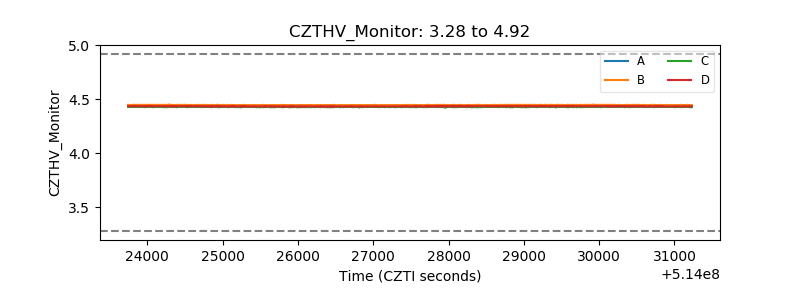 |
| D_VDD | 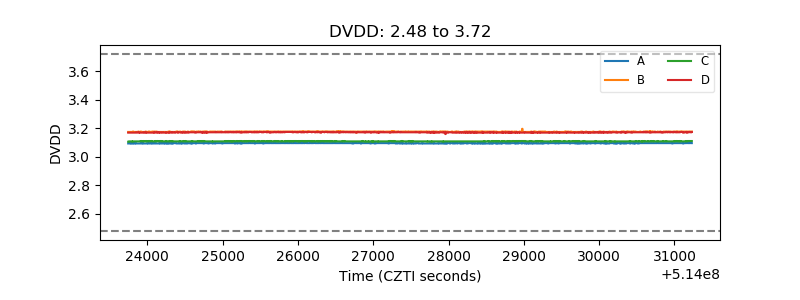 |
| Temperature 1 | 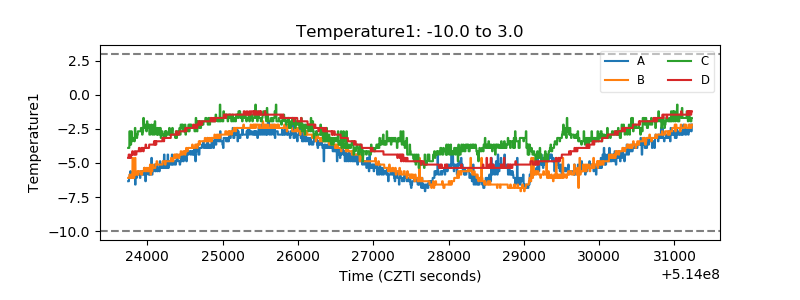 |
| Veto HV Monitor | 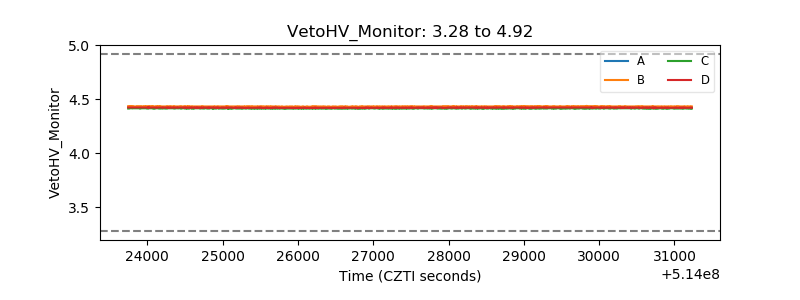 |
| Veto LLD | 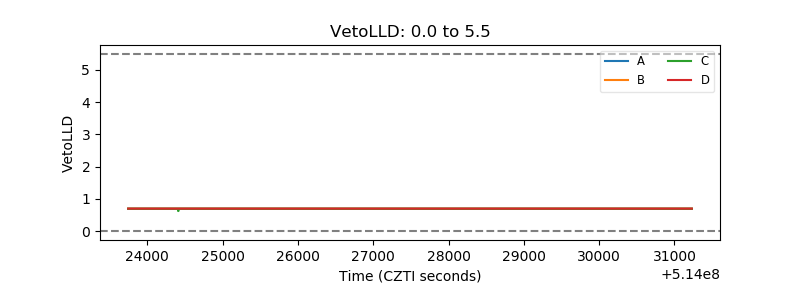 |
| Alpha Counter | 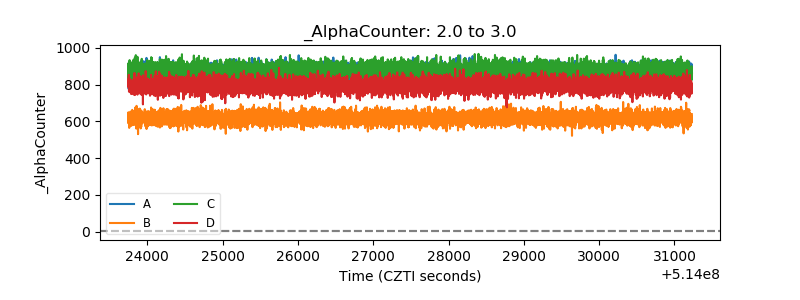 |
| _CPM_Rate | 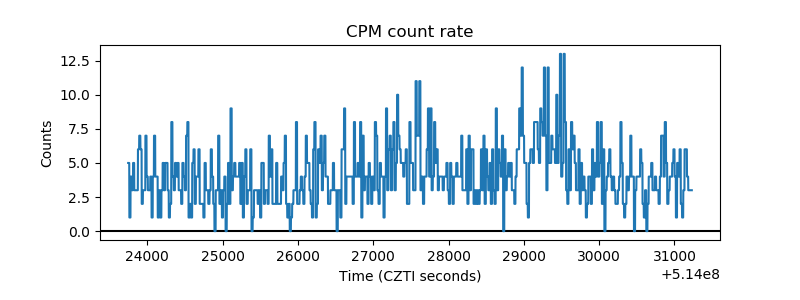 |
| CZT Counter | 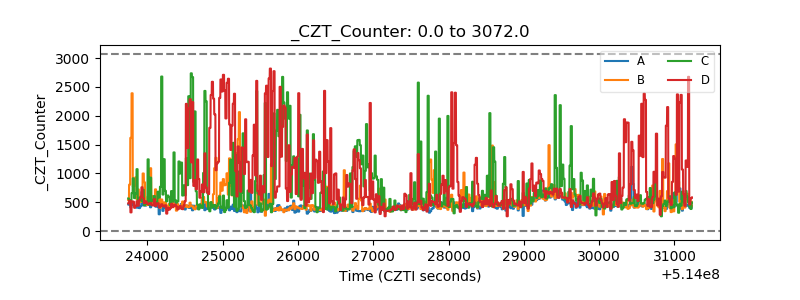 |
| +2.5 Volts monitor | 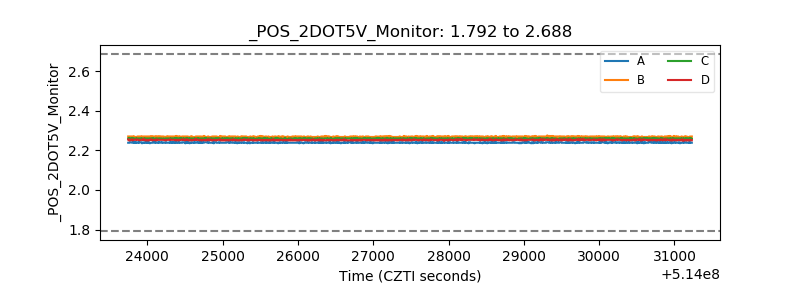 |
| +5 Volts monitor | 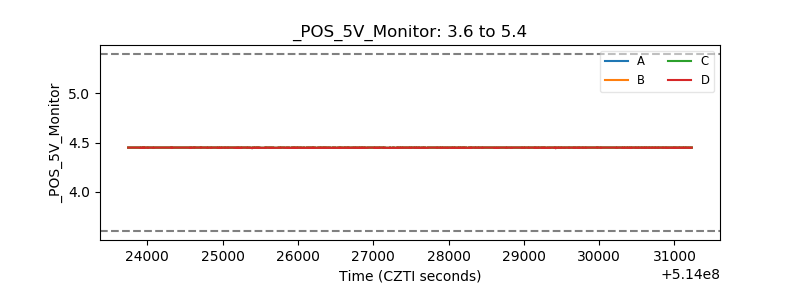 |
| _ROLL_ROT | 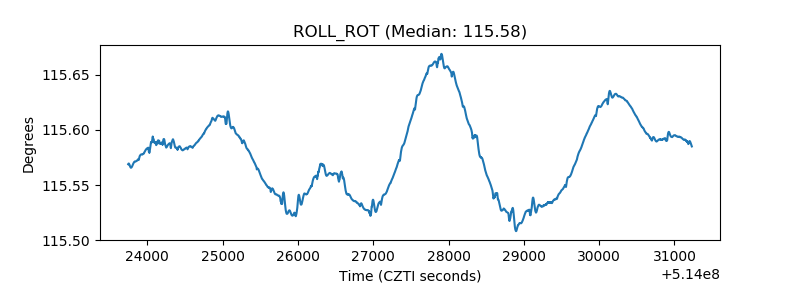 |
| _Roll_DEC | 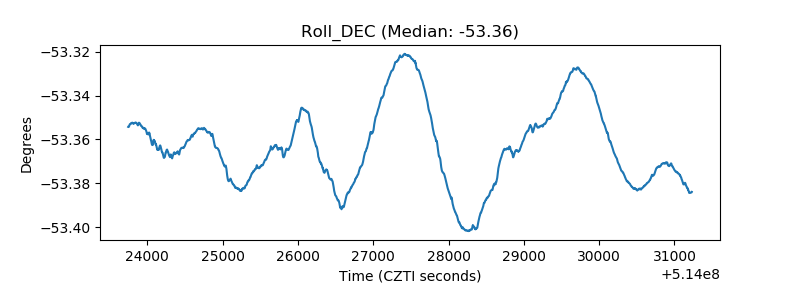 |
| _Roll_RA | 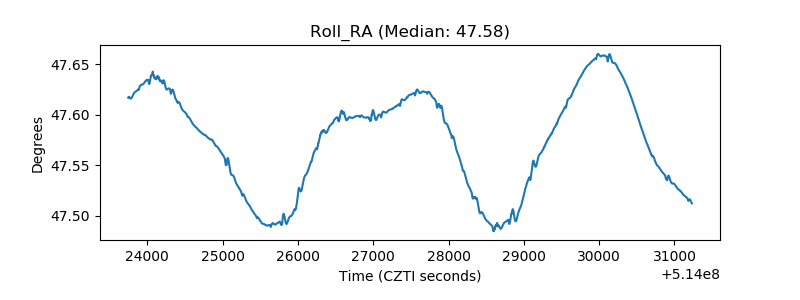 |
| Veto Counter | 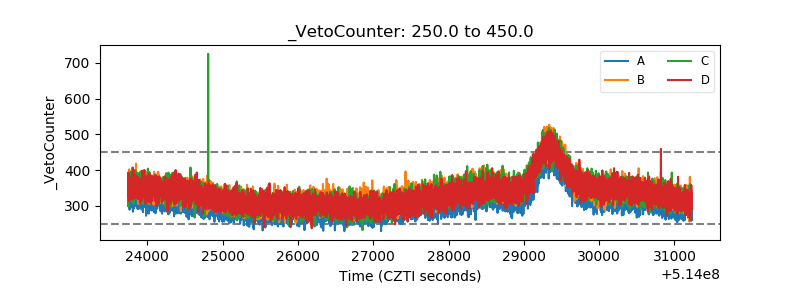 |