| Param | Original file | Final file |
|---|---|---|
| Filename | modeM0/AS1A14_083T10_9000006566_57079cztM0_level2.fits | modeM0/AS1A14_083T10_9000006566_57079cztM0_level2_quad_clean.evt |
| Size (bytes) | 593,271,360 | 96,612,480 |
| Size | 565.8 MB | 92.1 MB |
| Events in quadrant A | 3,372,596 | 668,005 |
| Events in quadrant B | 3,467,709 | 719,562 |
| Events in quadrant C | 4,707,737 | 618,811 |
| Events in quadrant D | 9,863,813 | 426,378 |
| Mode M0 | |||
|---|---|---|---|
| Quadrant | BADHDUFLAG | Total packets | Discarded packets |
| A | 0 | 15286 | 0 |
| B | 0 | 15372 | 0 |
| C | 0 | 18809 | 0 |
| D | 0 | 34265 | 0 |
| Mode SS | |||
|---|---|---|---|
| Quadrant | BADHDUFLAG | Total packets | Discarded packets |
| A | 0 | 142 | 0 |
| B | 0 | 142 | 0 |
| C | 0 | 142 | 0 |
| D | 0 | 142 | 0 |
| Quadrant | Total seconds | Saturated seconds | Saturation percentage |
|---|---|---|---|
| A | 7066 | 48 | 0.679309% |
| B | 7067 | 46 | 0.650913% |
| C | 7067 | 394 | 5.575209% |
| D | 7067 | 2429 | 34.371020% |
Noise dominated data is calculated using 1-second bins in cleaned event files. If a bin has >2000 counts, and if more than 50% of those come from <1% of pixels, then it is considered to be noise-dominated and hence unusable.
| Quadrant | # 1 sec bins | Bins with >0 counts | Bins with >2000 counts | High rate bins dominated by noise | Noise dominated (total time) | Noise dominated (detector-on time) | Marked lightcurve |
|---|---|---|---|---|---|---|---|
| A | 7065 | 7065 | 31 | 31 | 0.44% | 0.44% | 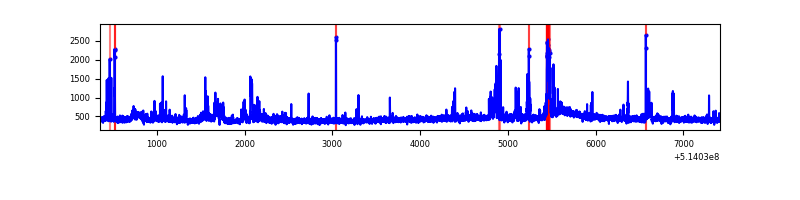 |
| B | 7067 | 7067 | 33 | 33 | 0.47% | 0.47% | 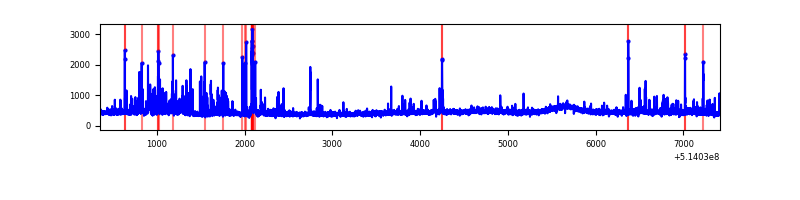 |
| C | 7067 | 7067 | 512 | 512 | 7.24% | 7.24% | 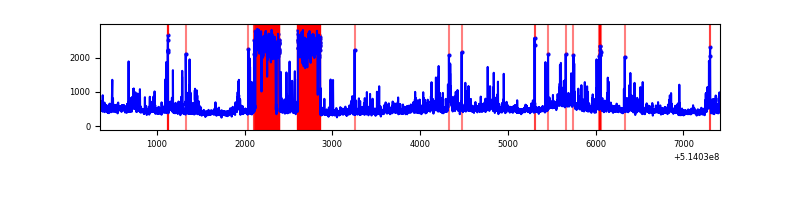 |
| D | 7067 | 7067 | 1750 | 1750 | 24.76% | 24.76% | 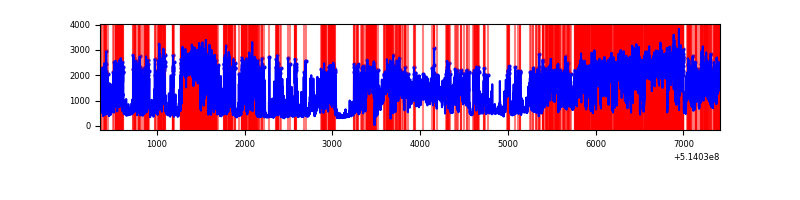 |
Top three noisy pixels from each quadrant. If the there are fewer than three noisy pixels in the level2.evt file, extra rows are filled as -1
| Pixel properties | Quadrant properties | ||||||
|---|---|---|---|---|---|---|---|
| Quadrant | DetID | PixID | Counts | Sigma | Mean | Median | Sigma |
| A | 4 | 13 | 182527 | 969.83 | 762 | 741 | 187.4 |
| A | 3 | 14 | 154031 | 817.8 | 762 | 741 | 187.4 |
| A | 13 | 248 | 40296 | 211.03 | 762 | 741 | 187.4 |
| B | 4 | 171 | 381891 | 2351.87 | 750 | 721 | 162.1 |
| B | 0 | 213 | 32182 | 194.12 | 750 | 721 | 162.1 |
| B | 0 | 173 | 26307 | 157.87 | 750 | 721 | 162.1 |
| C | 1 | 16 | 1055271 | 5299.43 | 732 | 725 | 199.0 |
| C | 12 | 252 | 203597 | 1019.5 | 732 | 725 | 199.0 |
| C | 14 | 245 | 173657 | 869.04 | 732 | 725 | 199.0 |
| D | 12 | 33 | 6347824 | 35555.18 | 626 | 597 | 178.5 |
| D | 15 | 142 | 522360 | 2922.75 | 626 | 597 | 178.5 |
| D | 2 | 249 | 264717 | 1479.52 | 626 | 597 | 178.5 |
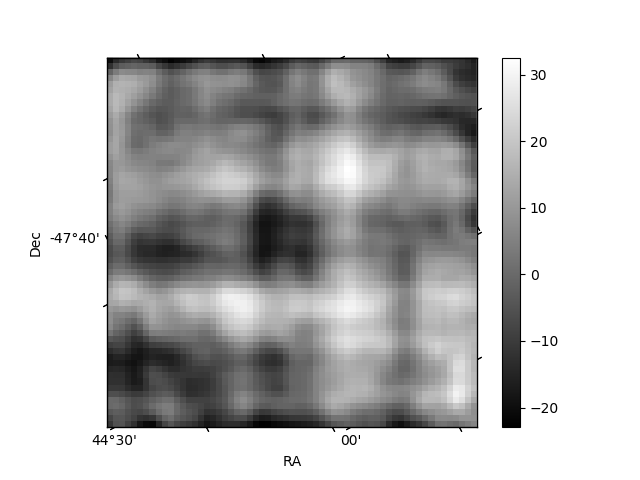
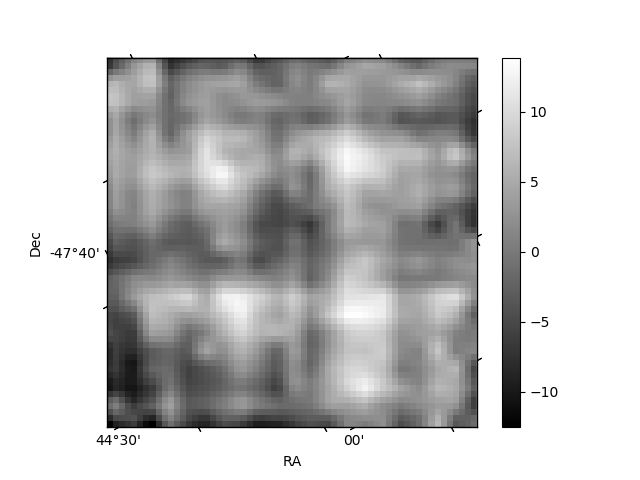
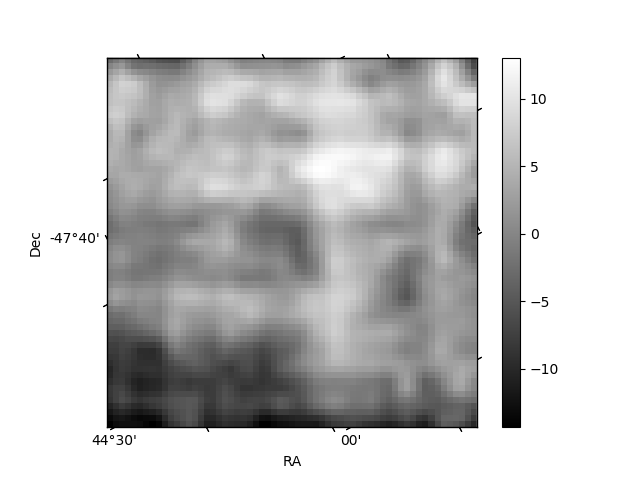
Histogram calculated using DETX and DETY for each event in the final _common_clean file
| Quadrant A | 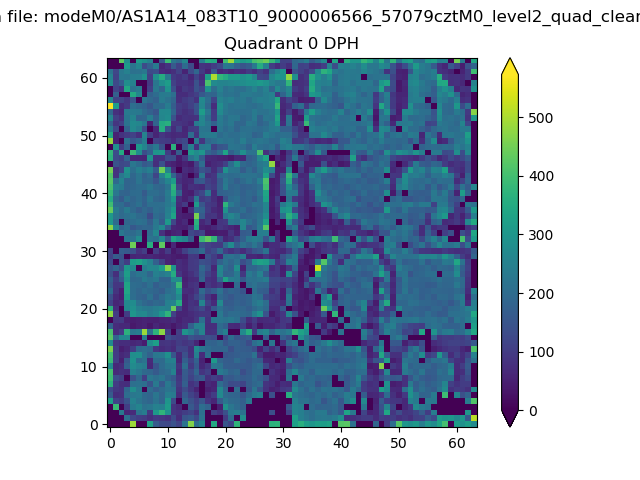 |
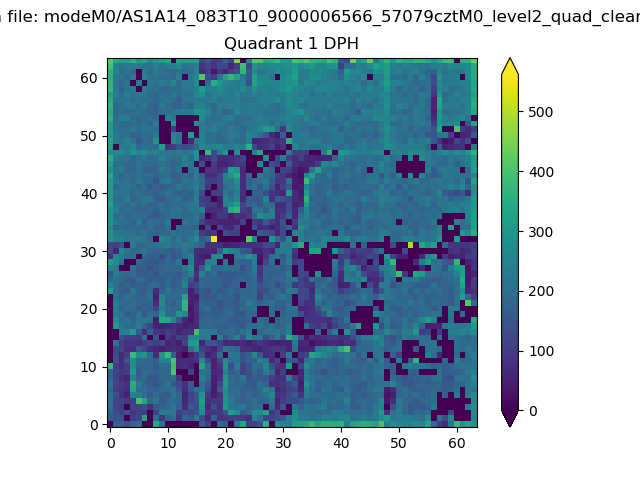 |
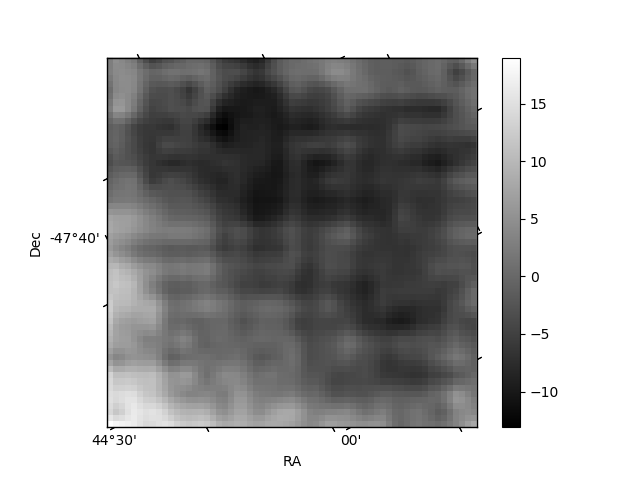
Quadrant B |
|---|---|---|---|
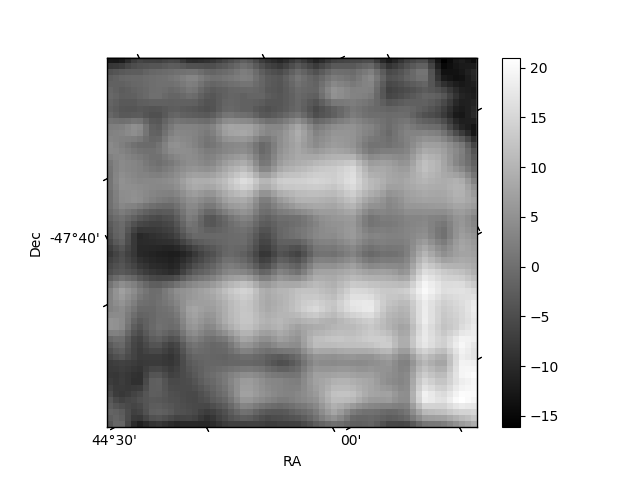
| Quadrant D | 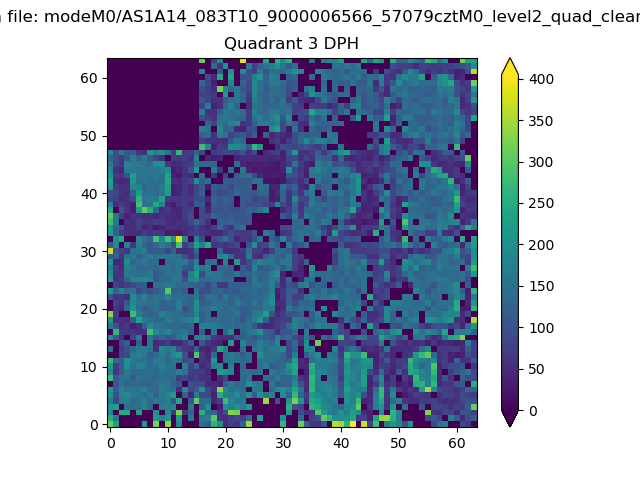 |
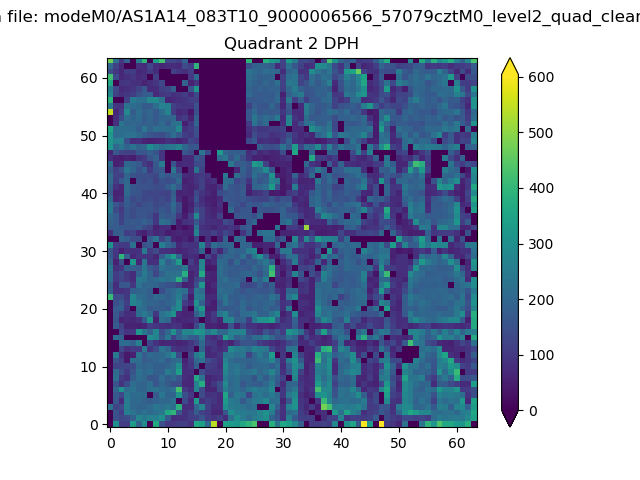 |
Quadrant C |
| Plot type | Count rate plots | Images |
|---|---|---|
| Comparison with Poisson distribution Blue bars denote a histogram of data divided into 1 sec bins. Red curve is a Poisson curve with rate = median count rate of data. |
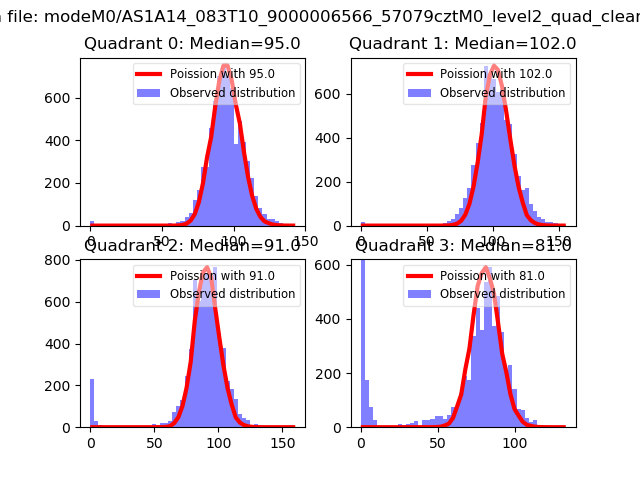 |
 |
| Quadrant-wise count rates Data is divided into 100 sec bins |
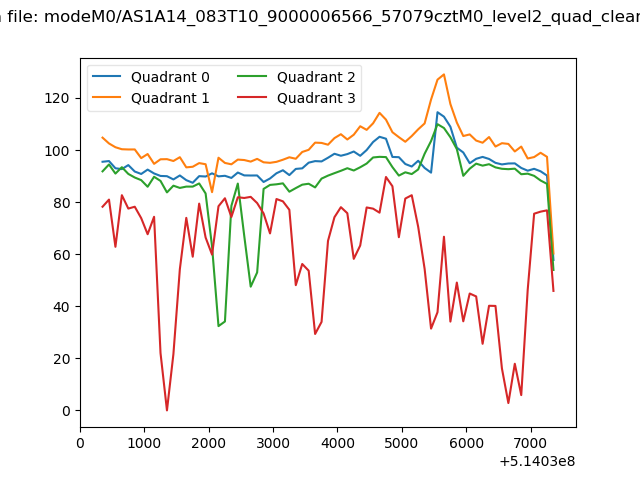 |
|
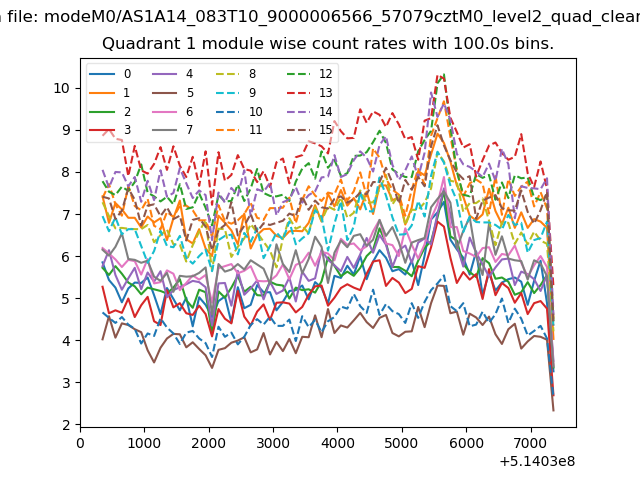
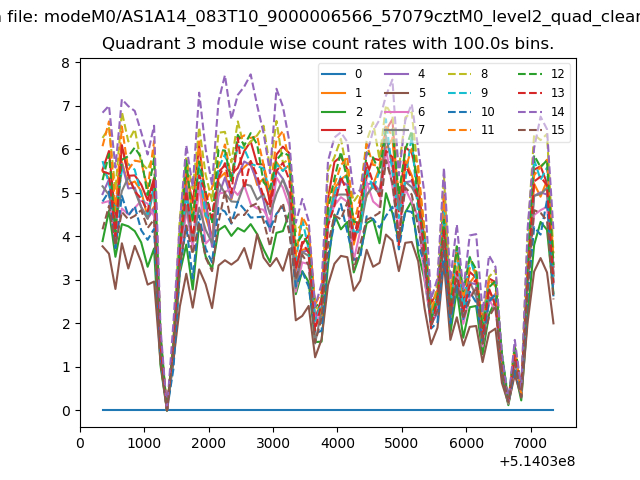
| Module-wise count rates for Quadrant A Data is divided into 100 sec bins |
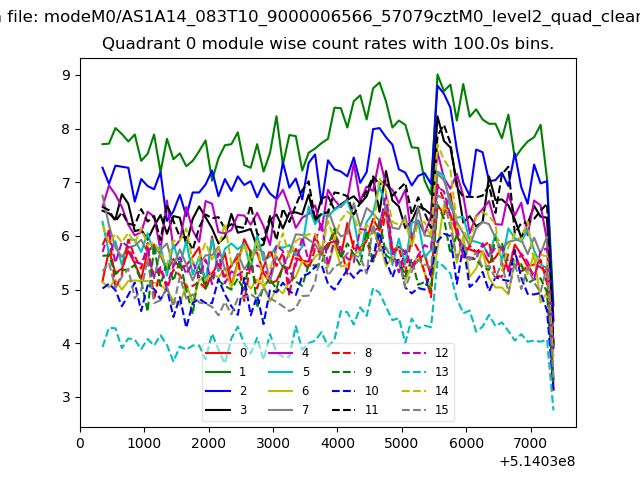 |
 |
| Module-wise count rates for Quadrant B Data is divided into 100 sec bins |
 |
 |
| Module-wise count rates for Quadrant C Data is divided into 100 sec bins |
 |
 |
| Module-wise count rates for Quadrant D Data is divided into 100 sec bins |
 |
 |
| Parameter | Plot |
|---|---|
| CZT HV Monitor | 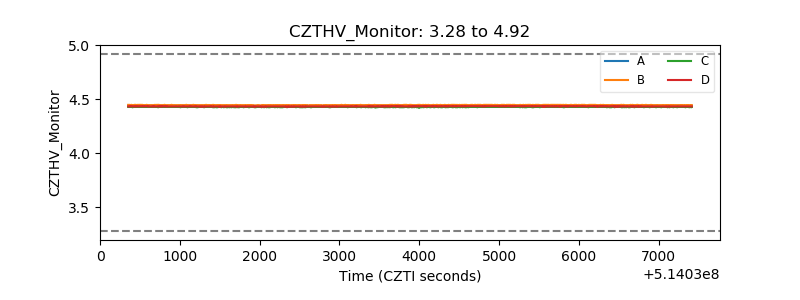 |
| D_VDD | 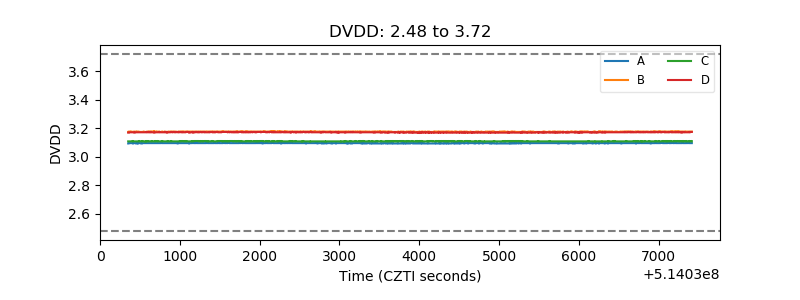 |
| Temperature 1 | 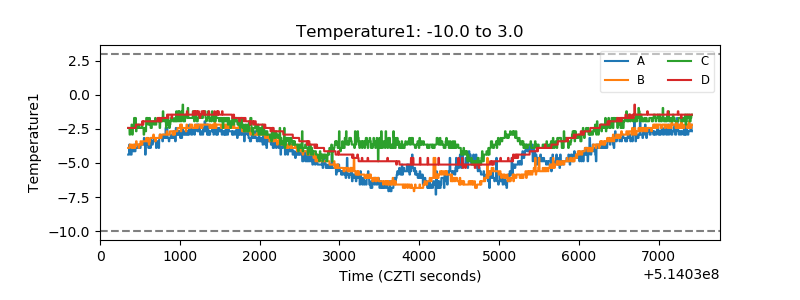 |
| Veto HV Monitor | 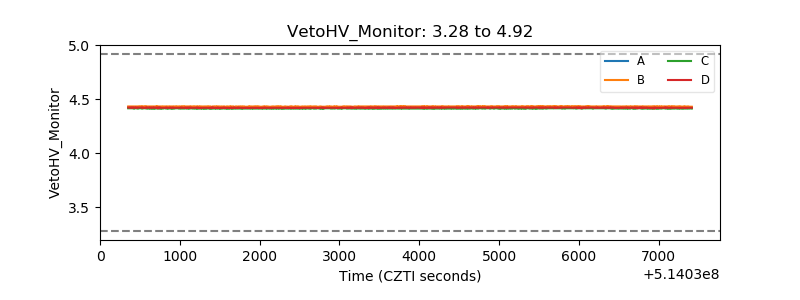 |
| Veto LLD | 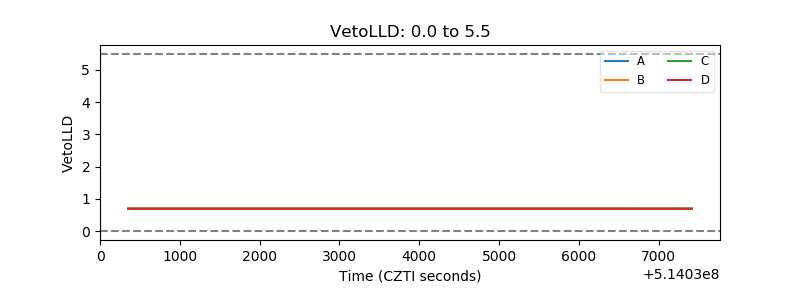 |
| Alpha Counter | 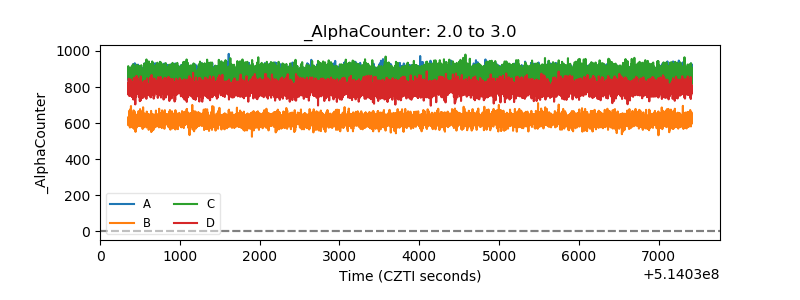 |
| _CPM_Rate | 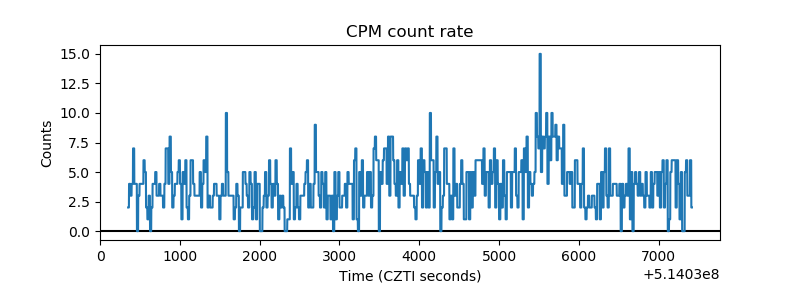 |
| CZT Counter | 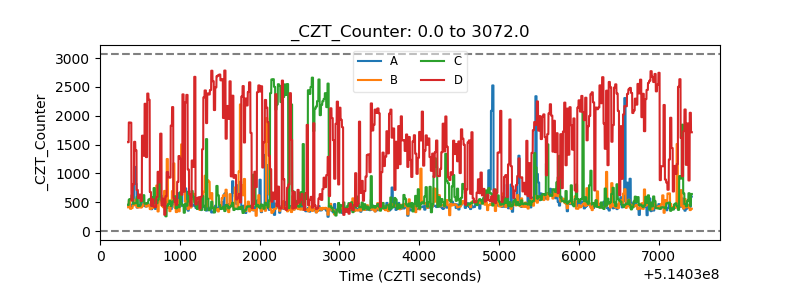 |
| +2.5 Volts monitor |  |
| +5 Volts monitor |  |
| _ROLL_ROT | 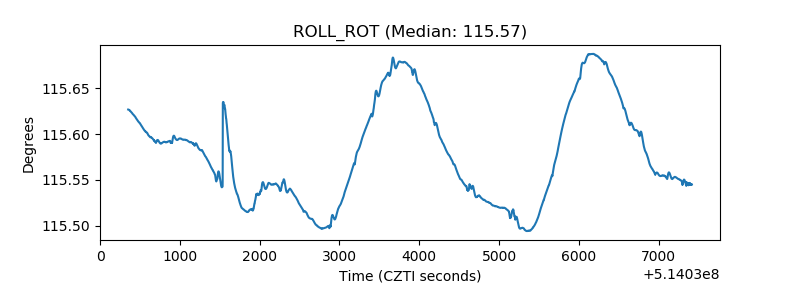 |
| _Roll_DEC | 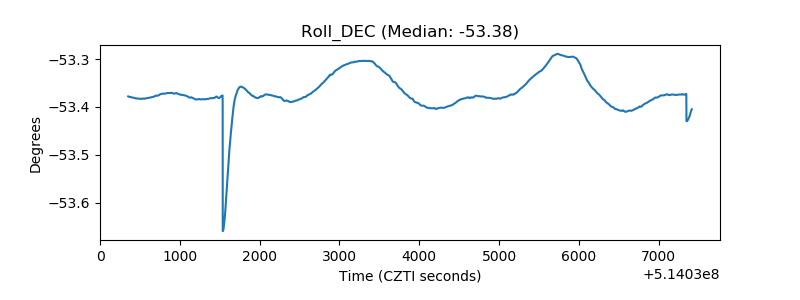 |
| _Roll_RA | 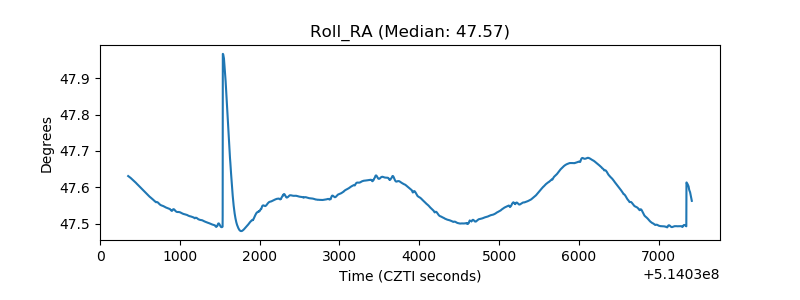 |
| Veto Counter | 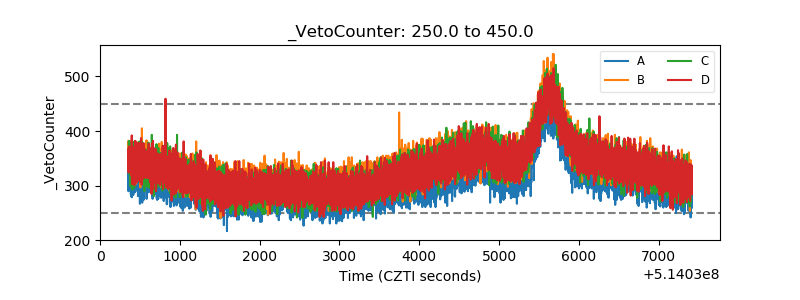 |