| Param | Original file | Final file |
|---|---|---|
| Filename | modeM0/AS1A14_083T10_9000006566_57082cztM0_level2.fits | modeM0/AS1A14_083T10_9000006566_57082cztM0_level2_quad_clean.evt |
| Size (bytes) | 1,641,781,440 | 255,945,600 |
| Size | 1.5 GB | 244.1 MB |
| Events in quadrant A | 8,795,470 | 1,764,633 |
| Events in quadrant B | 10,220,942 | 1,846,833 |
| Events in quadrant C | 12,974,237 | 1,668,681 |
| Events in quadrant D | 27,316,185 | 1,160,046 |
| Mode M9 | |||
|---|---|---|---|
| Quadrant | BADHDUFLAG | Total packets | Discarded packets |
| A | 0 | 12 | 0 |
| B | 0 | 12 | 0 |
| C | 0 | 12 | 0 |
| D | 0 | 12 | 0 |
| Mode M0 | |||
|---|---|---|---|
| Quadrant | BADHDUFLAG | Total packets | Discarded packets |
| A | 0 | 40590 | 4 |
| B | 0 | 43828 | 3 |
| C | 0 | 52121 | 3 |
| D | 0 | 94455 | 3 |
| Mode SS | |||
|---|---|---|---|
| Quadrant | BADHDUFLAG | Total packets | Discarded packets |
| A | 0 | 386 | 0 |
| B | 0 | 386 | 0 |
| C | 0 | 386 | 0 |
| D | 0 | 386 | 0 |
| Quadrant | Total seconds | Saturated seconds | Saturation percentage |
|---|---|---|---|
| A | 18987 | 259 | 1.364091% |
| B | 18988 | 656 | 3.454814% |
| C | 18988 | 376 | 1.980198% |
| D | 18988 | 5427 | 28.581209% |
Noise dominated data is calculated using 1-second bins in cleaned event files. If a bin has >2000 counts, and if more than 50% of those come from <1% of pixels, then it is considered to be noise-dominated and hence unusable.
| Quadrant | # 1 sec bins | Bins with >0 counts | Bins with >2000 counts | High rate bins dominated by noise | Noise dominated (total time) | Noise dominated (detector-on time) | Marked lightcurve |
|---|---|---|---|---|---|---|---|
| A | 20152 | 18990 | 123 | 123 | 0.61% | 0.65% | 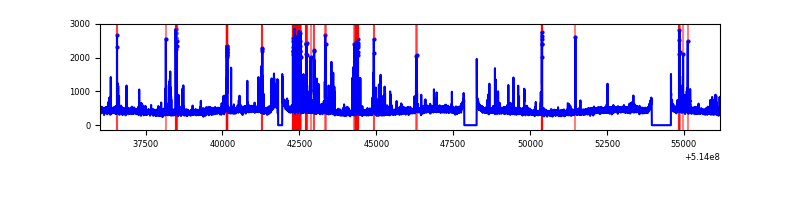 |
| B | 20153 | 18991 | 311 | 311 | 1.54% | 1.64% | 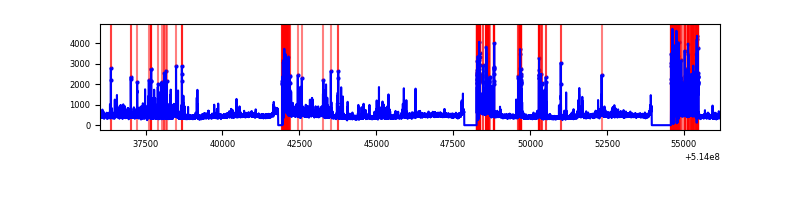 |
| C | 20153 | 18991 | 239 | 239 | 1.19% | 1.26% | 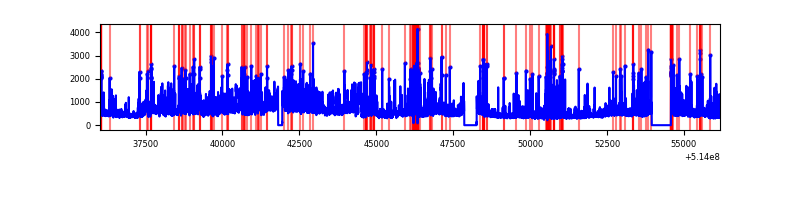 |
| D | 20153 | 18991 | 5687 | 5687 | 28.22% | 29.95% | 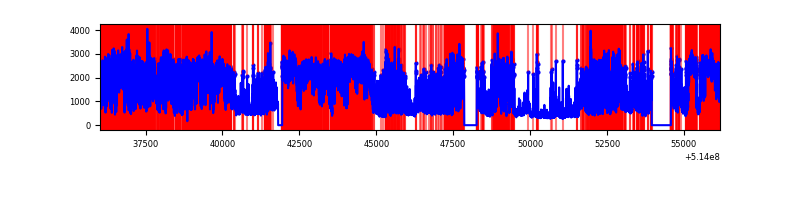 |
Top three noisy pixels from each quadrant. If the there are fewer than three noisy pixels in the level2.evt file, extra rows are filled as -1
| Pixel properties | Quadrant properties | ||||||
|---|---|---|---|---|---|---|---|
| Quadrant | DetID | PixID | Counts | Sigma | Mean | Median | Sigma |
| A | 4 | 13 | 629339 | 1247.95 | 2042 | 1985 | 502.7 |
| A | 13 | 248 | 143607 | 281.72 | 2042 | 1985 | 502.7 |
| A | 4 | 3 | 41242 | 78.09 | 2042 | 1985 | 502.7 |
| B | 10 | 16 | 1287926 | 3022.13 | 1978 | 1902 | 425.5 |
| B | 4 | 171 | 346324 | 809.39 | 1978 | 1902 | 425.5 |
| B | 10 | 32 | 246179 | 574.05 | 1978 | 1902 | 425.5 |
| C | 1 | 16 | 2959321 | 5526.6 | 1969 | 1953 | 535.1 |
| C | 14 | 245 | 1058267 | 1973.99 | 1969 | 1953 | 535.1 |
| C | 6 | 223 | 531769 | 990.1 | 1969 | 1953 | 535.1 |
| D | 15 | 142 | 9942487 | 19865.36 | 1774 | 1696 | 500.4 |
| D | 12 | 33 | 8497622 | 16977.99 | 1774 | 1696 | 500.4 |
| D | 2 | 249 | 669310 | 1334.14 | 1774 | 1696 | 500.4 |
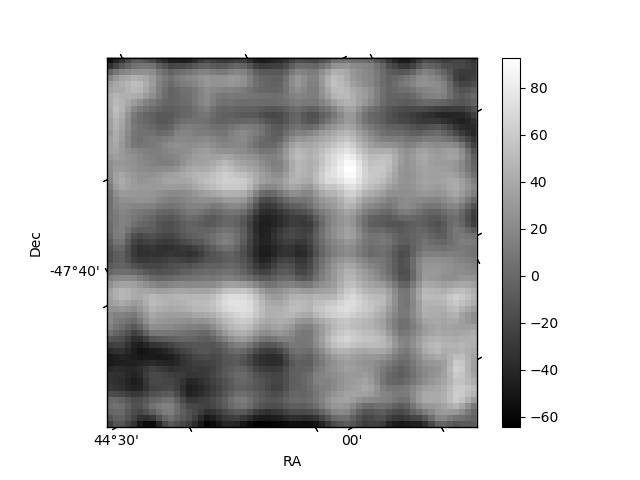
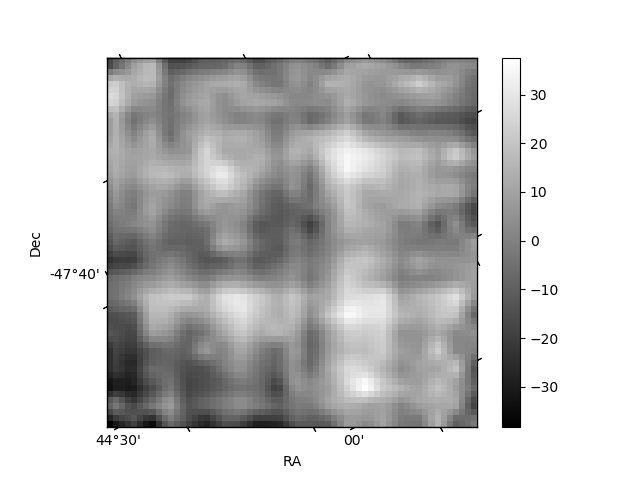
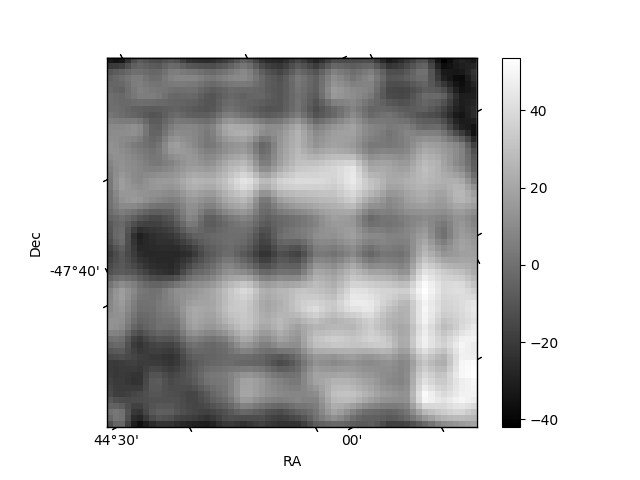
Histogram calculated using DETX and DETY for each event in the final _common_clean file
| Quadrant A | 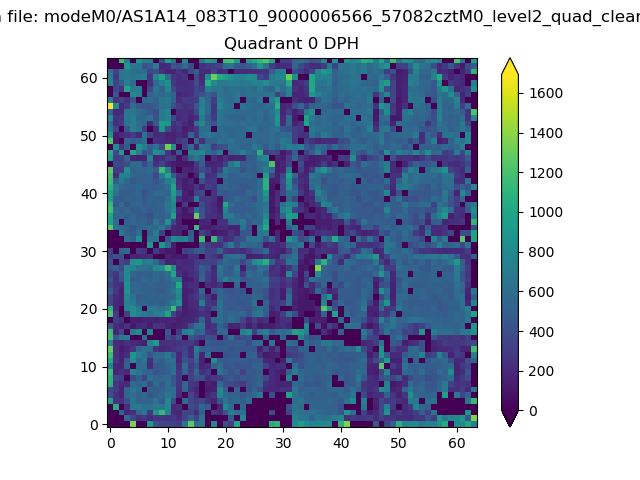 |
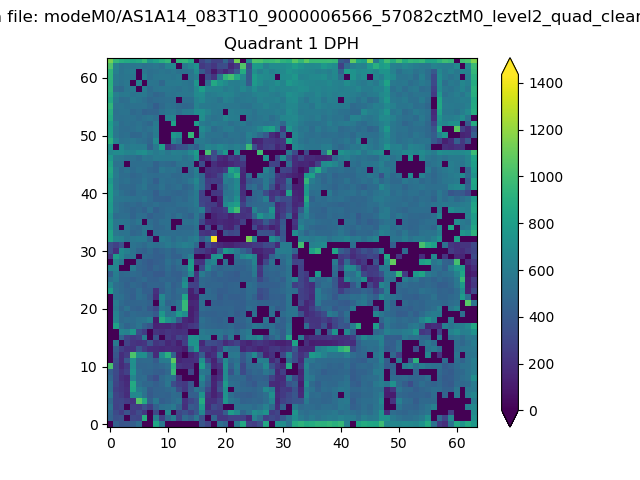 |
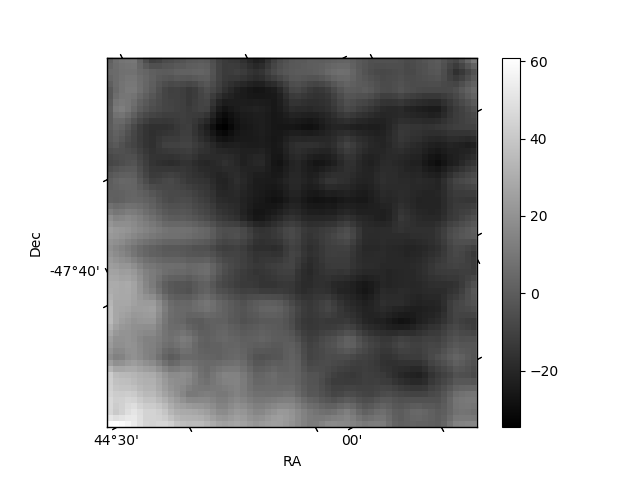
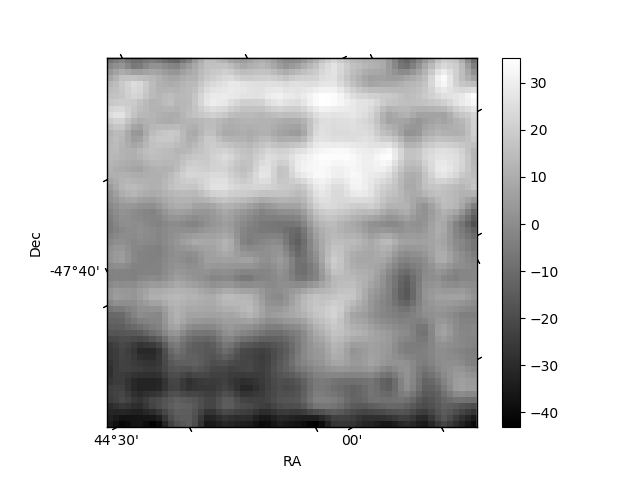
Quadrant B |
|---|---|---|---|
| Quadrant D | 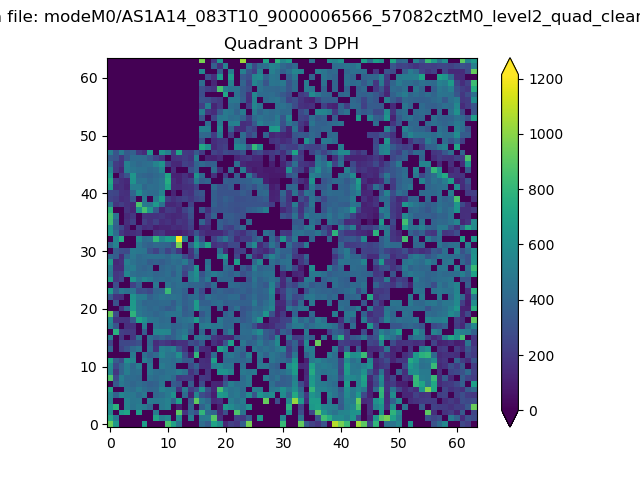 |
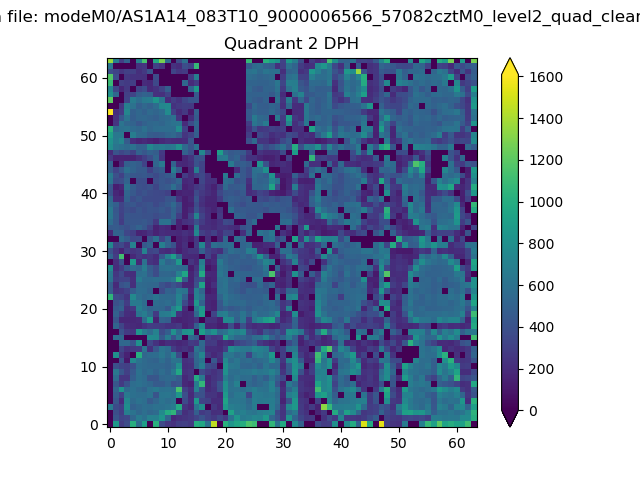 |
Quadrant C |
| Plot type | Count rate plots | Images |
|---|---|---|
| Comparison with Poisson distribution Blue bars denote a histogram of data divided into 1 sec bins. Red curve is a Poisson curve with rate = median count rate of data. |
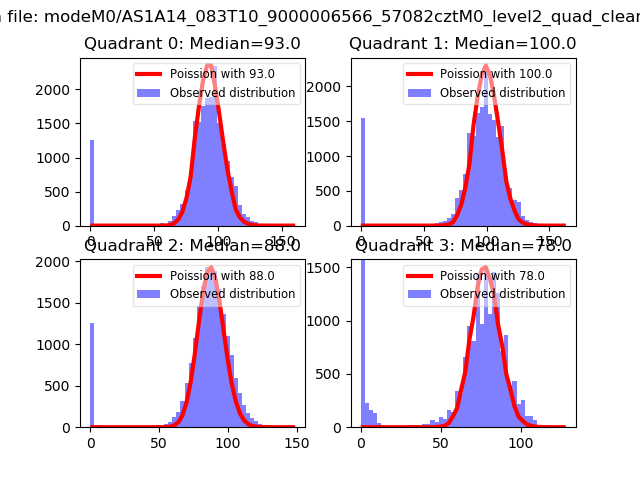 |
 |
| Quadrant-wise count rates Data is divided into 100 sec bins |
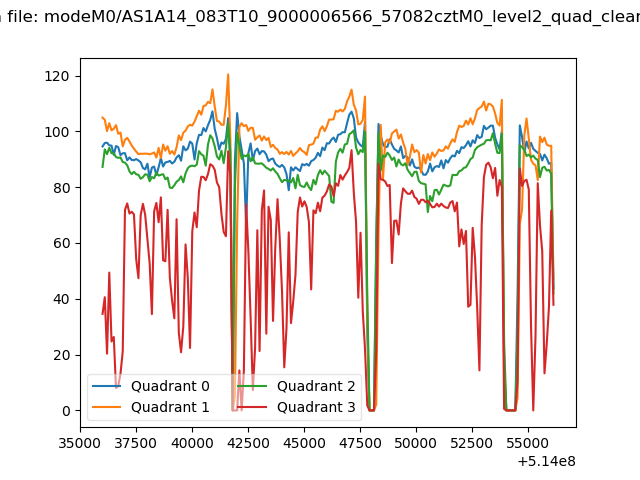 |
|
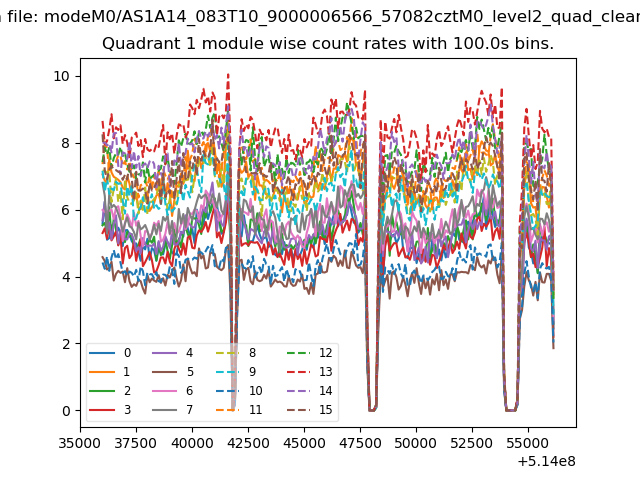
| Module-wise count rates for Quadrant A Data is divided into 100 sec bins |
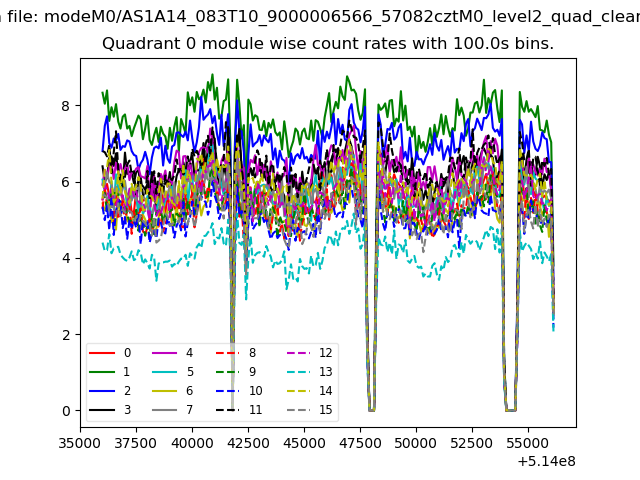 |
 |
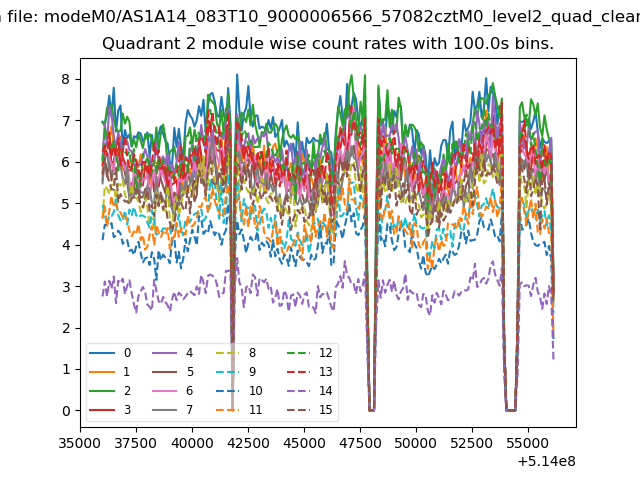
| Module-wise count rates for Quadrant B Data is divided into 100 sec bins |
 |
 |
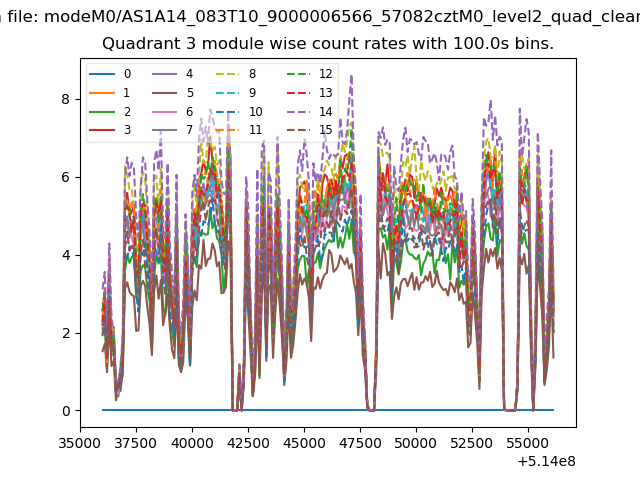
| Module-wise count rates for Quadrant C Data is divided into 100 sec bins |
 |
 |
| Module-wise count rates for Quadrant D Data is divided into 100 sec bins |
 |
 |
| Parameter | Plot |
|---|---|
| CZT HV Monitor | 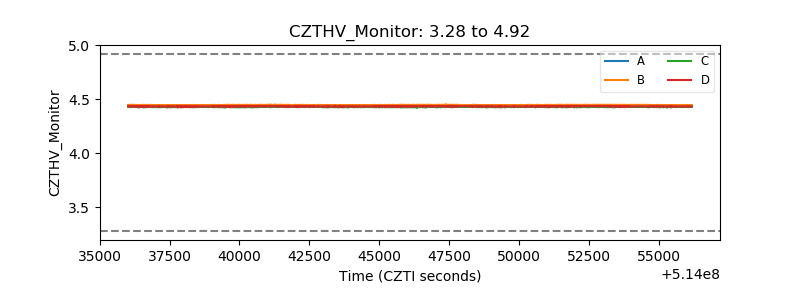 |
| D_VDD | 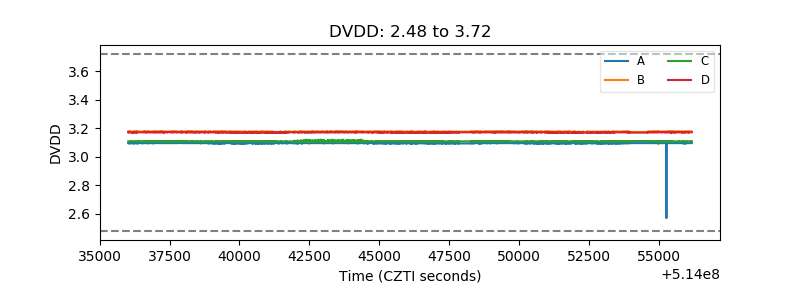 |
| Temperature 1 | 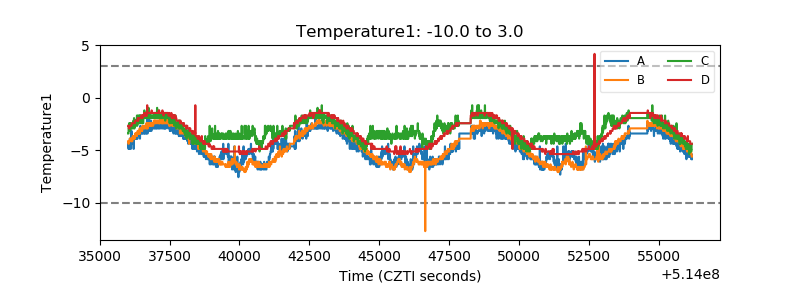 |
| Veto HV Monitor | 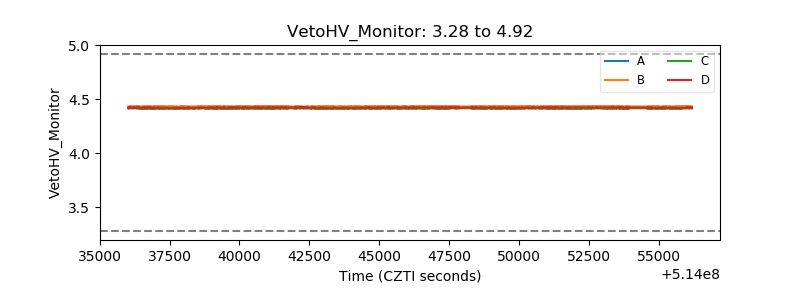 |
| Veto LLD | 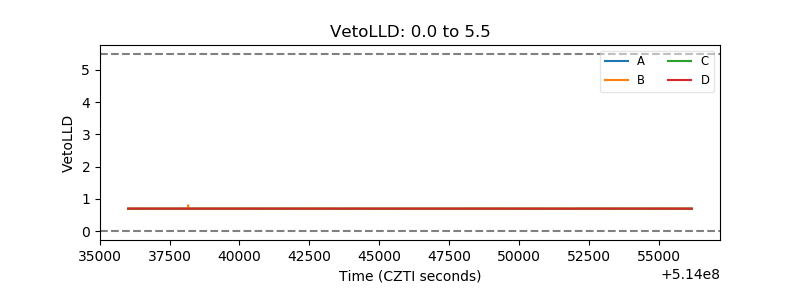 |
| Alpha Counter | 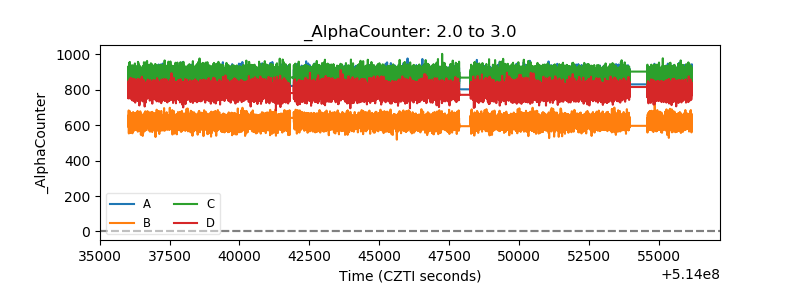 |
| _CPM_Rate | 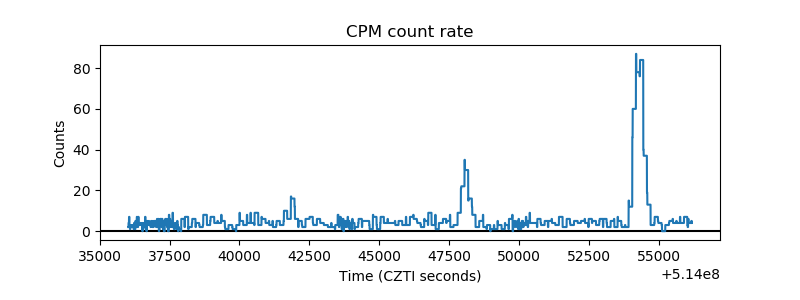 |
| CZT Counter | 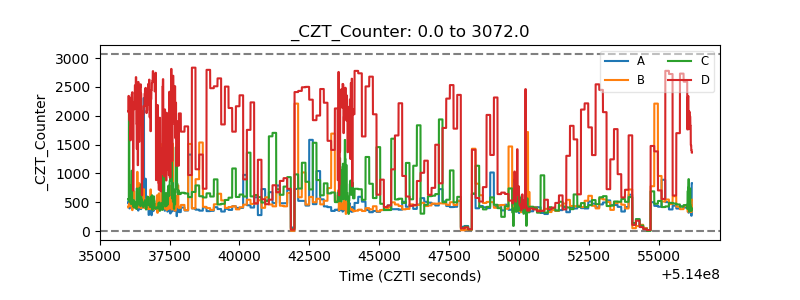 |
| +2.5 Volts monitor |  |
| +5 Volts monitor |  |
| _ROLL_ROT | 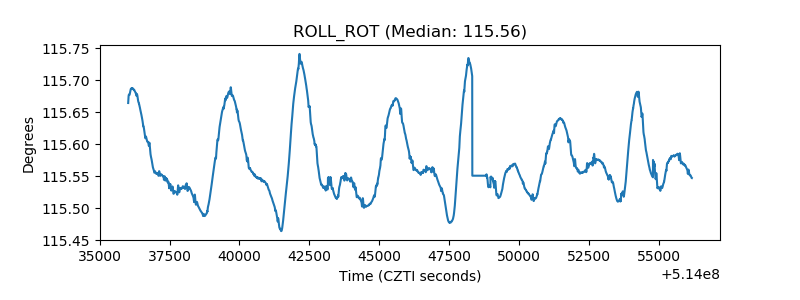 |
| _Roll_DEC | 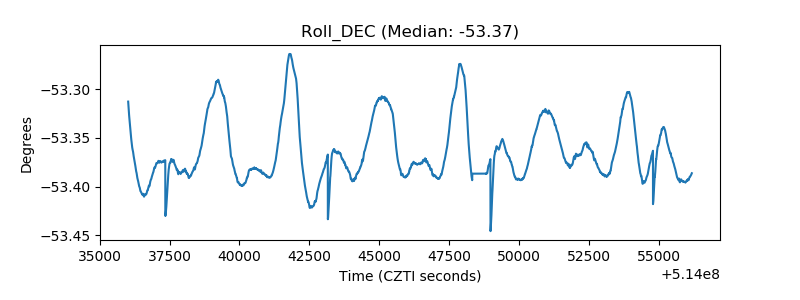 |
| _Roll_RA | 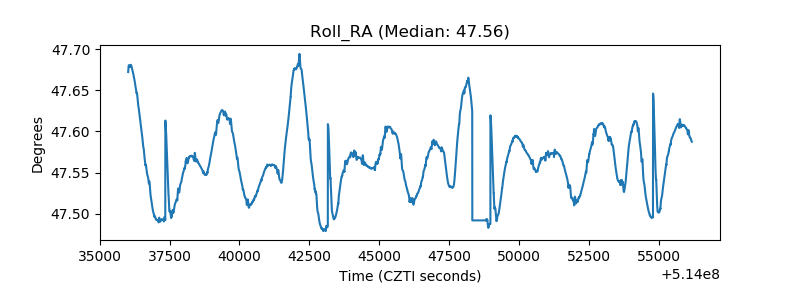 |
| Veto Counter | 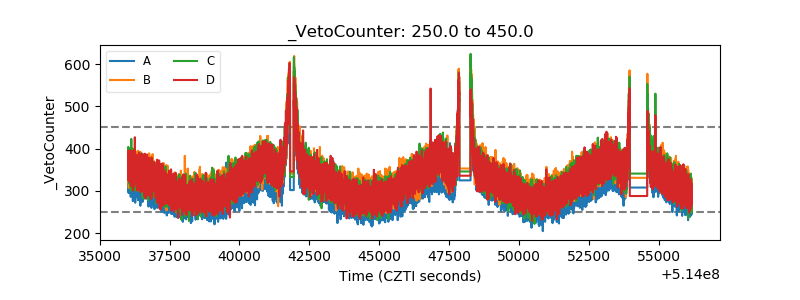 |