| Param | Original file | Final file |
|---|---|---|
| Filename | modeM0/AS1A14_083T10_9000006566_57085cztM0_level2.fits | modeM0/AS1A14_083T10_9000006566_57085cztM0_level2_quad_clean.evt |
| Size (bytes) | 601,220,160 | 82,054,080 |
| Size | 573.4 MB | 78.3 MB |
| Events in quadrant A | 3,008,535 | 600,056 |
| Events in quadrant B | 3,292,122 | 632,450 |
| Events in quadrant C | 2,866,266 | 571,271 |
| Events in quadrant D | 12,595,073 | 237,674 |
| Mode M9 | |||
|---|---|---|---|
| Quadrant | BADHDUFLAG | Total packets | Discarded packets |
| A | 0 | 9 | 0 |
| B | 0 | 9 | 0 |
| C | 0 | 9 | 0 |
| D | 0 | 9 | 0 |
| Mode M0 | |||
|---|---|---|---|
| Quadrant | BADHDUFLAG | Total packets | Discarded packets |
| A | 0 | 13563 | 1 |
| B | 0 | 14255 | 1 |
| C | 0 | 13359 | 1 |
| D | 0 | 41817 | 1 |
| Mode SS | |||
|---|---|---|---|
| Quadrant | BADHDUFLAG | Total packets | Discarded packets |
| A | 0 | 130 | 0 |
| B | 0 | 130 | 0 |
| C | 0 | 130 | 0 |
| D | 0 | 130 | 0 |
| Quadrant | Total seconds | Saturated seconds | Saturation percentage |
|---|---|---|---|
| A | 6342 | 70 | 1.103753% |
| B | 6342 | 206 | 3.248187% |
| C | 6342 | 34 | 0.536108% |
| D | 6342 | 3709 | 58.483128% |
Noise dominated data is calculated using 1-second bins in cleaned event files. If a bin has >2000 counts, and if more than 50% of those come from <1% of pixels, then it is considered to be noise-dominated and hence unusable.
| Quadrant | # 1 sec bins | Bins with >0 counts | Bins with >2000 counts | High rate bins dominated by noise | Noise dominated (total time) | Noise dominated (detector-on time) | Marked lightcurve |
|---|---|---|---|---|---|---|---|
| A | 7282 | 6343 | 24 | 24 | 0.33% | 0.38% | 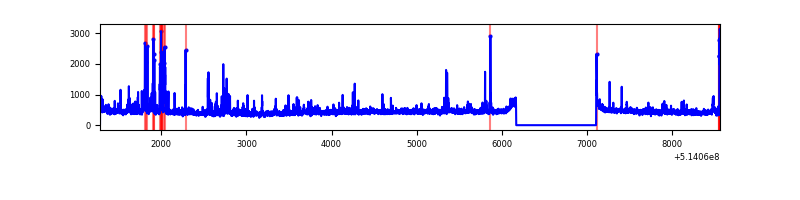 |
| B | 7282 | 6343 | 80 | 80 | 1.10% | 1.26% | 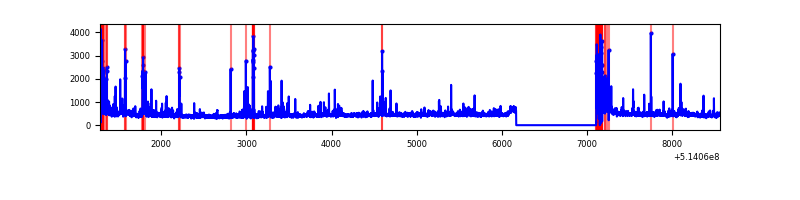 |
| C | 7282 | 6343 | 14 | 14 | 0.19% | 0.22% | 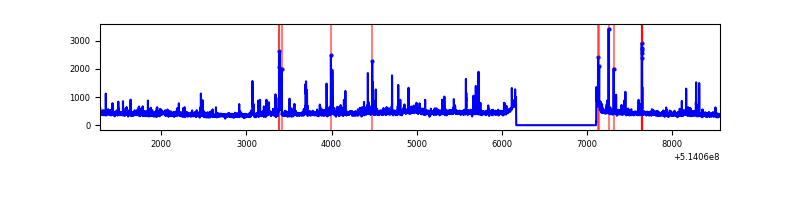 |
| D | 7282 | 6343 | 3685 | 3685 | 50.60% | 58.10% | 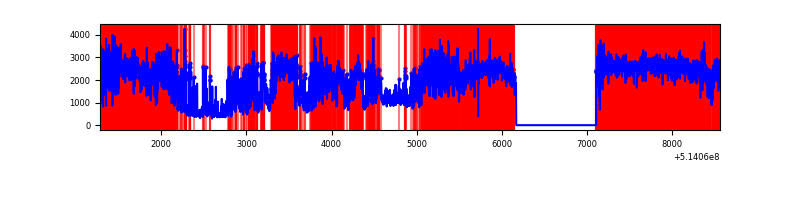 |
Top three noisy pixels from each quadrant. If the there are fewer than three noisy pixels in the level2.evt file, extra rows are filled as -1
| Pixel properties | Quadrant properties | ||||||
|---|---|---|---|---|---|---|---|
| Quadrant | DetID | PixID | Counts | Sigma | Mean | Median | Sigma |
| A | 10 | 251 | 192583 | 1141.84 | 675 | 657 | 168.1 |
| A | 4 | 249 | 80966 | 477.79 | 675 | 657 | 168.1 |
| A | 3 | 14 | 60186 | 354.16 | 675 | 657 | 168.1 |
| B | 10 | 16 | 393031 | 2751.76 | 659 | 634 | 142.6 |
| B | 4 | 171 | 156130 | 1090.45 | 659 | 634 | 142.6 |
| B | 0 | 63 | 36689 | 252.84 | 659 | 634 | 142.6 |
| C | 14 | 254 | 98483 | 549.82 | 653 | 647 | 177.9 |
| C | 6 | 223 | 60657 | 337.24 | 653 | 647 | 177.9 |
| C | 1 | 16 | 32491 | 178.96 | 653 | 647 | 177.9 |
| D | 15 | 142 | 7409916 | 55030.9 | 471 | 450 | 134.6 |
| D | 12 | 33 | 2675661 | 19869.08 | 471 | 450 | 134.6 |
| D | 2 | 249 | 390670 | 2898.21 | 471 | 450 | 134.6 |
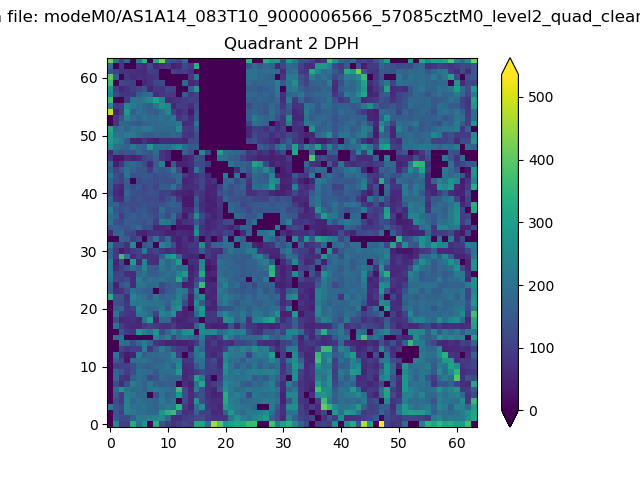
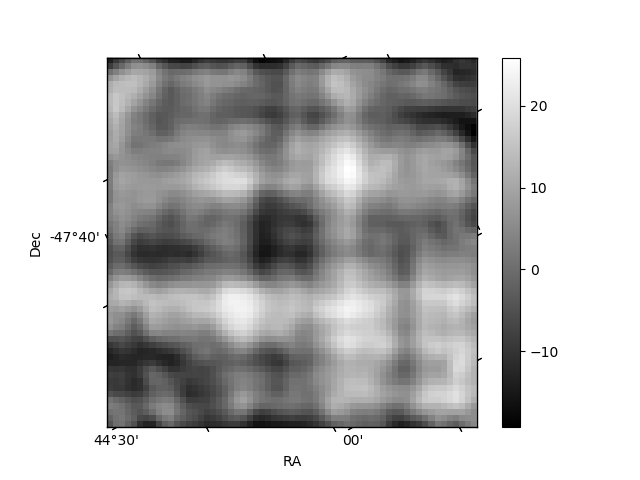
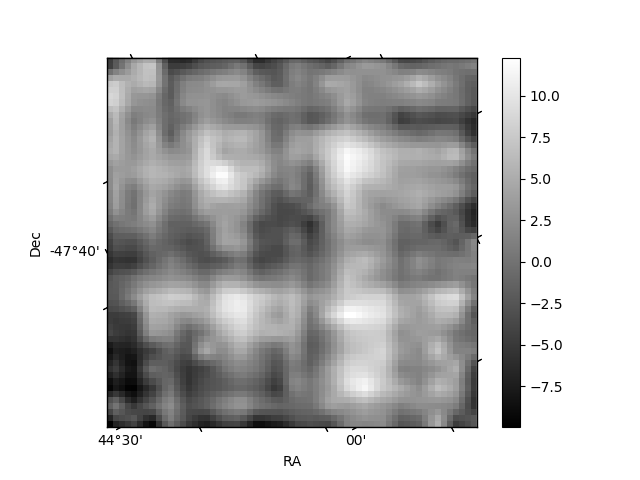
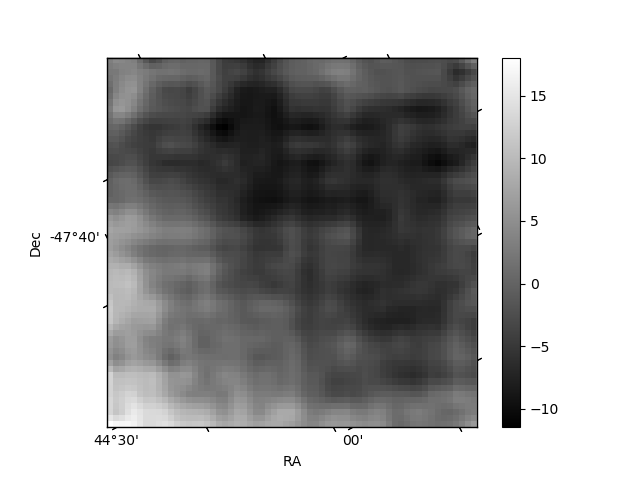
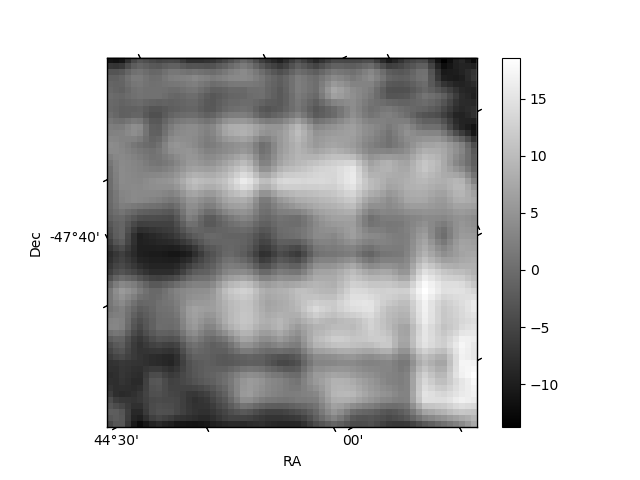
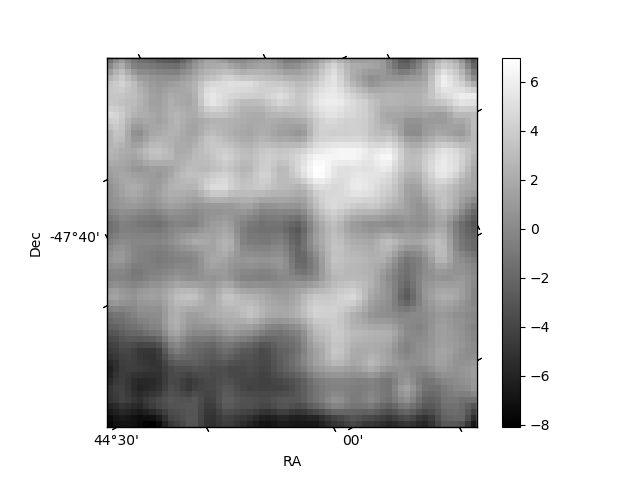
Histogram calculated using DETX and DETY for each event in the final _common_clean file
| Quadrant A | 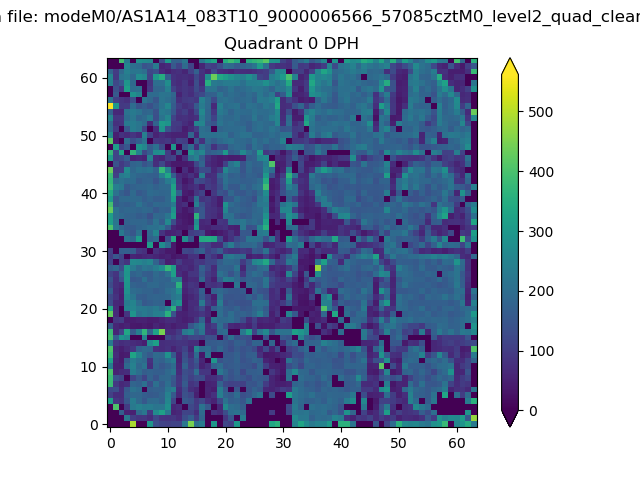 |
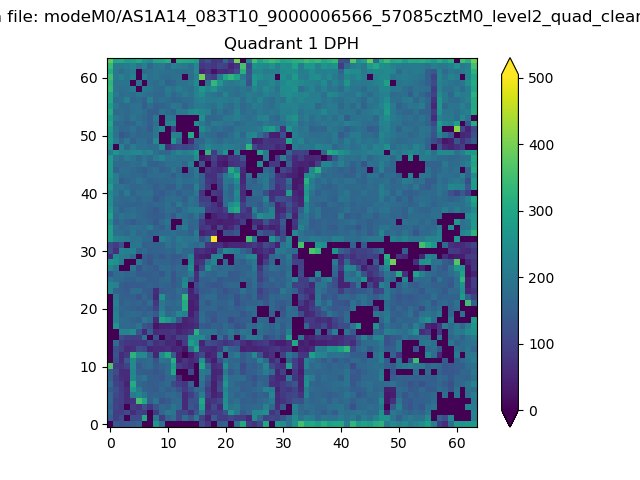 |
Quadrant B |
|---|---|---|---|
| Quadrant D | 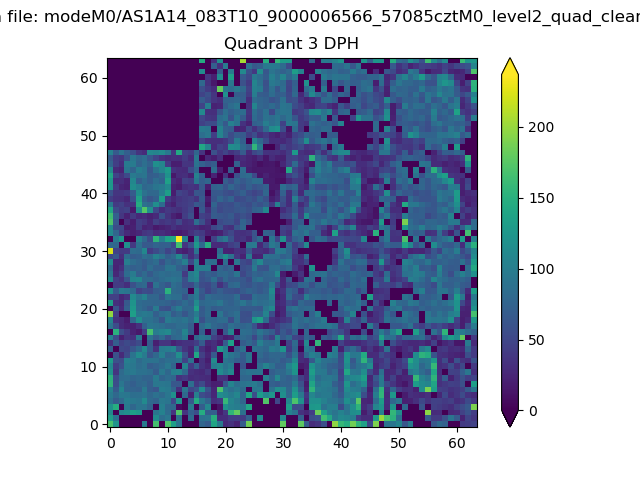 |
 |
Quadrant C |
| Plot type | Count rate plots | Images |
|---|---|---|
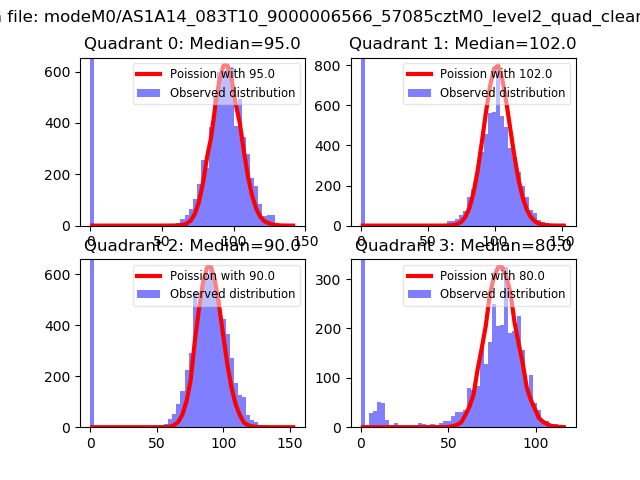
| Comparison with Poisson distribution Blue bars denote a histogram of data divided into 1 sec bins. Red curve is a Poisson curve with rate = median count rate of data. |
 |
 |
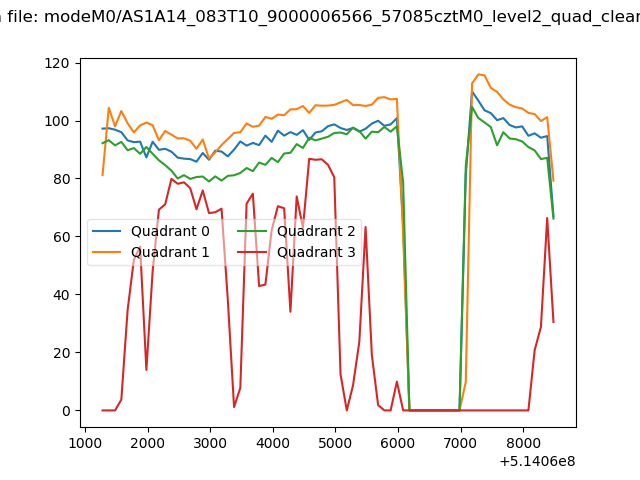
| Quadrant-wise count rates Data is divided into 100 sec bins |
 |
|
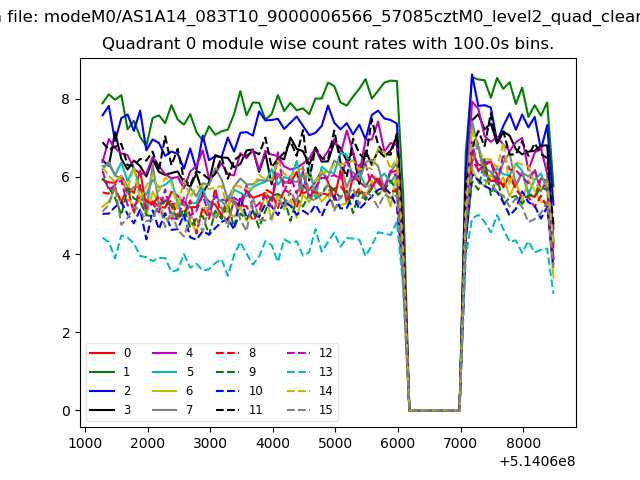
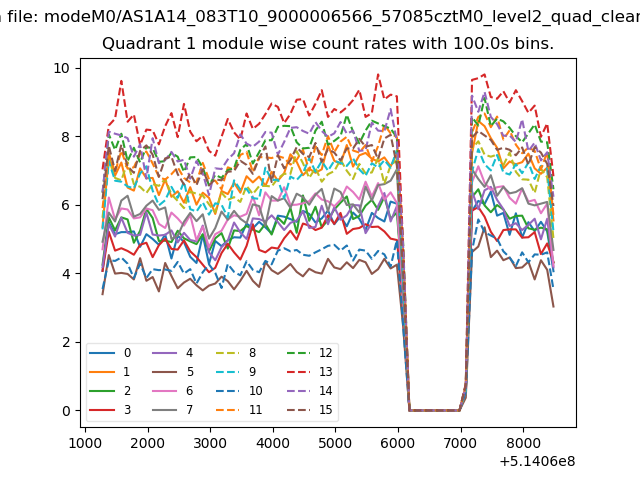
| Module-wise count rates for Quadrant A Data is divided into 100 sec bins |
 |
 |
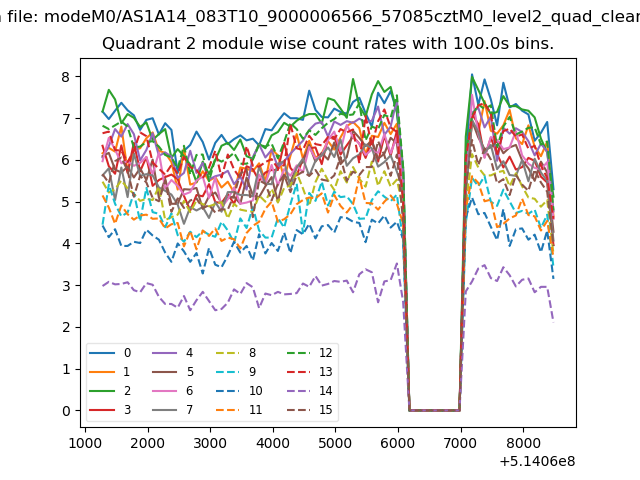
| Module-wise count rates for Quadrant B Data is divided into 100 sec bins |
 |
 |
| Module-wise count rates for Quadrant C Data is divided into 100 sec bins |
 |
 |
| Module-wise count rates for Quadrant D Data is divided into 100 sec bins |
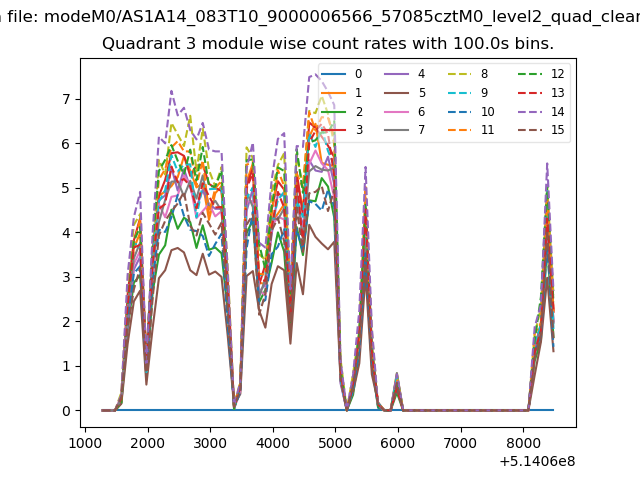 |
 |
| Parameter | Plot |
|---|---|
| CZT HV Monitor | 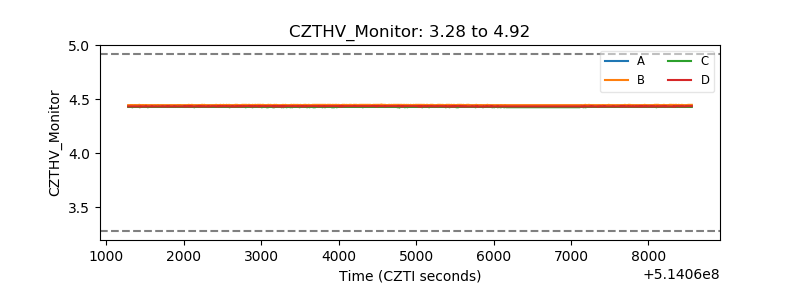 |
| D_VDD | 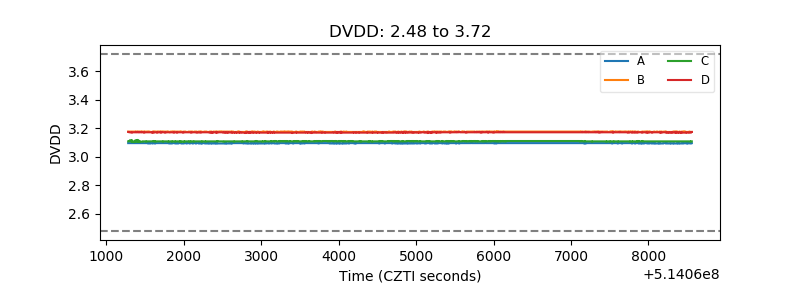 |
| Temperature 1 | 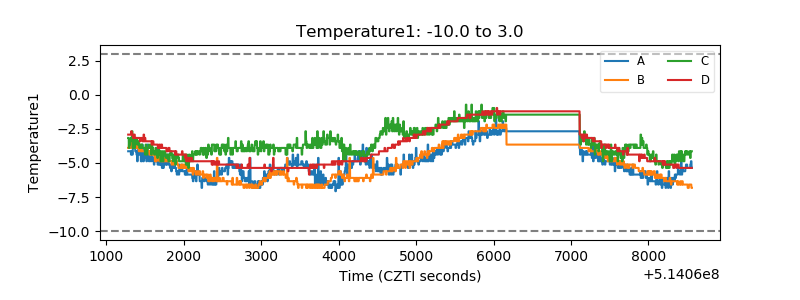 |
| Veto HV Monitor | 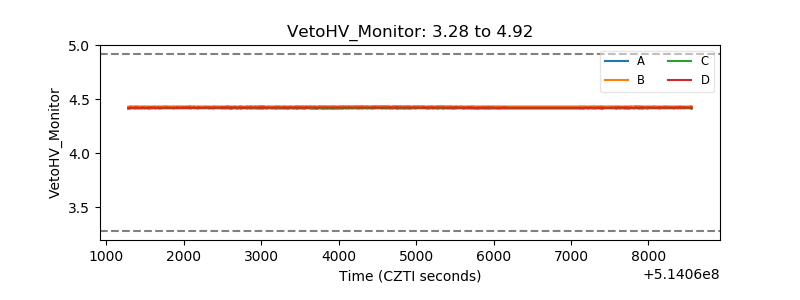 |
| Veto LLD | 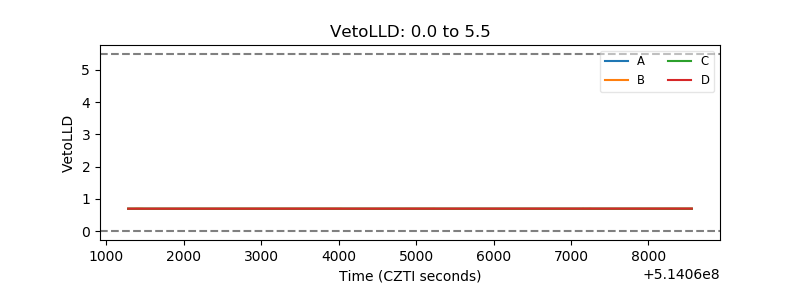 |
| Alpha Counter | 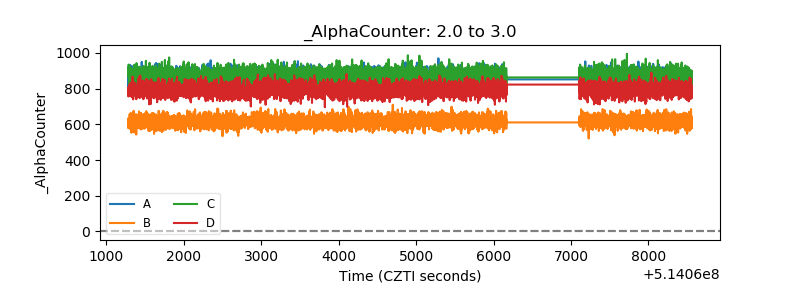 |
| _CPM_Rate | 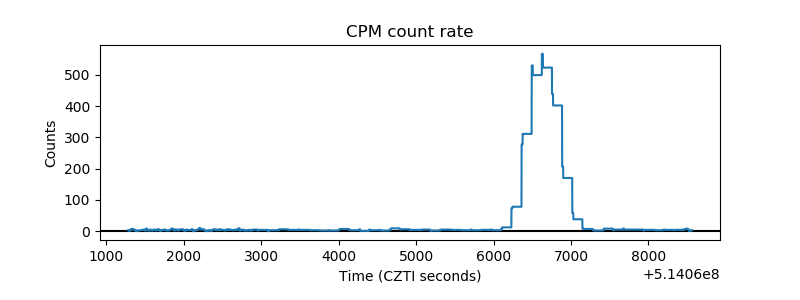 |
| CZT Counter | 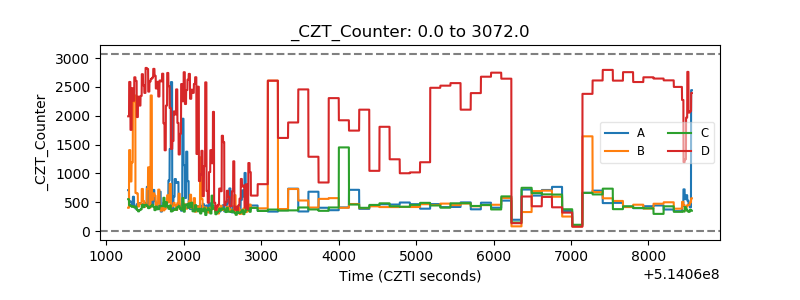 |
| +2.5 Volts monitor |  |
| +5 Volts monitor |  |
| _ROLL_ROT | 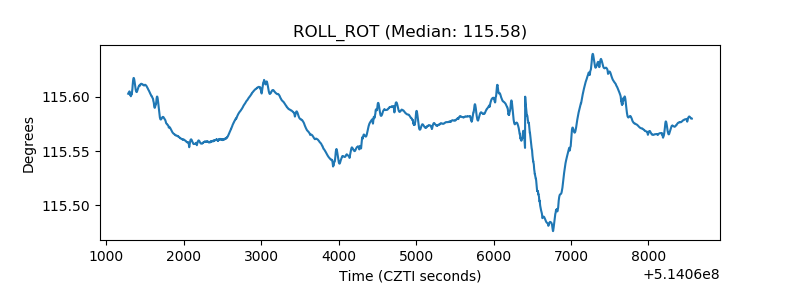 |
| _Roll_DEC | 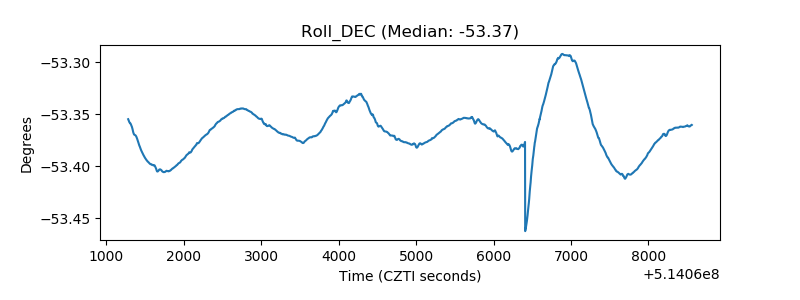 |
| _Roll_RA | 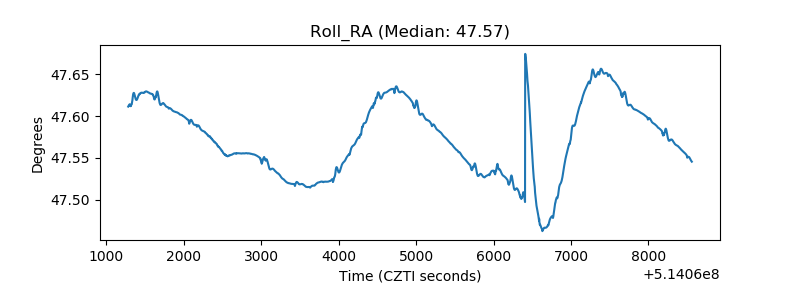 |
| Veto Counter | 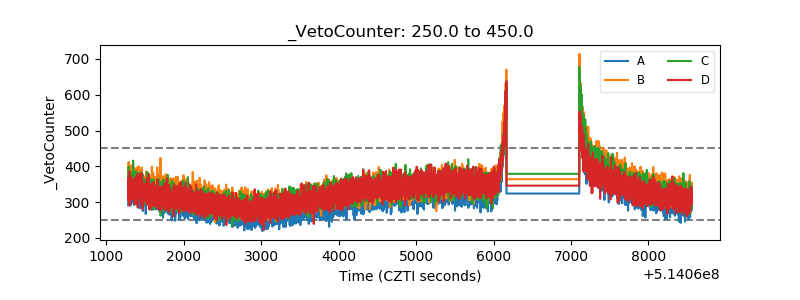 |