| Param | Original file | Final file |
|---|---|---|
| Filename | modeM0/AS1A14_083T10_9000006566_57086cztM0_level2.fits | modeM0/AS1A14_083T10_9000006566_57086cztM0_level2_quad_clean.evt |
| Size (bytes) | 562,046,400 | 90,604,800 |
| Size | 536.0 MB | 86.4 MB |
| Events in quadrant A | 3,169,468 | 637,502 |
| Events in quadrant B | 3,838,336 | 660,429 |
| Events in quadrant C | 3,447,801 | 603,700 |
| Events in quadrant D | 9,840,701 | 385,526 |
| Mode M9 | |||
|---|---|---|---|
| Quadrant | BADHDUFLAG | Total packets | Discarded packets |
| A | 0 | 12 | 0 |
| B | 0 | 13 | 0 |
| C | 0 | 13 | 0 |
| D | 0 | 13 | 0 |
| Mode M0 | |||
|---|---|---|---|
| Quadrant | BADHDUFLAG | Total packets | Discarded packets |
| A | 0 | 14220 | 2 |
| B | 0 | 15940 | 2 |
| C | 0 | 15049 | 2 |
| D | 0 | 33743 | 2 |
| Mode SS | |||
|---|---|---|---|
| Quadrant | BADHDUFLAG | Total packets | Discarded packets |
| A | 0 | 132 | 0 |
| B | 0 | 132 | 0 |
| C | 0 | 132 | 0 |
| D | 0 | 132 | 0 |
| Quadrant | Total seconds | Saturated seconds | Saturation percentage |
|---|---|---|---|
| A | 6546 | 94 | 1.435991% |
| B | 6546 | 361 | 5.514818% |
| C | 6546 | 117 | 1.787351% |
| D | 6546 | 2338 | 35.716468% |
Noise dominated data is calculated using 1-second bins in cleaned event files. If a bin has >2000 counts, and if more than 50% of those come from <1% of pixels, then it is considered to be noise-dominated and hence unusable.
| Quadrant | # 1 sec bins | Bins with >0 counts | Bins with >2000 counts | High rate bins dominated by noise | Noise dominated (total time) | Noise dominated (detector-on time) | Marked lightcurve |
|---|---|---|---|---|---|---|---|
| A | 7626 | 6547 | 56 | 56 | 0.73% | 0.86% | 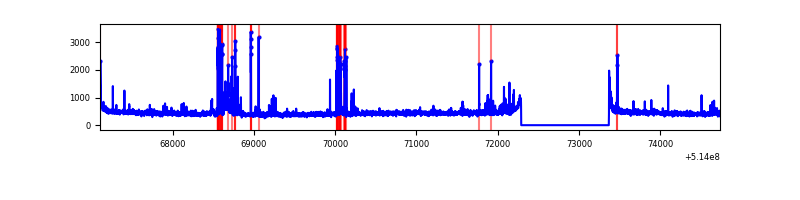 |
| B | 7626 | 6547 | 154 | 154 | 2.02% | 2.35% | 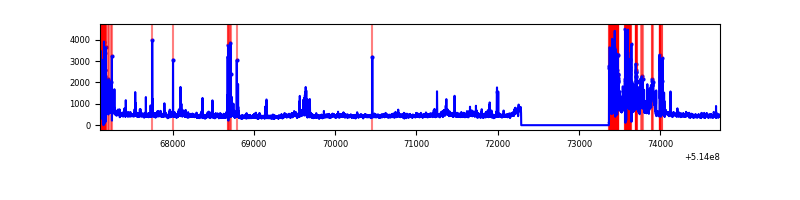 |
| C | 7626 | 6547 | 71 | 71 | 0.93% | 1.08% | 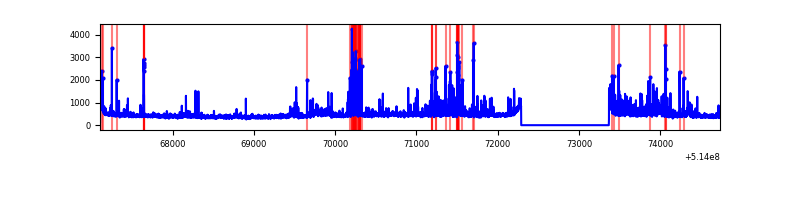 |
| D | 7626 | 6547 | 2382 | 2382 | 31.24% | 36.38% | 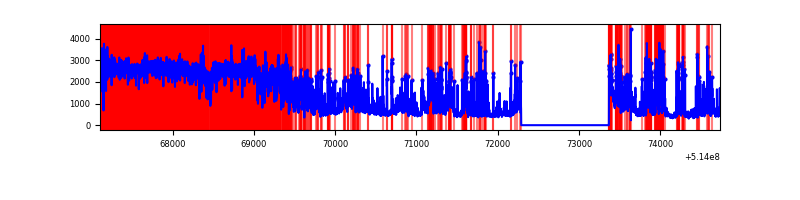 |
Top three noisy pixels from each quadrant. If the there are fewer than three noisy pixels in the level2.evt file, extra rows are filled as -1
| Pixel properties | Quadrant properties | ||||||
|---|---|---|---|---|---|---|---|
| Quadrant | DetID | PixID | Counts | Sigma | Mean | Median | Sigma |
| A | 10 | 251 | 195950 | 1109.29 | 710 | 689 | 176.0 |
| A | 4 | 13 | 100261 | 565.67 | 710 | 689 | 176.0 |
| A | 3 | 14 | 64269 | 361.2 | 710 | 689 | 176.0 |
| B | 10 | 16 | 636497 | 4357.14 | 683 | 658 | 145.9 |
| B | 4 | 171 | 264534 | 1808.23 | 683 | 658 | 145.9 |
| B | 0 | 63 | 128039 | 872.89 | 683 | 658 | 145.9 |
| C | 14 | 245 | 218153 | 1173.17 | 685 | 678 | 185.4 |
| C | 6 | 223 | 210613 | 1132.49 | 685 | 678 | 185.4 |
| C | 12 | 252 | 149339 | 801.95 | 685 | 678 | 185.4 |
| D | 15 | 142 | 5105381 | 30682.23 | 583 | 556 | 166.4 |
| D | 12 | 33 | 1119213 | 6723.62 | 583 | 556 | 166.4 |
| D | 2 | 249 | 503642 | 3023.77 | 583 | 556 | 166.4 |
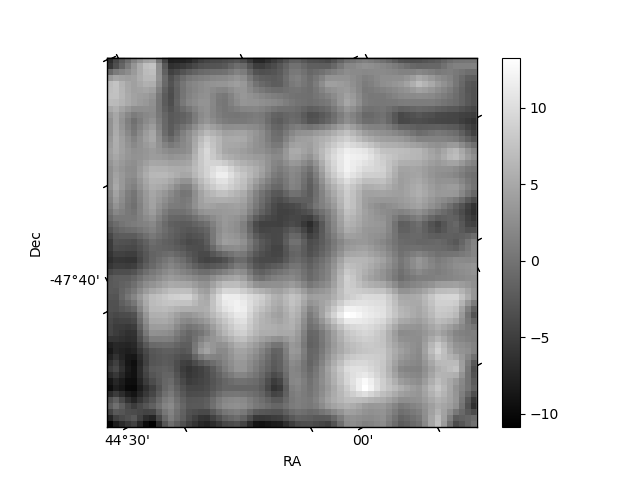
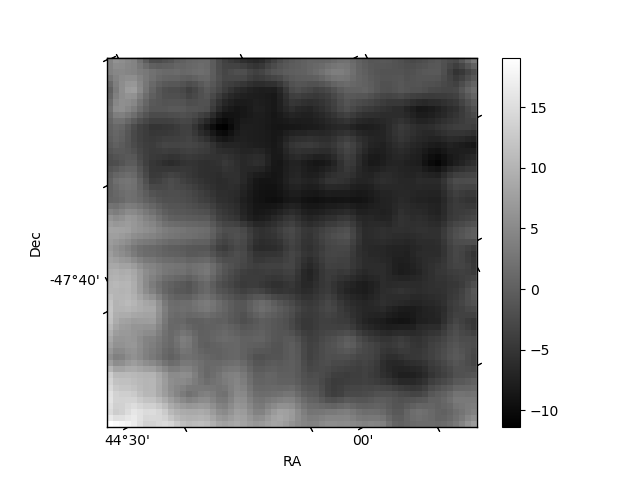
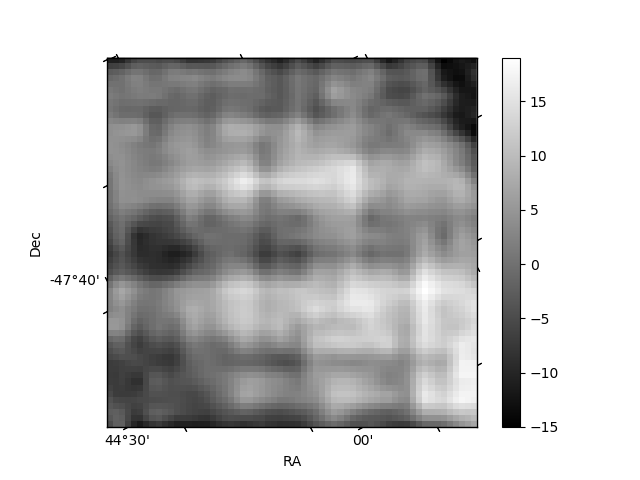
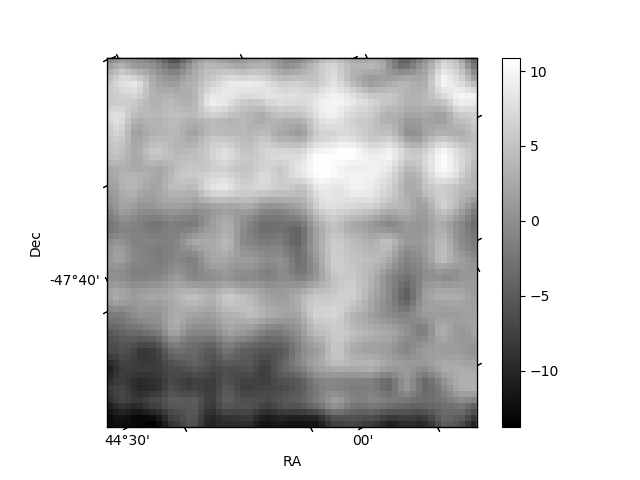
Histogram calculated using DETX and DETY for each event in the final _common_clean file
| Quadrant A | 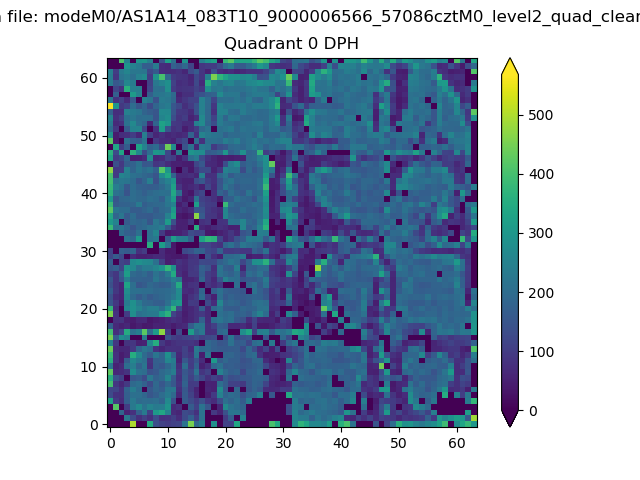 |
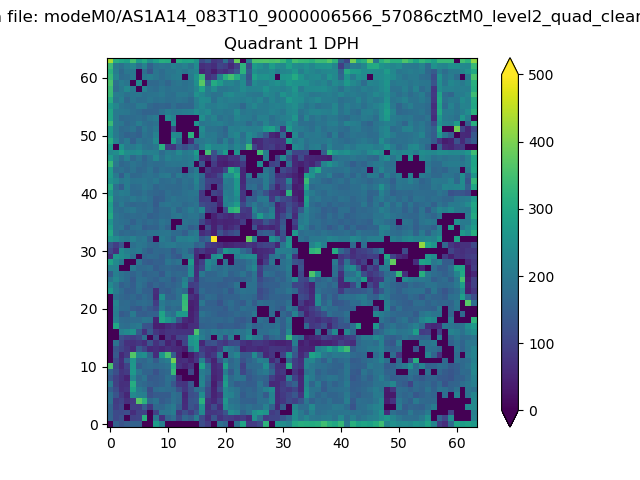 |
Quadrant B |
|---|---|---|---|
| Quadrant D | 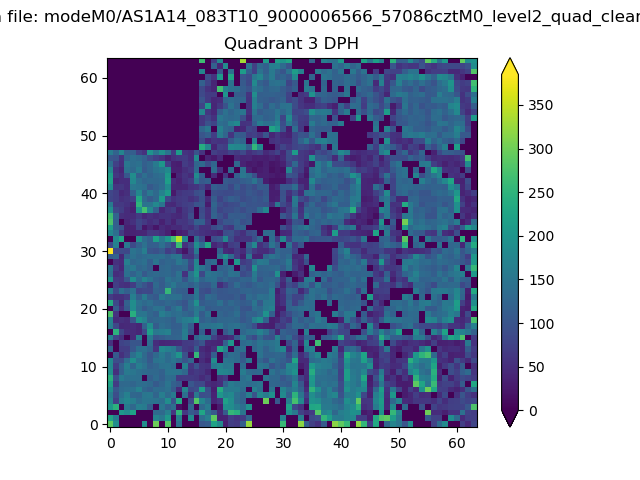 |
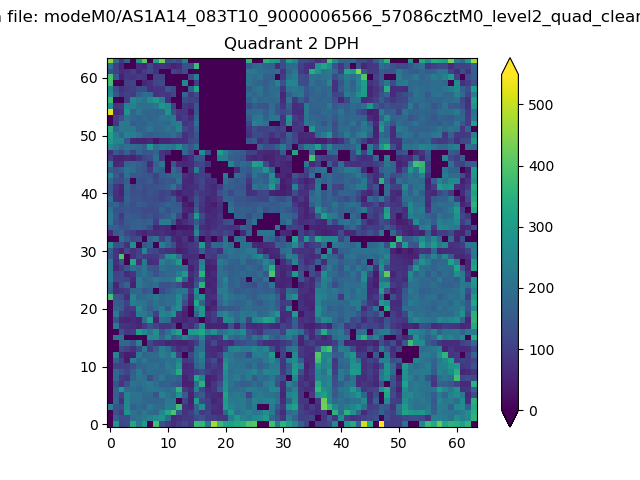 |
Quadrant C |
| Plot type | Count rate plots | Images |
|---|---|---|
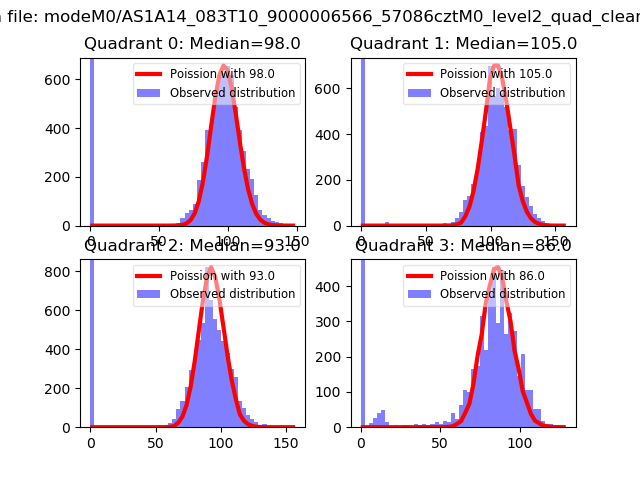
| Comparison with Poisson distribution Blue bars denote a histogram of data divided into 1 sec bins. Red curve is a Poisson curve with rate = median count rate of data. |
 |
 |
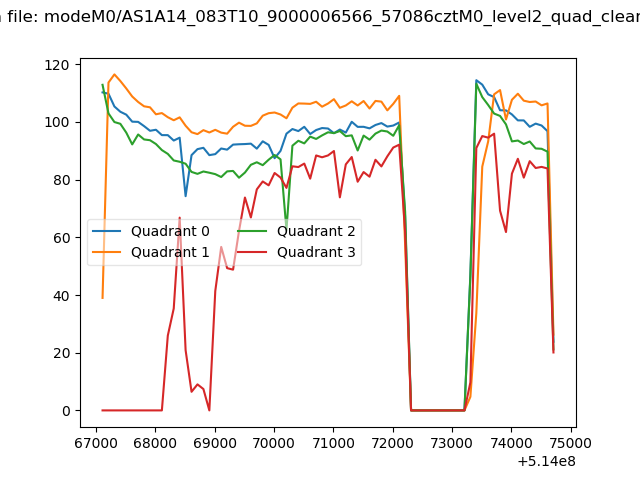
| Quadrant-wise count rates Data is divided into 100 sec bins |
 |
|
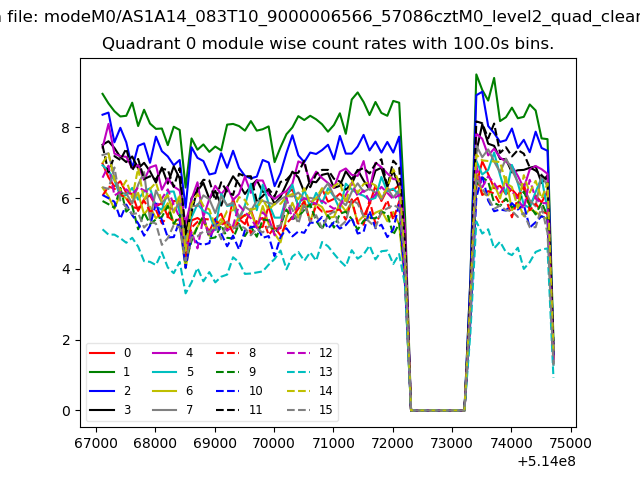
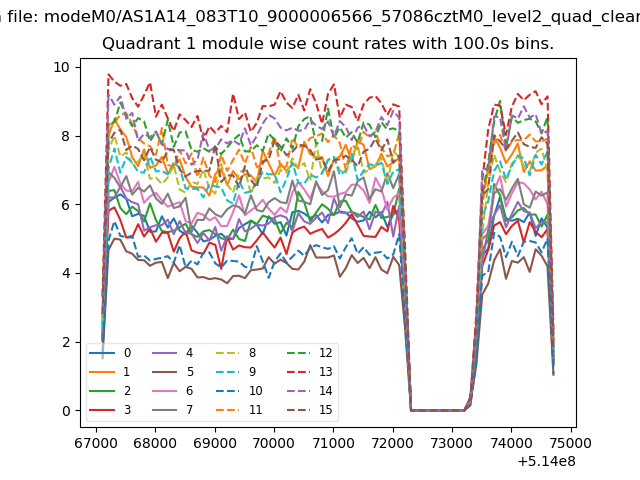
| Module-wise count rates for Quadrant A Data is divided into 100 sec bins |
 |
 |
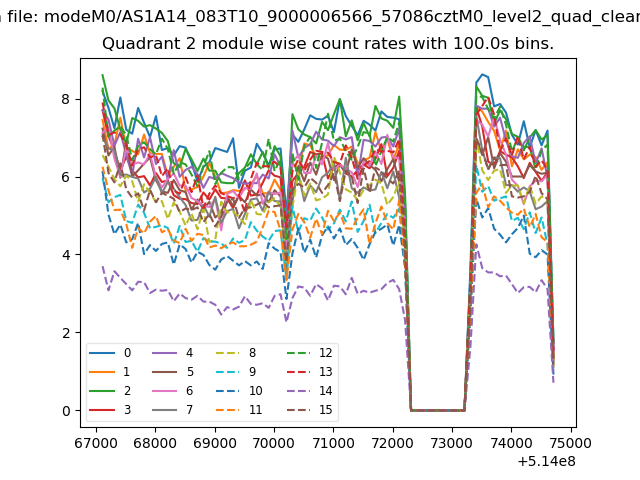
| Module-wise count rates for Quadrant B Data is divided into 100 sec bins |
 |
 |
| Module-wise count rates for Quadrant C Data is divided into 100 sec bins |
 |
 |
| Module-wise count rates for Quadrant D Data is divided into 100 sec bins |
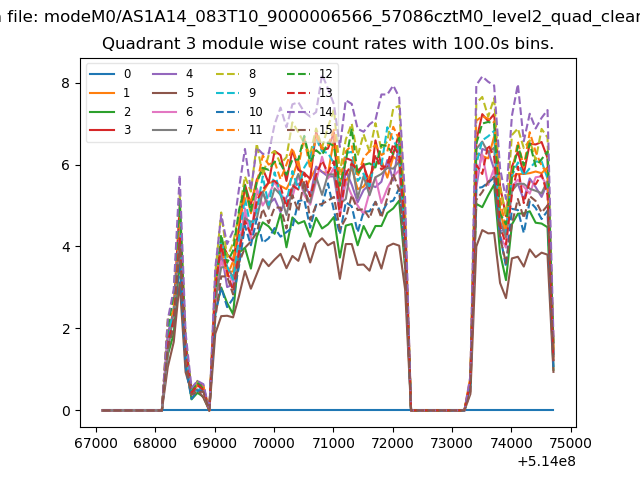 |
 |
| Parameter | Plot |
|---|---|
| CZT HV Monitor | 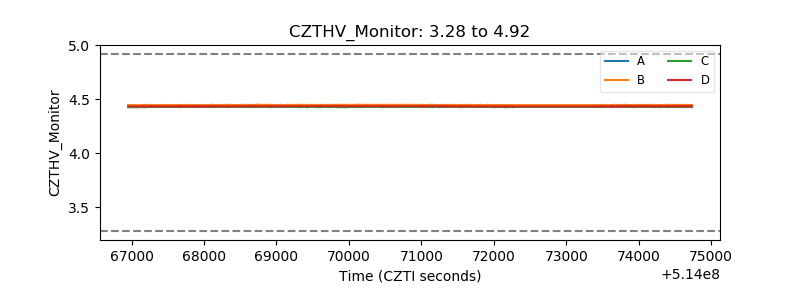 |
| D_VDD | 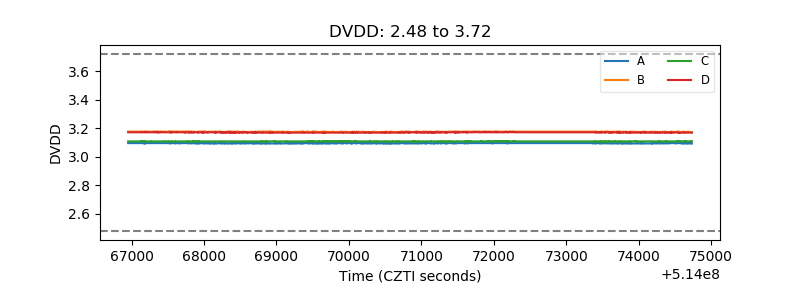 |
| Temperature 1 | 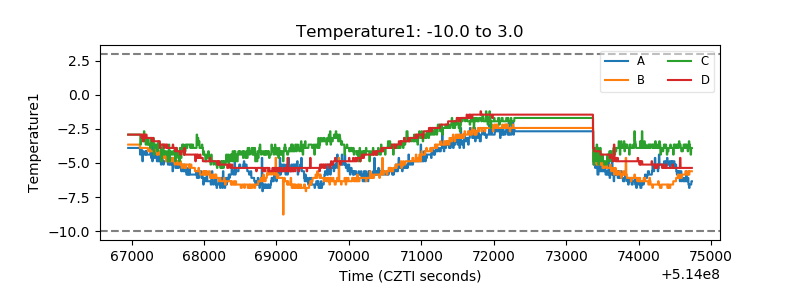 |
| Veto HV Monitor | 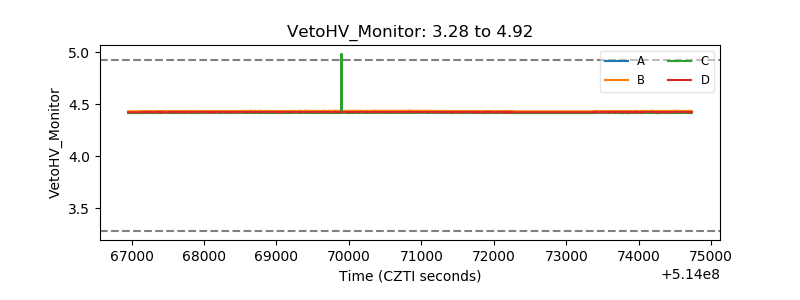 |
| Veto LLD | 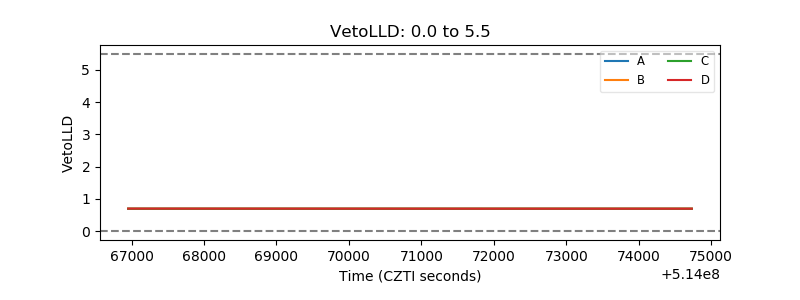 |
| Alpha Counter | 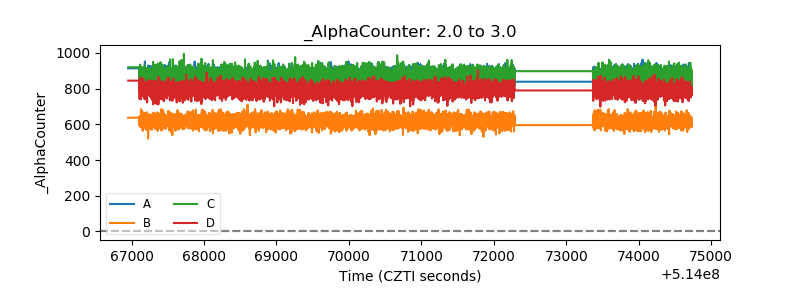 |
| _CPM_Rate | 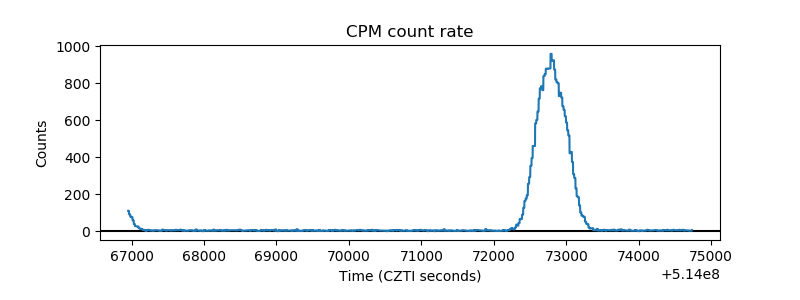 |
| CZT Counter | 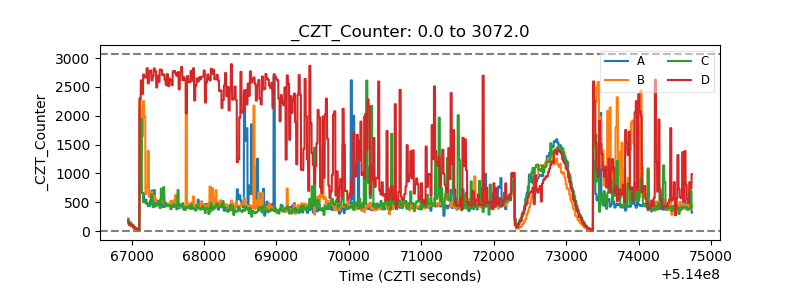 |
| +2.5 Volts monitor |  |
| +5 Volts monitor |  |
| _ROLL_ROT | 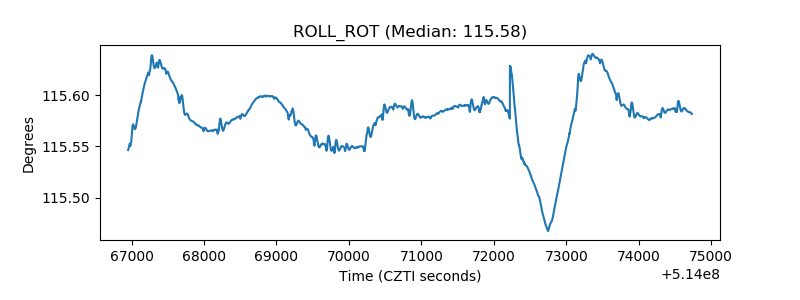 |
| _Roll_DEC | 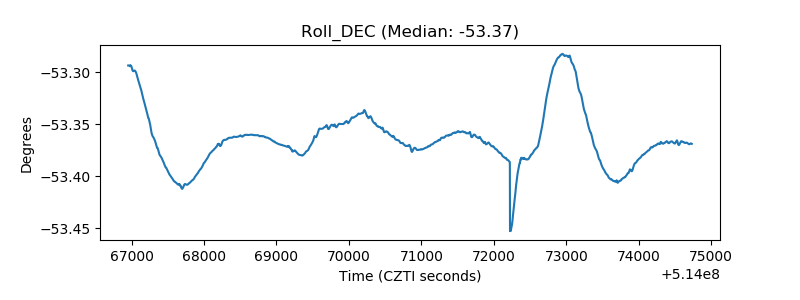 |
| _Roll_RA | 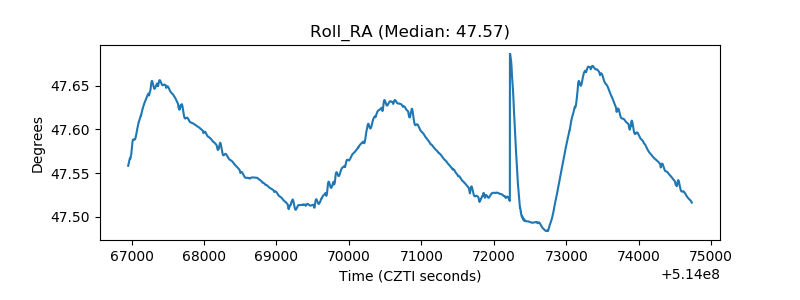 |
| Veto Counter | 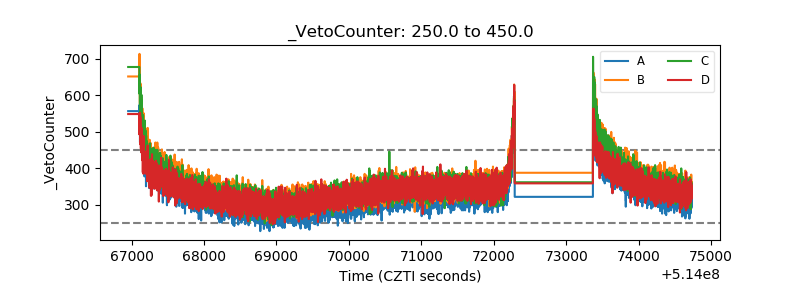 |