| Param | Original file | Final file |
|---|---|---|
| Filename | modeM0/AS1A14_083T10_9000006566_57087cztM0_level2.fits | modeM0/AS1A14_083T10_9000006566_57087cztM0_level2_quad_clean.evt |
| Size (bytes) | 468,869,760 | 94,864,320 |
| Size | 447.1 MB | 90.5 MB |
| Events in quadrant A | 2,917,300 | 648,112 |
| Events in quadrant B | 4,057,258 | 659,292 |
| Events in quadrant C | 4,657,828 | 574,182 |
| Events in quadrant D | 5,225,258 | 543,583 |
| Mode M9 | |||
|---|---|---|---|
| Quadrant | BADHDUFLAG | Total packets | Discarded packets |
| A | 0 | 19 | 0 |
| B | 0 | 20 | 0 |
| C | 0 | 20 | 0 |
| D | 0 | 20 | 0 |
| Mode M0 | |||
|---|---|---|---|
| Quadrant | BADHDUFLAG | Total packets | Discarded packets |
| A | 0 | 13313 | 2 |
| B | 0 | 16314 | 3 |
| C | 0 | 18314 | 2 |
| D | 0 | 19822 | 2 |
| Mode SS | |||
|---|---|---|---|
| Quadrant | BADHDUFLAG | Total packets | Discarded packets |
| A | 0 | 130 | 0 |
| B | 0 | 130 | 0 |
| C | 0 | 130 | 0 |
| D | 0 | 130 | 0 |
| Quadrant | Total seconds | Saturated seconds | Saturation percentage |
|---|---|---|---|
| A | 6413 | 23 | 0.358646% |
| B | 6412 | 410 | 6.394261% |
| C | 6412 | 513 | 8.000624% |
| D | 6412 | 437 | 6.815346% |
Noise dominated data is calculated using 1-second bins in cleaned event files. If a bin has >2000 counts, and if more than 50% of those come from <1% of pixels, then it is considered to be noise-dominated and hence unusable.
| Quadrant | # 1 sec bins | Bins with >0 counts | Bins with >2000 counts | High rate bins dominated by noise | Noise dominated (total time) | Noise dominated (detector-on time) | Marked lightcurve |
|---|---|---|---|---|---|---|---|
| A | 7598 | 6414 | 9 | 9 | 0.12% | 0.14% | 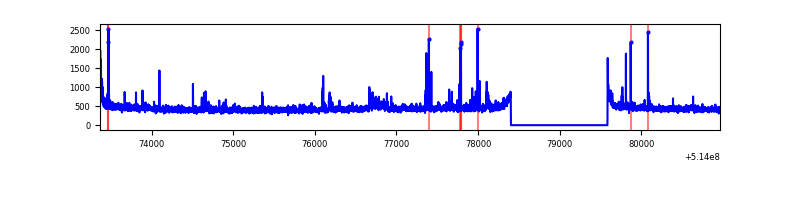 |
| B | 7597 | 6413 | 208 | 208 | 2.74% | 3.24% | 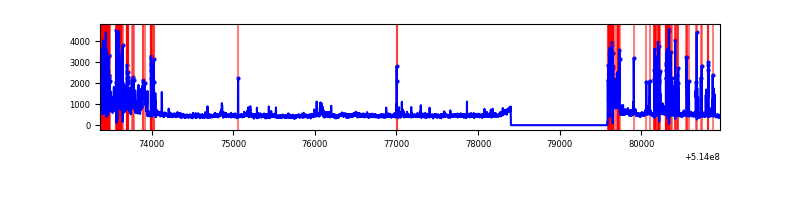 |
| C | 7597 | 6413 | 385 | 385 | 5.07% | 6.00% | 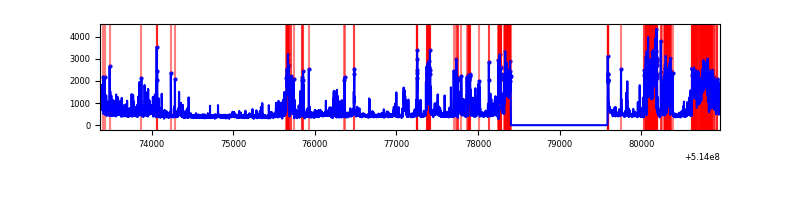 |
| D | 7597 | 6413 | 391 | 391 | 5.15% | 6.10% | 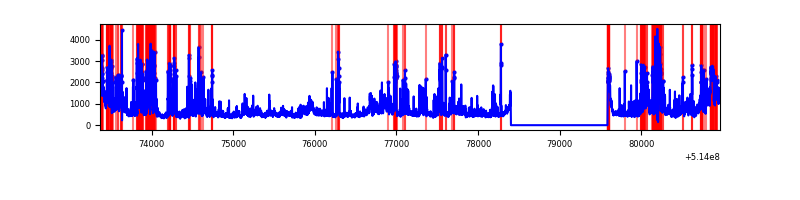 |
Top three noisy pixels from each quadrant. If the there are fewer than three noisy pixels in the level2.evt file, extra rows are filled as -1
| Pixel properties | Quadrant properties | ||||||
|---|---|---|---|---|---|---|---|
| Quadrant | DetID | PixID | Counts | Sigma | Mean | Median | Sigma |
| A | 3 | 14 | 57167 | 321.96 | 708 | 690 | 175.4 |
| A | 10 | 251 | 49113 | 276.05 | 708 | 690 | 175.4 |
| A | 8 | 9 | 15644 | 85.25 | 708 | 690 | 175.4 |
| B | 10 | 16 | 866510 | 5975.1 | 678 | 652 | 144.9 |
| B | 4 | 171 | 154932 | 1064.65 | 678 | 652 | 144.9 |
| B | 0 | 63 | 154446 | 1061.3 | 678 | 652 | 144.9 |
| C | 12 | 252 | 722653 | 4010.24 | 664 | 659 | 180.0 |
| C | 15 | 198 | 616400 | 3420.07 | 664 | 659 | 180.0 |
| C | 6 | 223 | 176595 | 977.22 | 664 | 659 | 180.0 |
| D | 15 | 142 | 1090742 | 5811.71 | 659 | 628 | 187.6 |
| D | 2 | 249 | 634502 | 3379.36 | 659 | 628 | 187.6 |
| D | 8 | 240 | 307412 | 1635.55 | 659 | 628 | 187.6 |
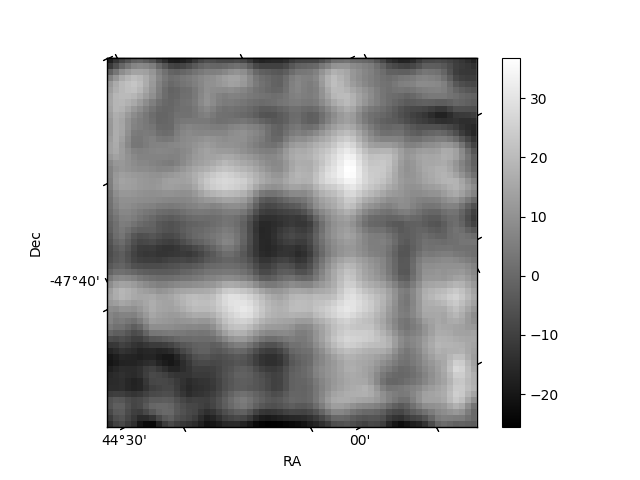
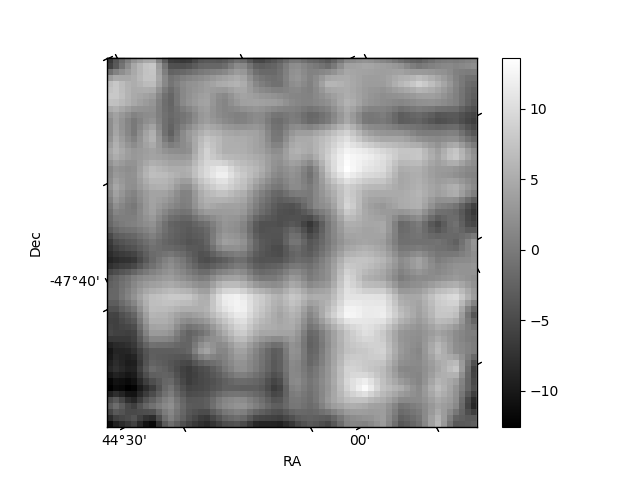
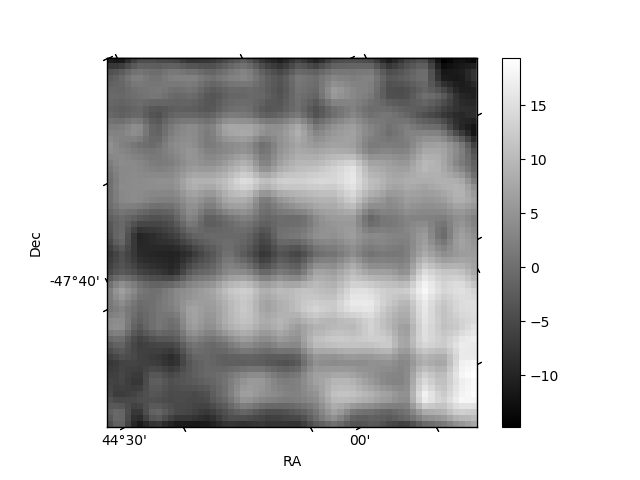
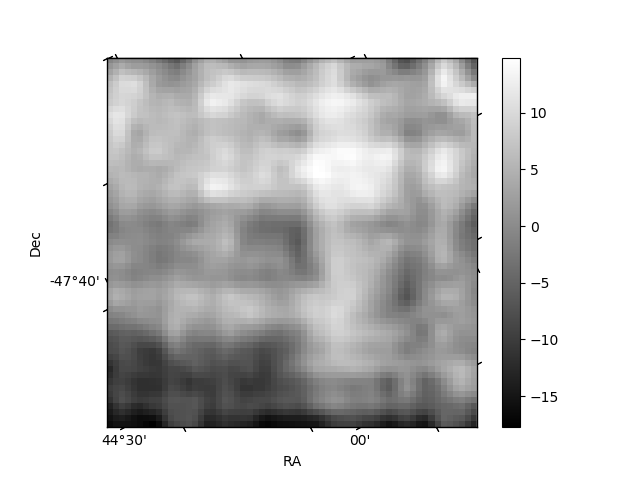
Histogram calculated using DETX and DETY for each event in the final _common_clean file
| Quadrant A | 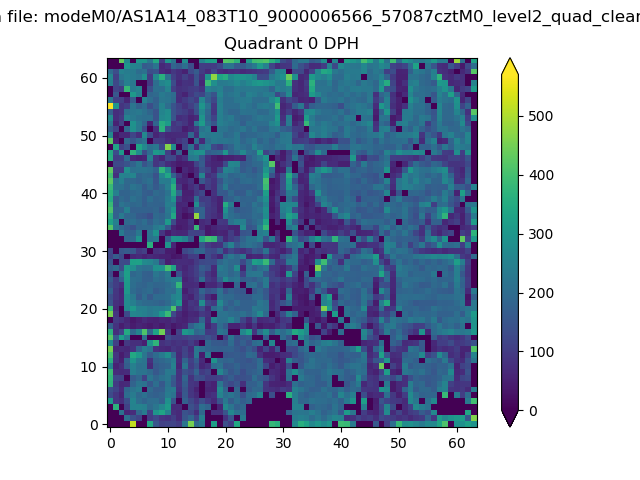 |
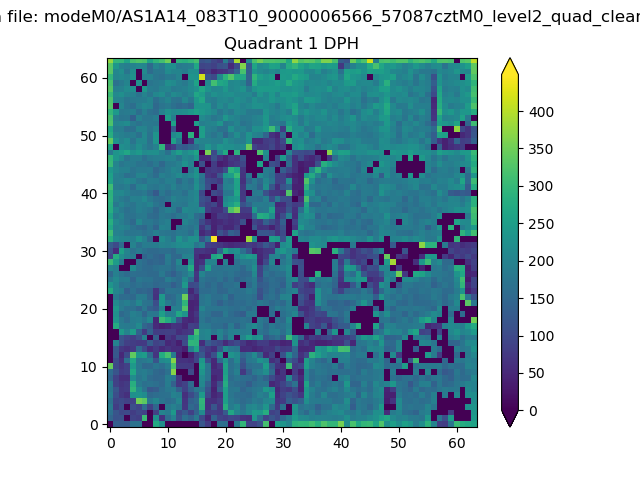 |
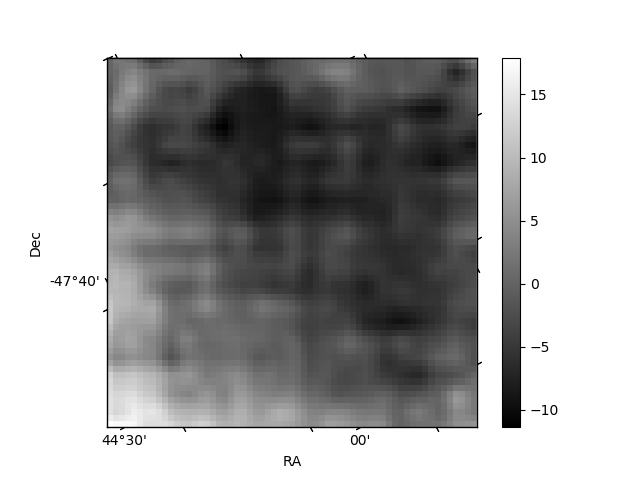
Quadrant B |
|---|---|---|---|
| Quadrant D | 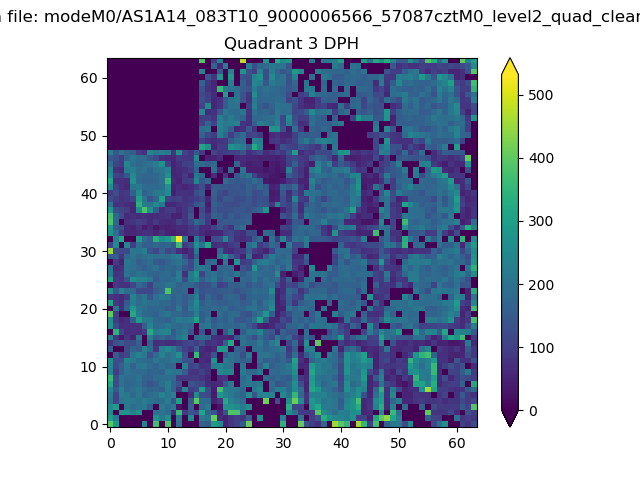 |
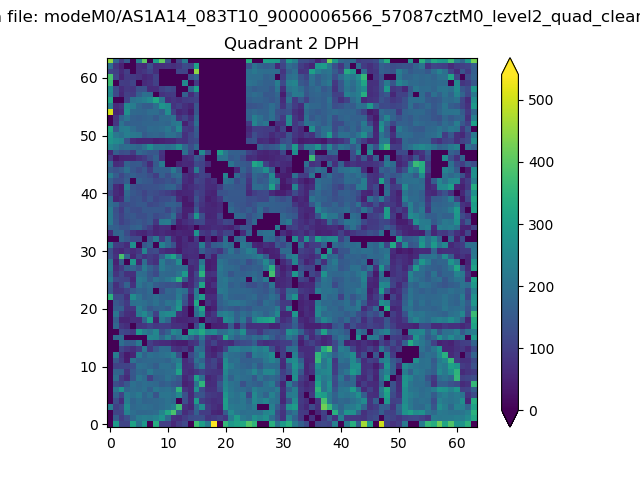 |
Quadrant C |
| Plot type | Count rate plots | Images |
|---|---|---|
| Comparison with Poisson distribution Blue bars denote a histogram of data divided into 1 sec bins. Red curve is a Poisson curve with rate = median count rate of data. |
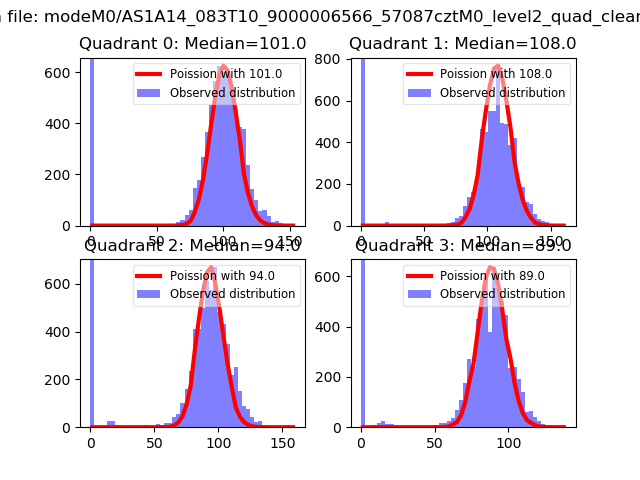 |
 |
| Quadrant-wise count rates Data is divided into 100 sec bins |
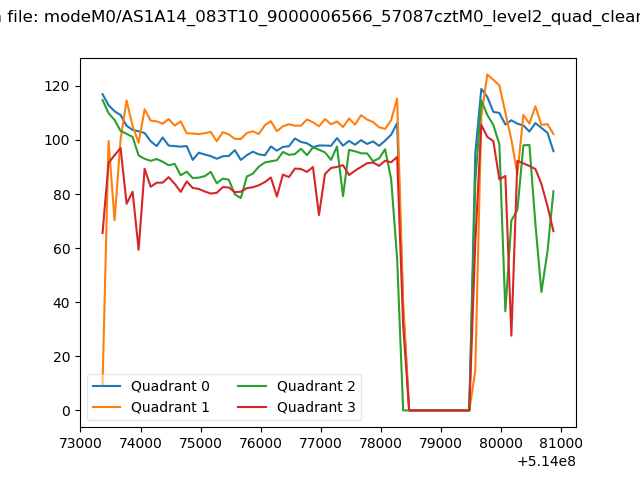 |
|
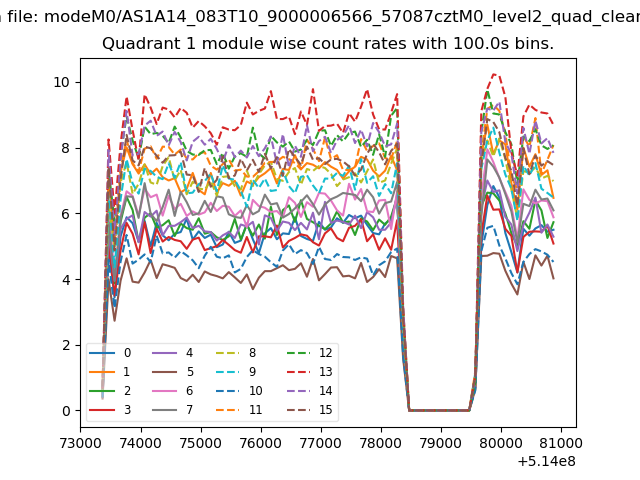
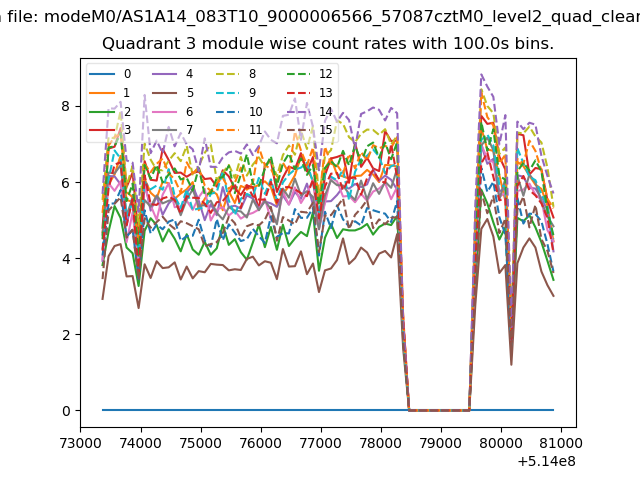
| Module-wise count rates for Quadrant A Data is divided into 100 sec bins |
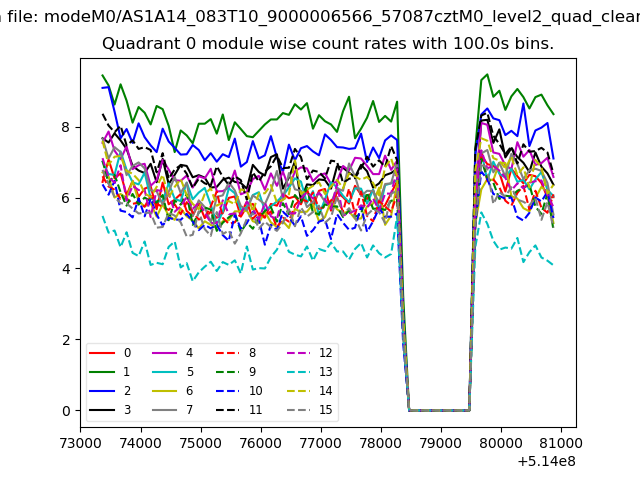 |
 |
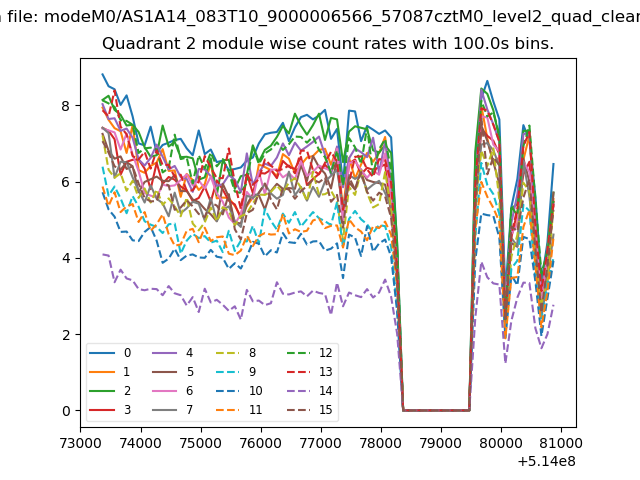
| Module-wise count rates for Quadrant B Data is divided into 100 sec bins |
 |
 |
| Module-wise count rates for Quadrant C Data is divided into 100 sec bins |
 |
 |
| Module-wise count rates for Quadrant D Data is divided into 100 sec bins |
 |
 |
| Parameter | Plot |
|---|---|
| CZT HV Monitor | 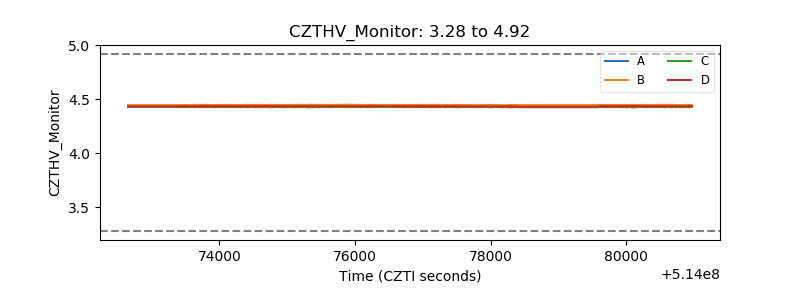 |
| D_VDD | 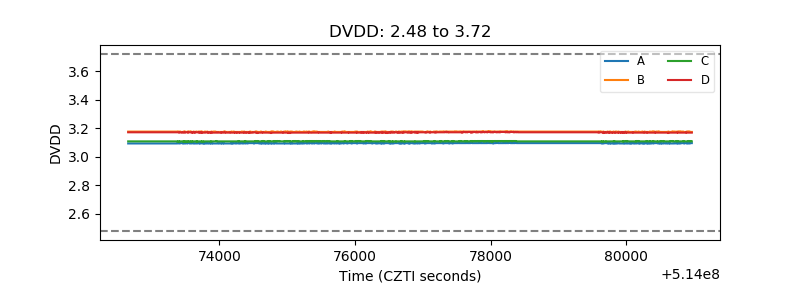 |
| Temperature 1 | 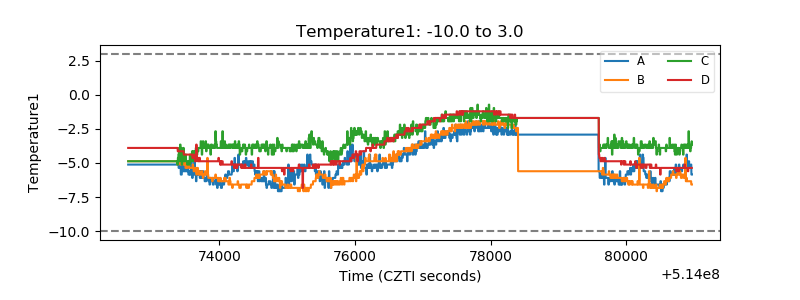 |
| Veto HV Monitor | 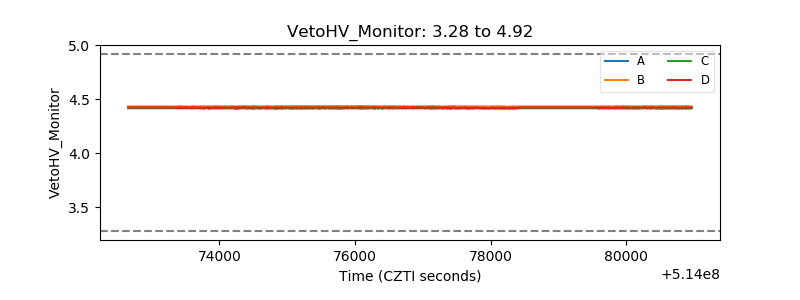 |
| Veto LLD | 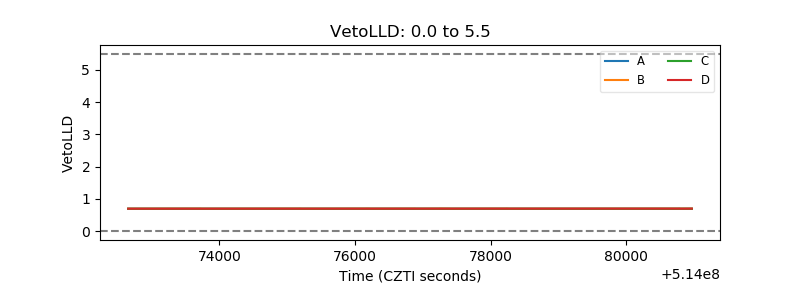 |
| Alpha Counter | 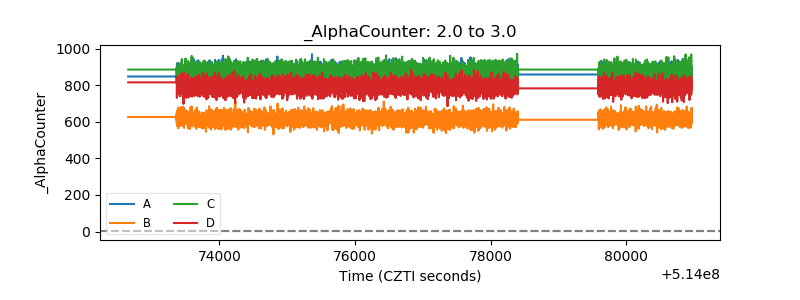 |
| _CPM_Rate | 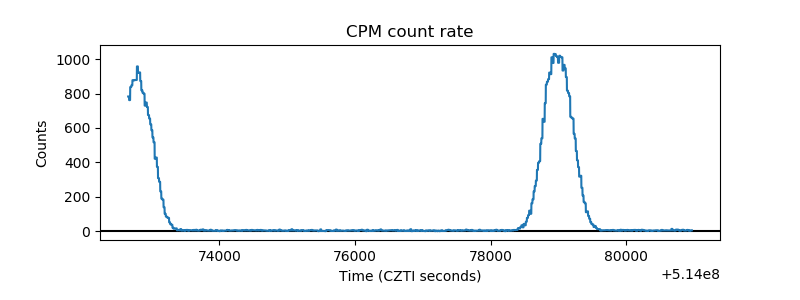 |
| CZT Counter | 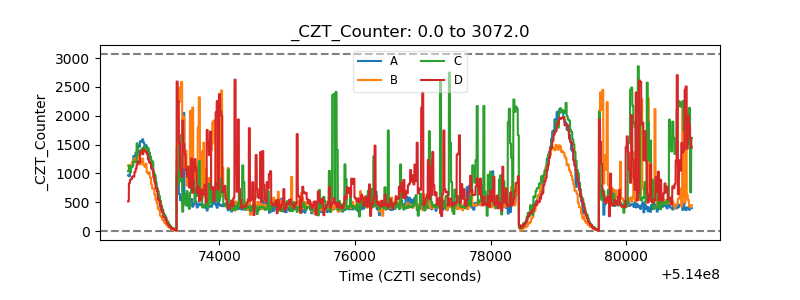 |
| +2.5 Volts monitor |  |
| +5 Volts monitor |  |
| _ROLL_ROT | 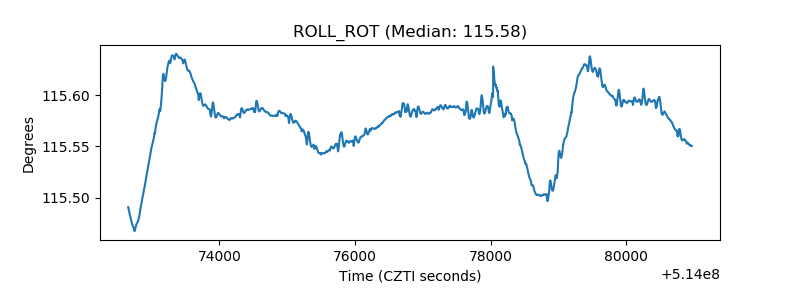 |
| _Roll_DEC | 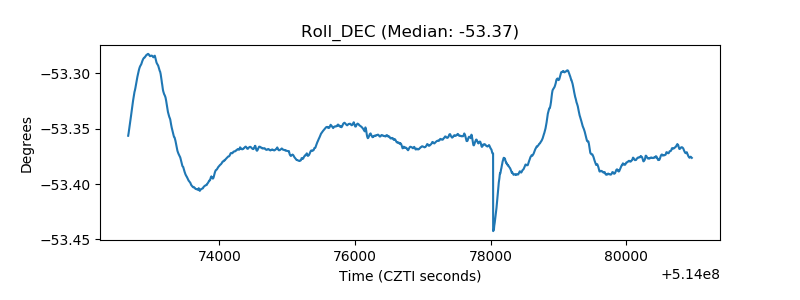 |
| _Roll_RA | 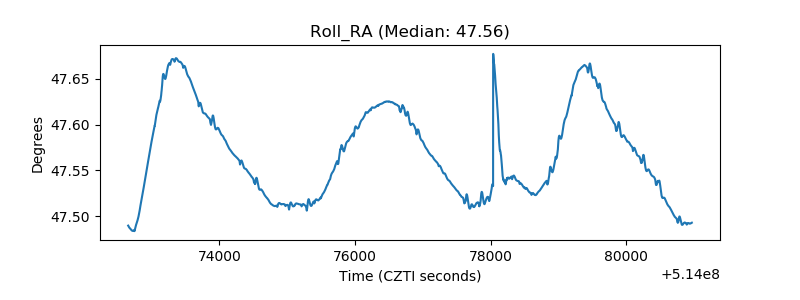 |
| Veto Counter | 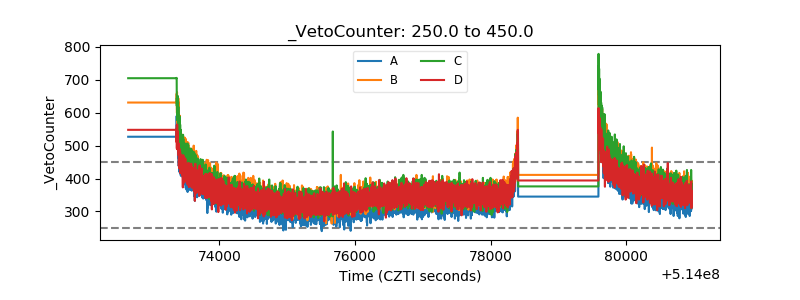 |