| Param | Original file | Final file |
|---|---|---|
| Filename | modeM0/AS1A14_083T10_9000006566_57089cztM0_level2.fits | modeM0/AS1A14_083T10_9000006566_57089cztM0_level2_quad_clean.evt |
| Size (bytes) | 532,615,680 | 95,817,600 |
| Size | 507.9 MB | 91.4 MB |
| Events in quadrant A | 3,116,307 | 658,060 |
| Events in quadrant B | 3,535,987 | 689,812 |
| Events in quadrant C | 4,507,259 | 613,420 |
| Events in quadrant D | 8,051,199 | 486,571 |
| Mode M9 | |||
|---|---|---|---|
| Quadrant | BADHDUFLAG | Total packets | Discarded packets |
| A | 0 | 23 | 0 |
| B | 0 | 24 | 0 |
| C | 0 | 24 | 0 |
| D | 0 | 24 | 0 |
| Mode M0 | |||
|---|---|---|---|
| Quadrant | BADHDUFLAG | Total packets | Discarded packets |
| A | 0 | 13943 | 2 |
| B | 0 | 14884 | 2 |
| C | 0 | 17786 | 2 |
| D | 0 | 28425 | 2 |
| Mode SS | |||
|---|---|---|---|
| Quadrant | BADHDUFLAG | Total packets | Discarded packets |
| A | 0 | 134 | 0 |
| B | 0 | 132 | 0 |
| C | 0 | 132 | 0 |
| D | 0 | 132 | 0 |
| Quadrant | Total seconds | Saturated seconds | Saturation percentage |
|---|---|---|---|
| A | 6509 | 71 | 1.090797% |
| B | 6508 | 247 | 3.795329% |
| C | 6508 | 279 | 4.287031% |
| D | 6508 | 1259 | 19.345421% |
Noise dominated data is calculated using 1-second bins in cleaned event files. If a bin has >2000 counts, and if more than 50% of those come from <1% of pixels, then it is considered to be noise-dominated and hence unusable.
| Quadrant | # 1 sec bins | Bins with >0 counts | Bins with >2000 counts | High rate bins dominated by noise | Noise dominated (total time) | Noise dominated (detector-on time) | Marked lightcurve |
|---|---|---|---|---|---|---|---|
| A | 7660 | 6511 | 26 | 26 | 0.34% | 0.40% | 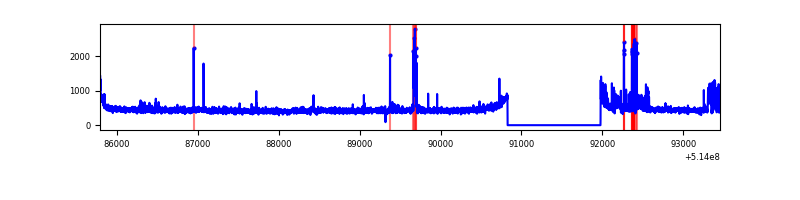 |
| B | 7659 | 6510 | 85 | 85 | 1.11% | 1.31% | 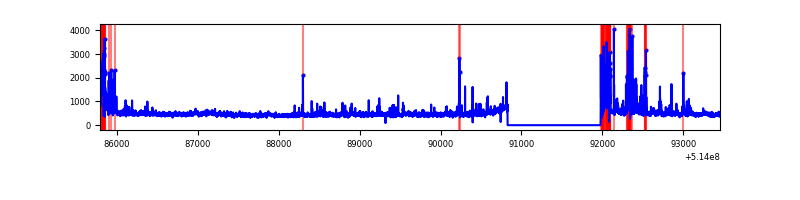 |
| C | 7659 | 6510 | 194 | 194 | 2.53% | 2.98% | 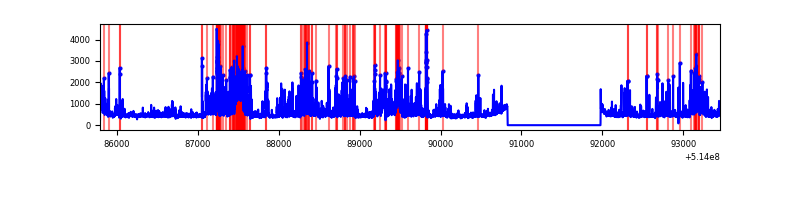 |
| D | 7659 | 6510 | 1141 | 1141 | 14.90% | 17.53% | 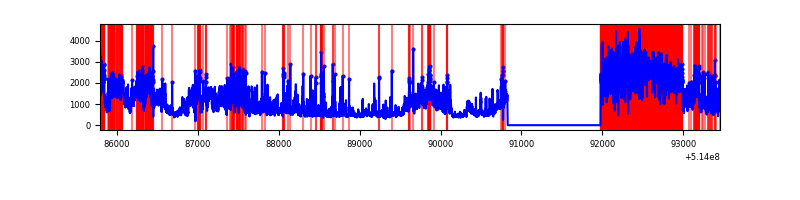 |
Top three noisy pixels from each quadrant. If the there are fewer than three noisy pixels in the level2.evt file, extra rows are filled as -1
| Pixel properties | Quadrant properties | ||||||
|---|---|---|---|---|---|---|---|
| Quadrant | DetID | PixID | Counts | Sigma | Mean | Median | Sigma |
| A | 0 | 12 | 172853 | 959.32 | 727 | 709 | 179.4 |
| A | 13 | 248 | 51084 | 280.73 | 727 | 709 | 179.4 |
| A | 3 | 14 | 27498 | 149.29 | 727 | 709 | 179.4 |
| B | 10 | 16 | 473514 | 3166.42 | 705 | 680 | 149.3 |
| B | 4 | 171 | 76434 | 507.3 | 705 | 680 | 149.3 |
| B | 0 | 63 | 75704 | 502.41 | 705 | 680 | 149.3 |
| C | 15 | 198 | 541527 | 2826.88 | 705 | 700 | 191.3 |
| C | 14 | 245 | 425662 | 2221.26 | 705 | 700 | 191.3 |
| C | 12 | 252 | 237072 | 1235.51 | 705 | 700 | 191.3 |
| D | 15 | 142 | 3687847 | 20575.89 | 636 | 605 | 179.2 |
| D | 12 | 33 | 1251659 | 6981.25 | 636 | 605 | 179.2 |
| D | 15 | 234 | 240643 | 1339.48 | 636 | 605 | 179.2 |
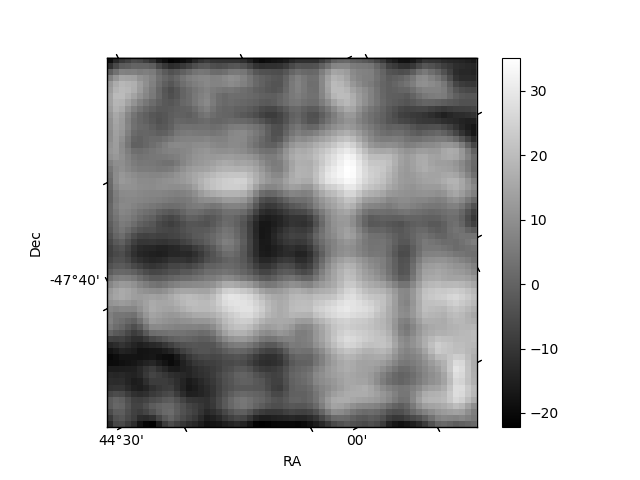
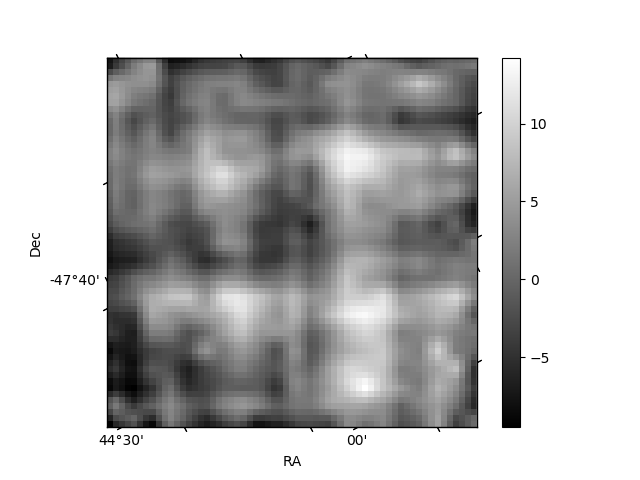
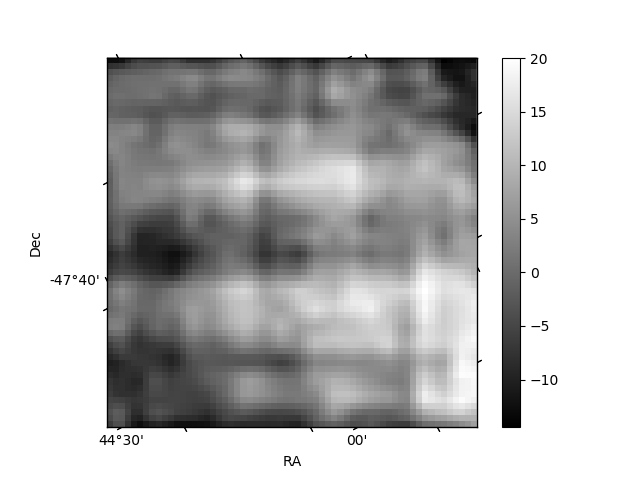
Histogram calculated using DETX and DETY for each event in the final _common_clean file
| Quadrant A | 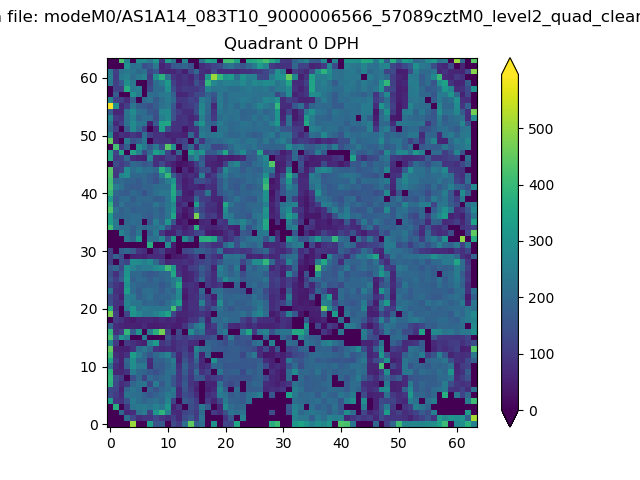 |
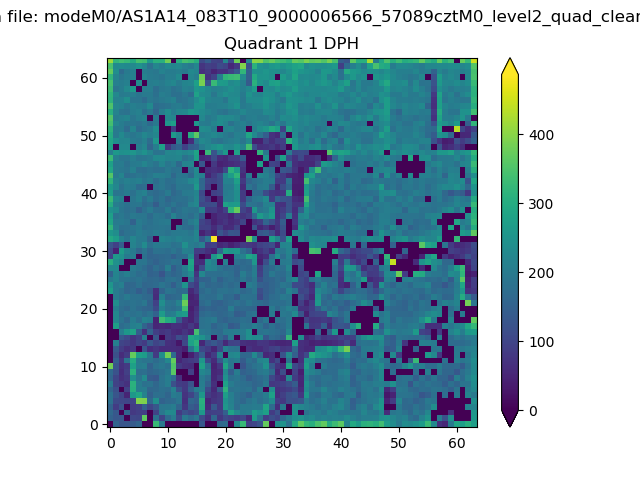 |
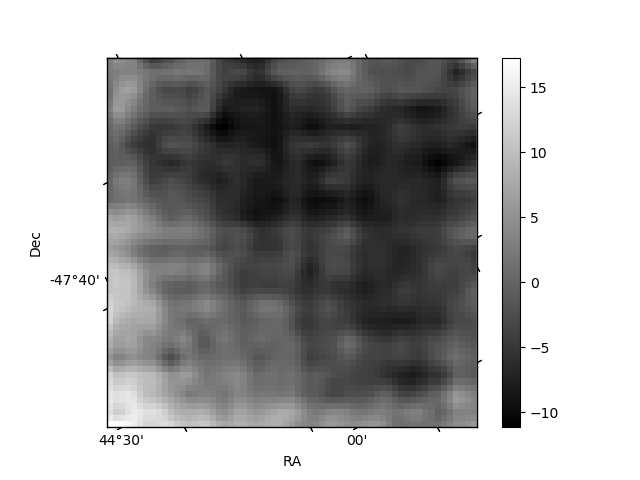
Quadrant B |
|---|---|---|---|
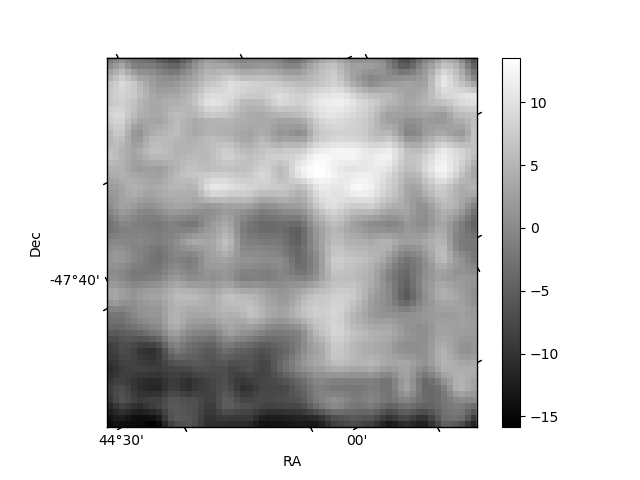
| Quadrant D | 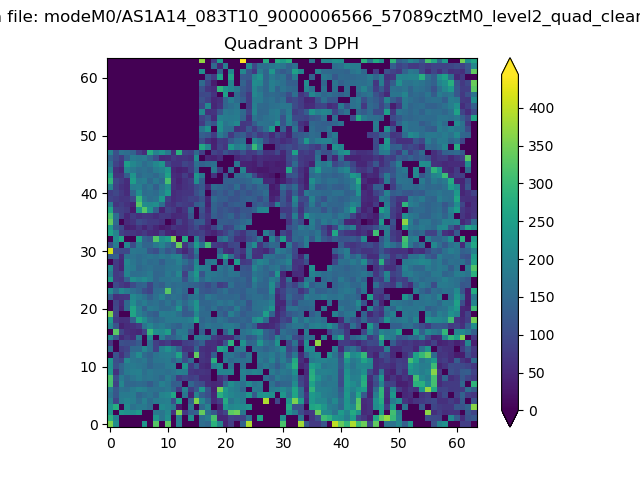 |
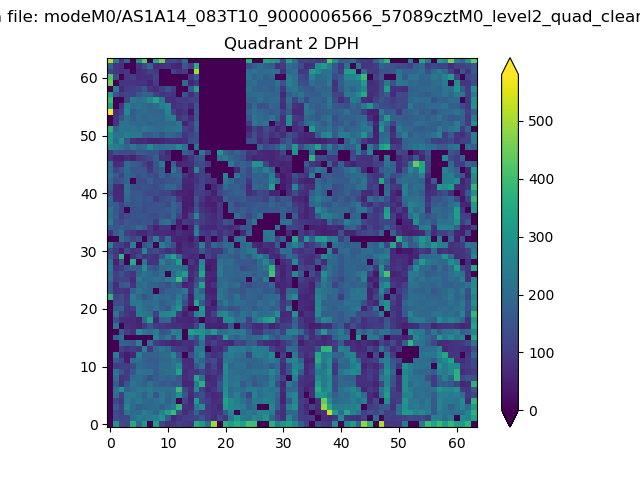 |
Quadrant C |
| Plot type | Count rate plots | Images |
|---|---|---|
| Comparison with Poisson distribution Blue bars denote a histogram of data divided into 1 sec bins. Red curve is a Poisson curve with rate = median count rate of data. |
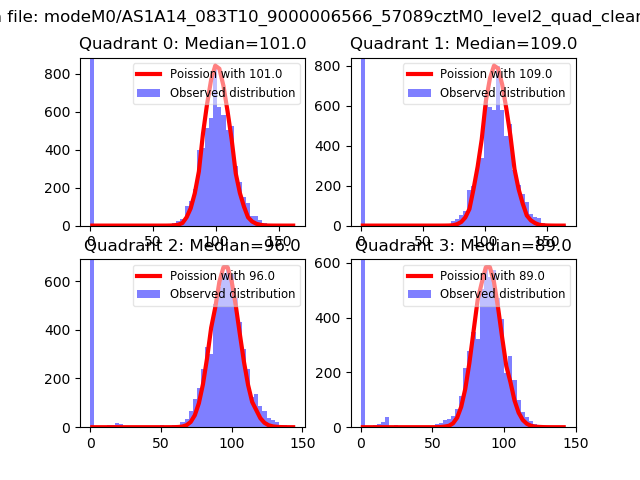 |
 |
| Quadrant-wise count rates Data is divided into 100 sec bins |
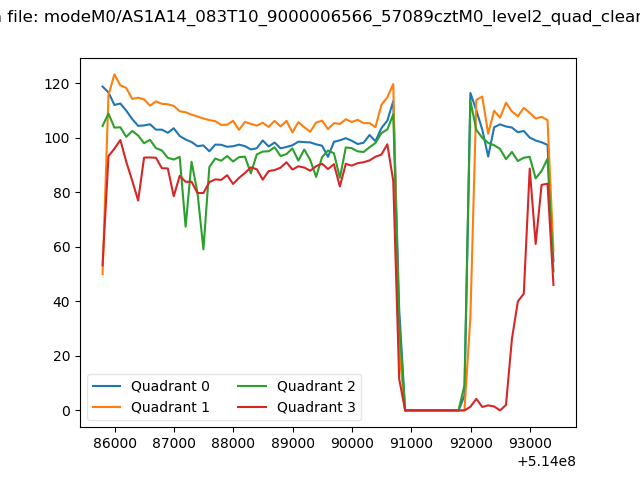 |
|
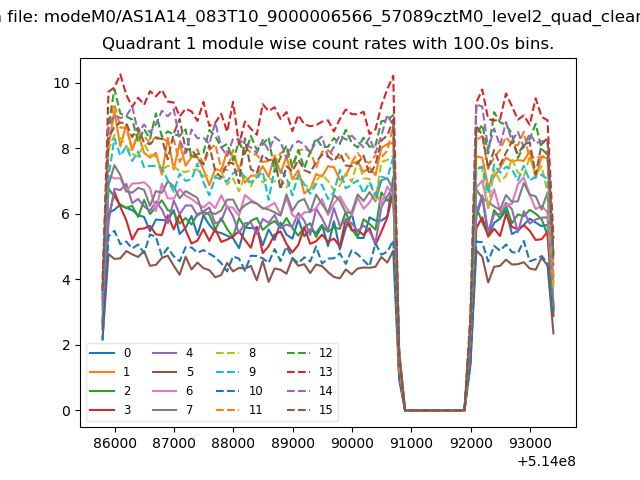
| Module-wise count rates for Quadrant A Data is divided into 100 sec bins |
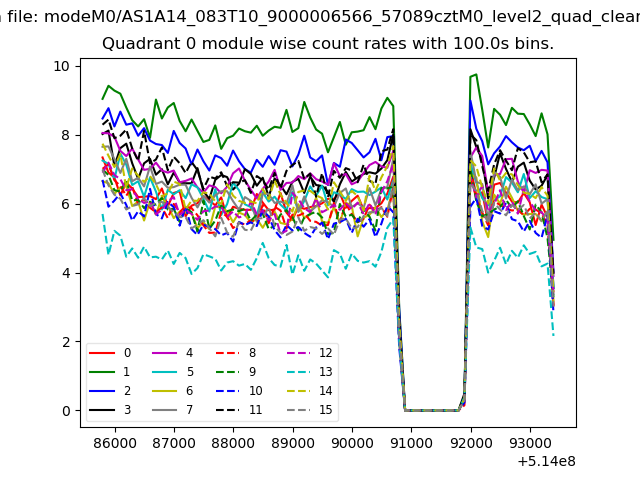 |
 |
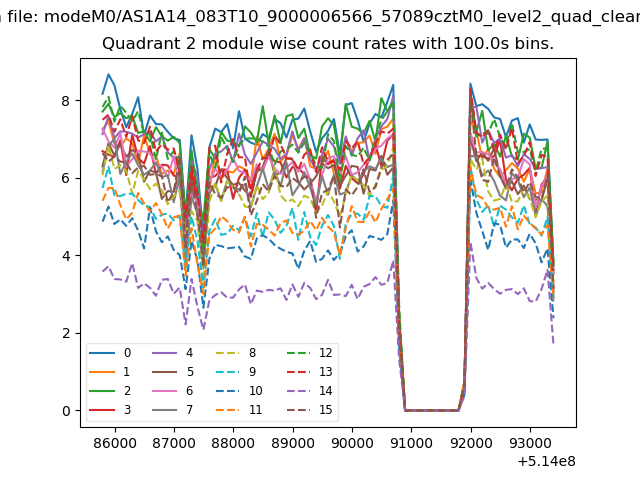
| Module-wise count rates for Quadrant B Data is divided into 100 sec bins |
 |
 |
| Module-wise count rates for Quadrant C Data is divided into 100 sec bins |
 |
 |
| Module-wise count rates for Quadrant D Data is divided into 100 sec bins |
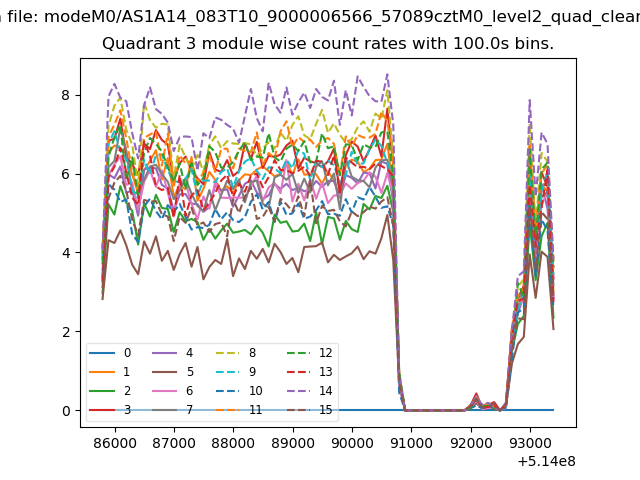 |
 |
| Parameter | Plot |
|---|---|
| CZT HV Monitor | 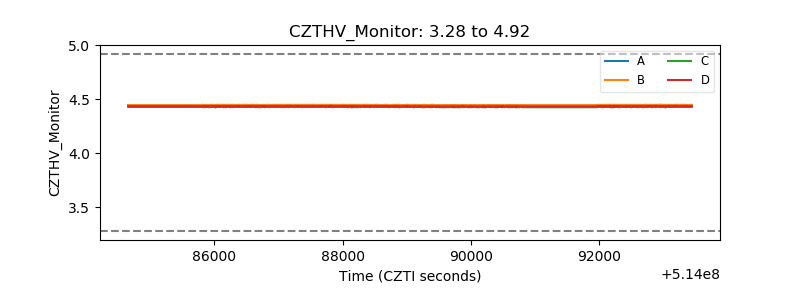 |
| D_VDD | 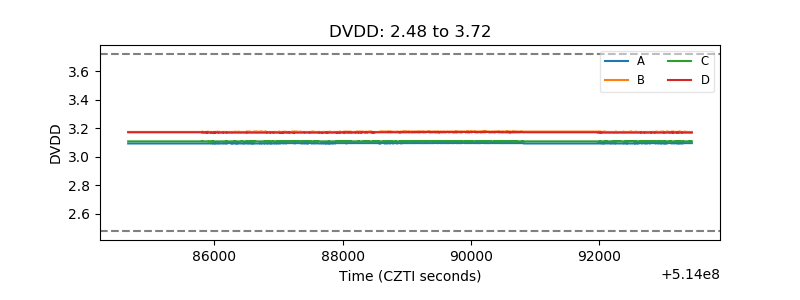 |
| Temperature 1 | 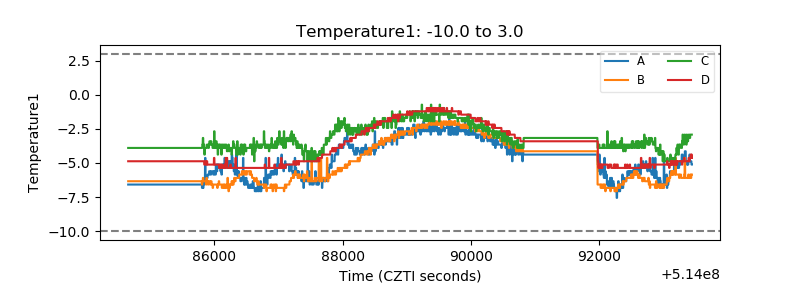 |
| Veto HV Monitor | 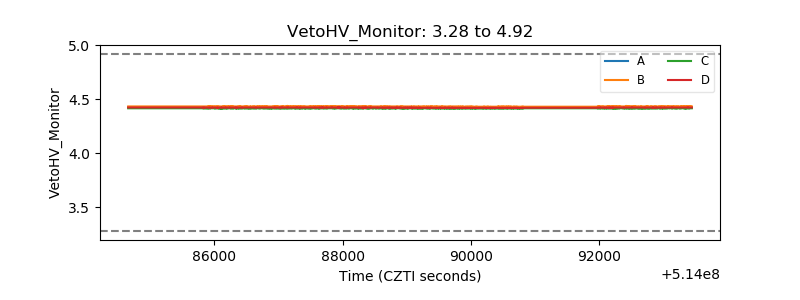 |
| Veto LLD | 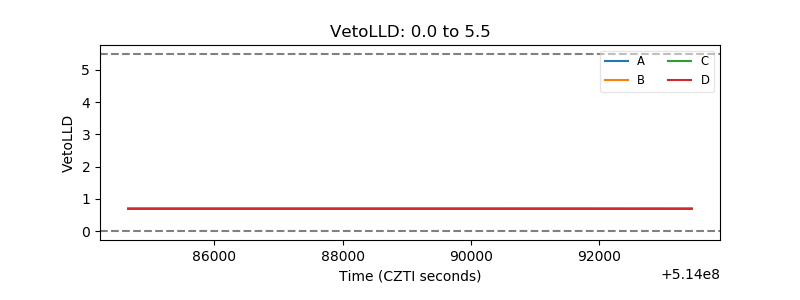 |
| Alpha Counter | 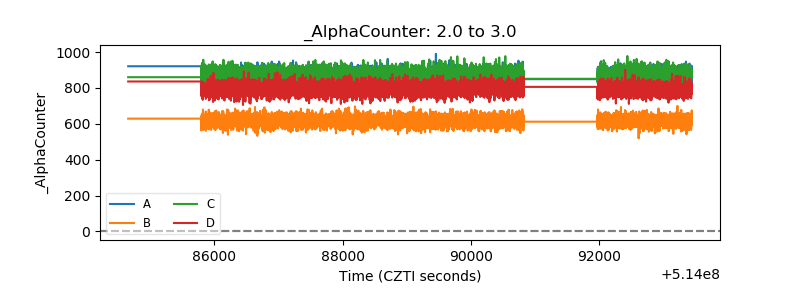 |
| _CPM_Rate | 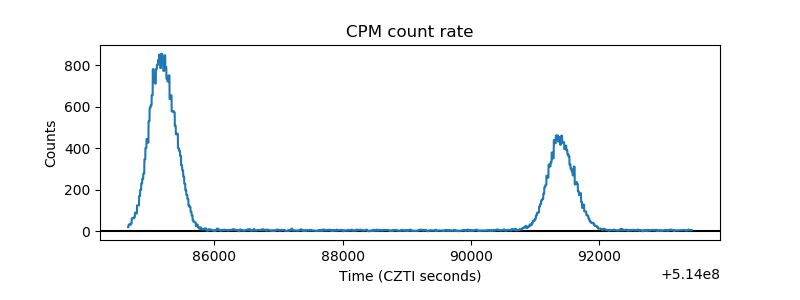 |
| CZT Counter | 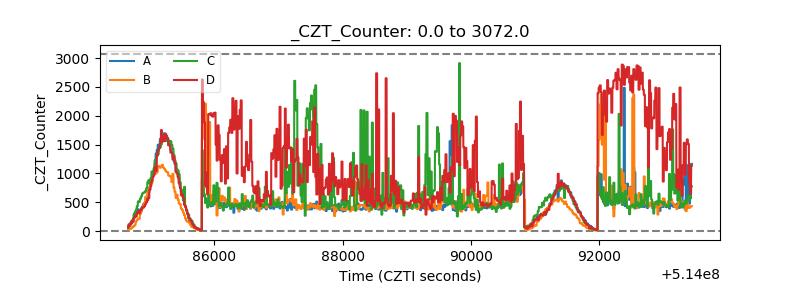 |
| +2.5 Volts monitor |  |
| +5 Volts monitor |  |
| _ROLL_ROT | 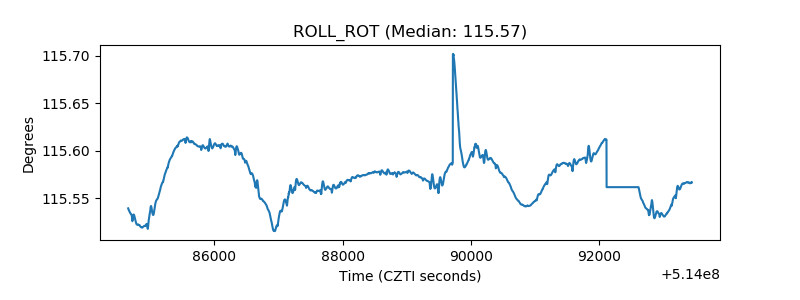 |
| _Roll_DEC | 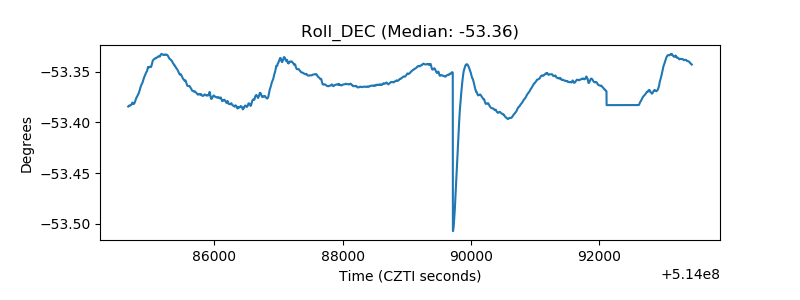 |
| _Roll_RA | 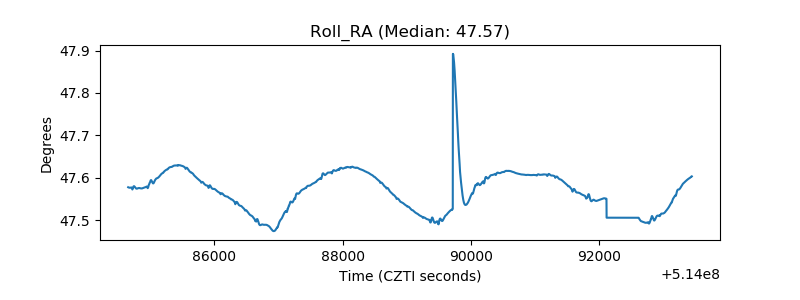 |
| Veto Counter | 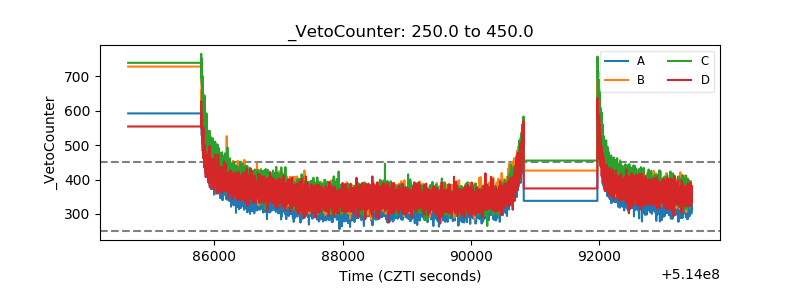 |