| Param | Original file | Final file |
|---|---|---|
| Filename | modeM0/AS1A14_083T10_9000006566_57090cztM0_level2.fits | modeM0/AS1A14_083T10_9000006566_57090cztM0_level2_quad_clean.evt |
| Size (bytes) | 477,100,800 | 87,292,800 |
| Size | 455.0 MB | 83.2 MB |
| Events in quadrant A | 3,517,786 | 582,304 |
| Events in quadrant B | 3,656,858 | 604,380 |
| Events in quadrant C | 3,625,855 | 556,887 |
| Events in quadrant D | 6,389,013 | 475,934 |
| Mode M9 | |||
|---|---|---|---|
| Quadrant | BADHDUFLAG | Total packets | Discarded packets |
| A | 0 | 10 | 0 |
| B | 0 | 10 | 0 |
| C | 0 | 10 | 0 |
| D | 0 | 10 | 0 |
| Mode M0 | |||
|---|---|---|---|
| Quadrant | BADHDUFLAG | Total packets | Discarded packets |
| A | 0 | 14743 | 1 |
| B | 0 | 15130 | 1 |
| C | 0 | 14940 | 1 |
| D | 0 | 23141 | 1 |
| Mode SS | |||
|---|---|---|---|
| Quadrant | BADHDUFLAG | Total packets | Discarded packets |
| A | 0 | 124 | 0 |
| B | 0 | 124 | 0 |
| C | 0 | 124 | 0 |
| D | 0 | 124 | 0 |
| Quadrant | Total seconds | Saturated seconds | Saturation percentage |
|---|---|---|---|
| A | 6063 | 163 | 2.688438% |
| B | 6064 | 404 | 6.662269% |
| C | 6064 | 204 | 3.364116% |
| D | 6064 | 808 | 13.324538% |
Noise dominated data is calculated using 1-second bins in cleaned event files. If a bin has >2000 counts, and if more than 50% of those come from <1% of pixels, then it is considered to be noise-dominated and hence unusable.
| Quadrant | # 1 sec bins | Bins with >0 counts | Bins with >2000 counts | High rate bins dominated by noise | Noise dominated (total time) | Noise dominated (detector-on time) | Marked lightcurve |
|---|---|---|---|---|---|---|---|
| A | 7038 | 6064 | 66 | 66 | 0.94% | 1.09% | 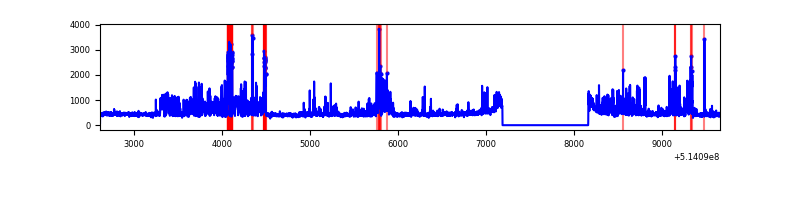 |
| B | 7039 | 6065 | 215 | 215 | 3.05% | 3.54% | 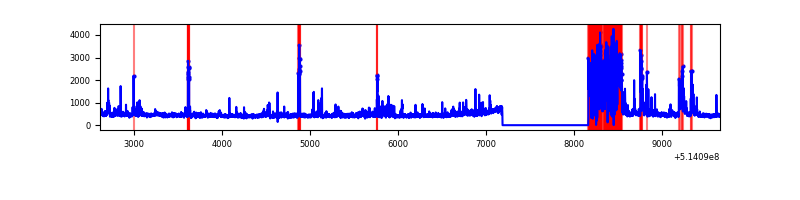 |
| C | 7039 | 6065 | 101 | 101 | 1.43% | 1.67% | 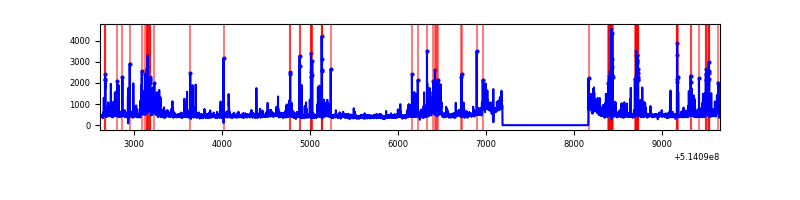 |
| D | 7039 | 6065 | 731 | 731 | 10.38% | 12.05% | 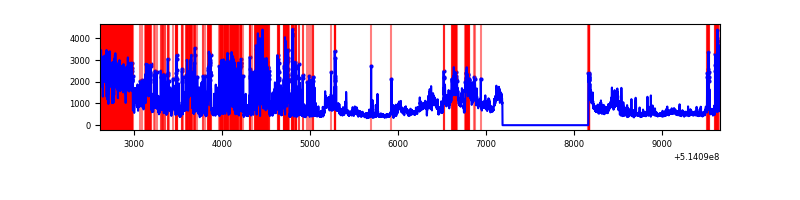 |
Top three noisy pixels from each quadrant. If the there are fewer than three noisy pixels in the level2.evt file, extra rows are filled as -1
| Pixel properties | Quadrant properties | ||||||
|---|---|---|---|---|---|---|---|
| Quadrant | DetID | PixID | Counts | Sigma | Mean | Median | Sigma |
| A | 0 | 12 | 472177 | 2909.05 | 662 | 646 | 162.1 |
| A | 4 | 249 | 401139 | 2470.79 | 662 | 646 | 162.1 |
| A | 4 | 13 | 23507 | 141.04 | 662 | 646 | 162.1 |
| B | 10 | 16 | 854859 | 6362.2 | 631 | 608 | 134.3 |
| B | 4 | 171 | 126631 | 938.58 | 631 | 608 | 134.3 |
| B | 0 | 173 | 38089 | 279.15 | 631 | 608 | 134.3 |
| C | 2 | 12 | 214333 | 1201.79 | 648 | 641 | 177.8 |
| C | 15 | 198 | 212470 | 1191.31 | 648 | 641 | 177.8 |
| C | 14 | 254 | 137465 | 769.49 | 648 | 641 | 177.8 |
| D | 15 | 142 | 1929681 | 11045.21 | 619 | 589 | 174.7 |
| D | 12 | 33 | 1545709 | 8846.74 | 619 | 589 | 174.7 |
| D | 15 | 234 | 216323 | 1235.21 | 619 | 589 | 174.7 |
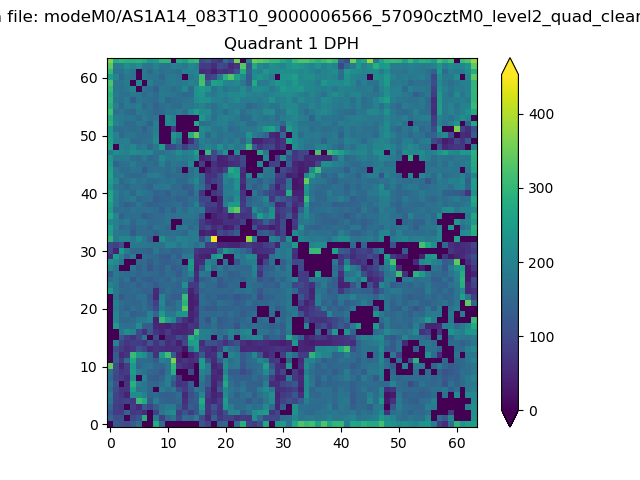
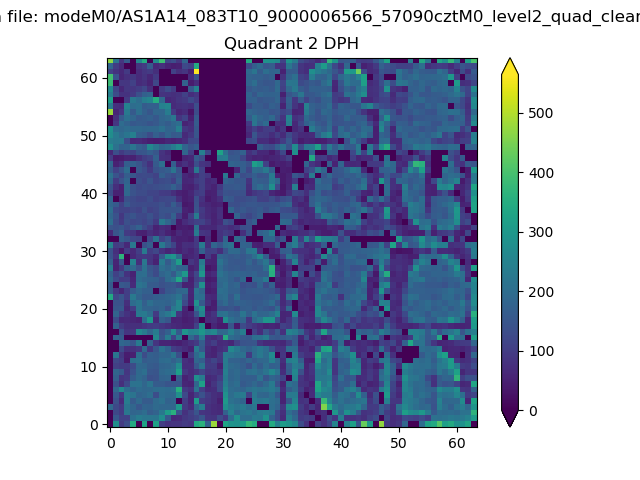
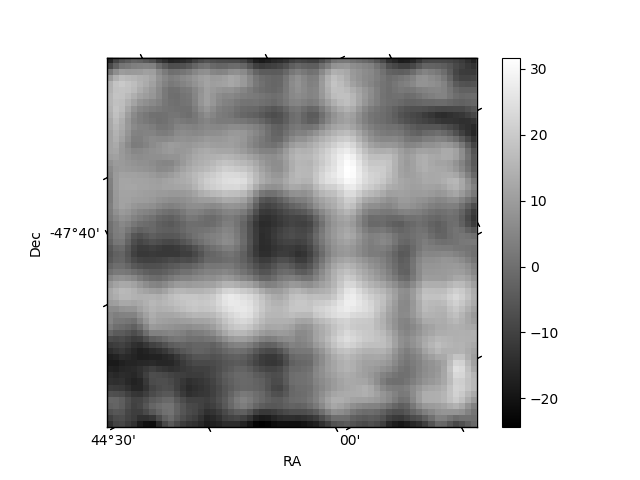
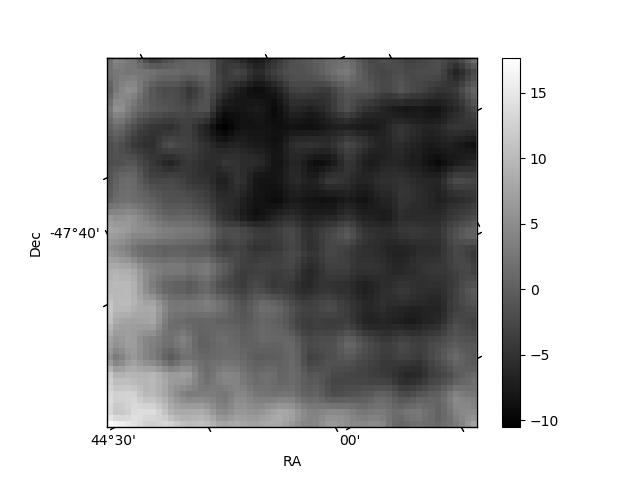
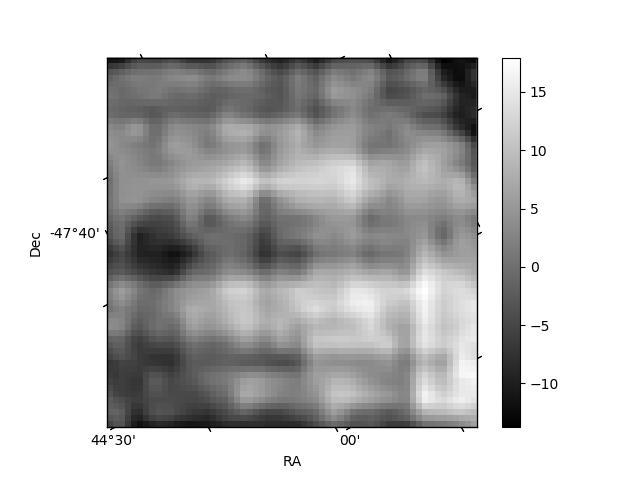
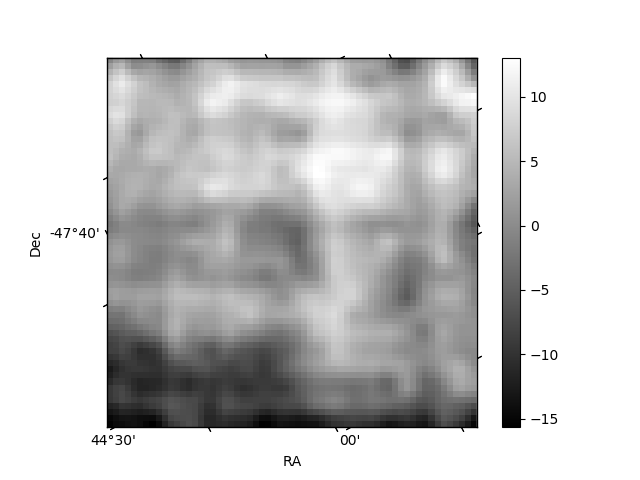
Histogram calculated using DETX and DETY for each event in the final _common_clean file
| Quadrant A |  |
 |
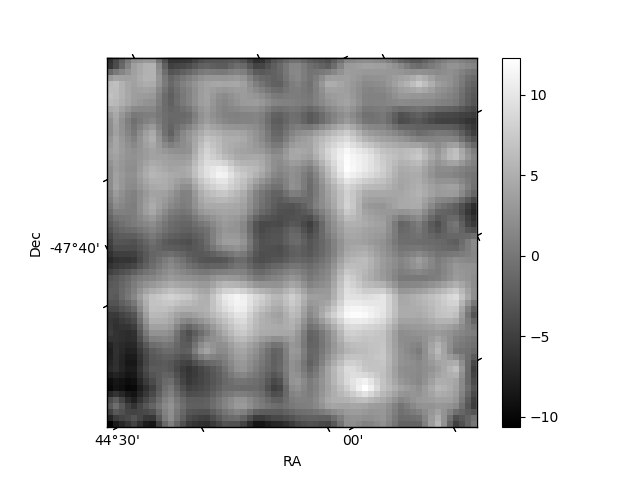
Quadrant B |
|---|---|---|---|
| Quadrant D | 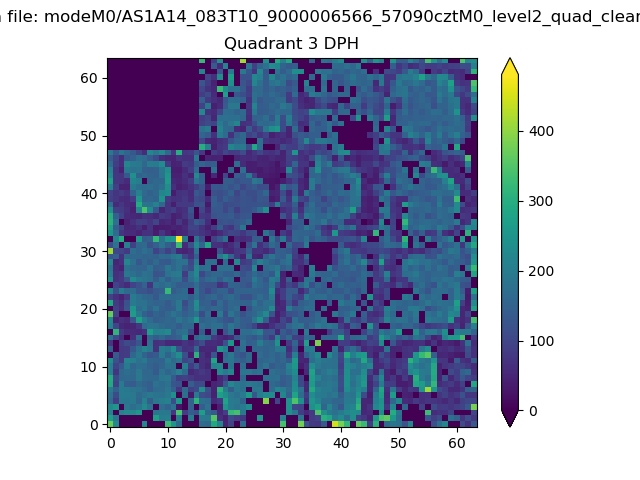 |
 |
Quadrant C |
| Plot type | Count rate plots | Images |
|---|---|---|
| Comparison with Poisson distribution Blue bars denote a histogram of data divided into 1 sec bins. Red curve is a Poisson curve with rate = median count rate of data. |
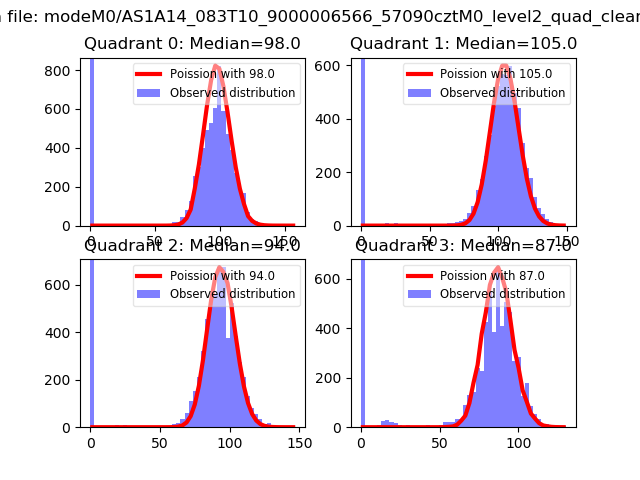 |
 |
| Quadrant-wise count rates Data is divided into 100 sec bins |
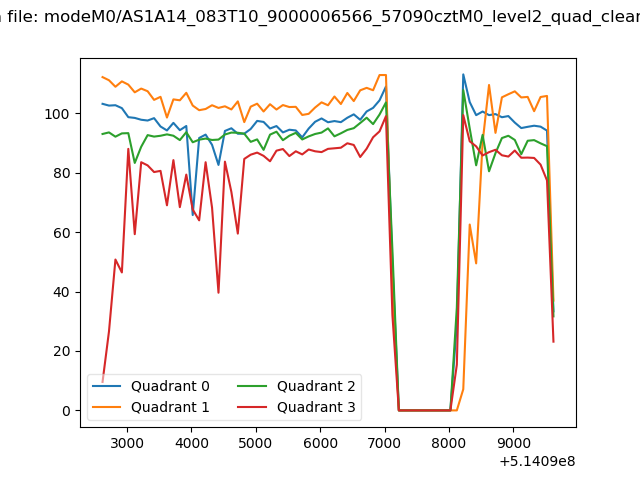 |
|
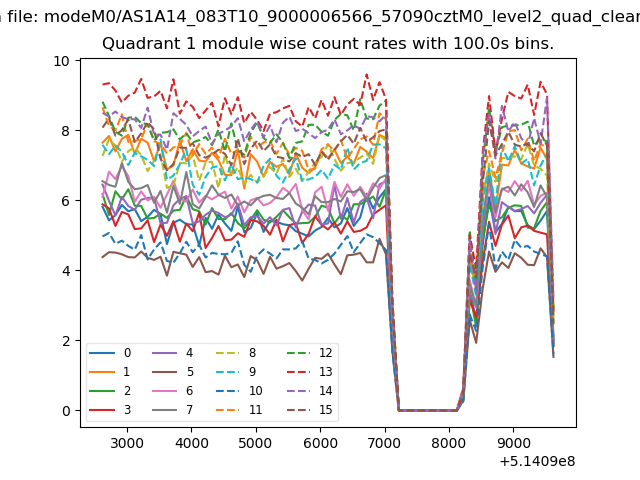
| Module-wise count rates for Quadrant A Data is divided into 100 sec bins |
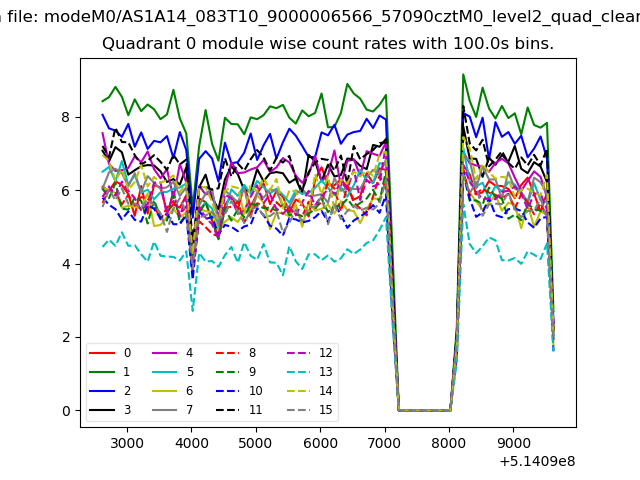 |
 |
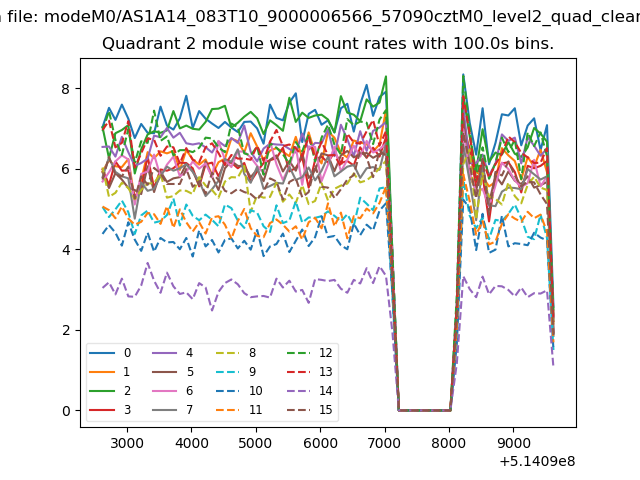
| Module-wise count rates for Quadrant B Data is divided into 100 sec bins |
 |
 |
| Module-wise count rates for Quadrant C Data is divided into 100 sec bins |
 |
 |
| Module-wise count rates for Quadrant D Data is divided into 100 sec bins |
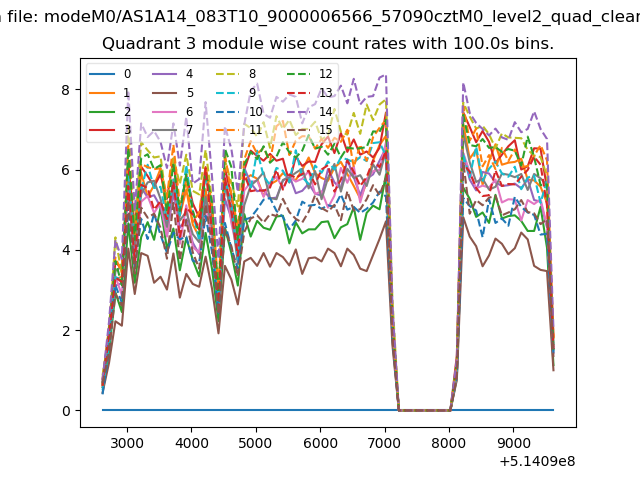 |
 |
| Parameter | Plot |
|---|---|
| CZT HV Monitor | 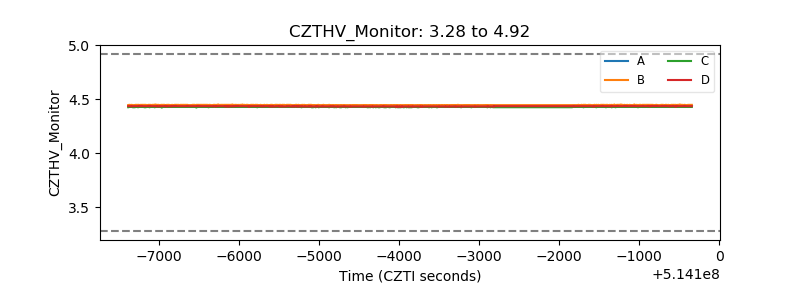 |
| D_VDD | 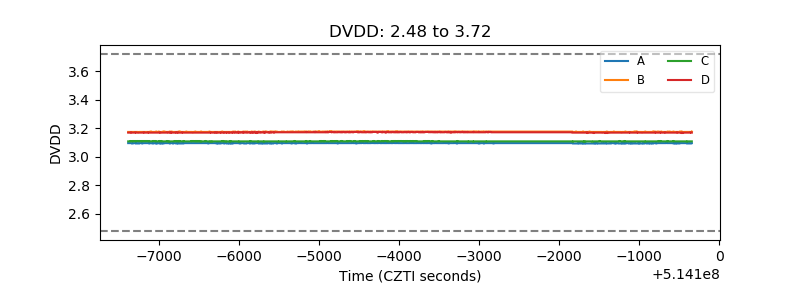 |
| Temperature 1 | 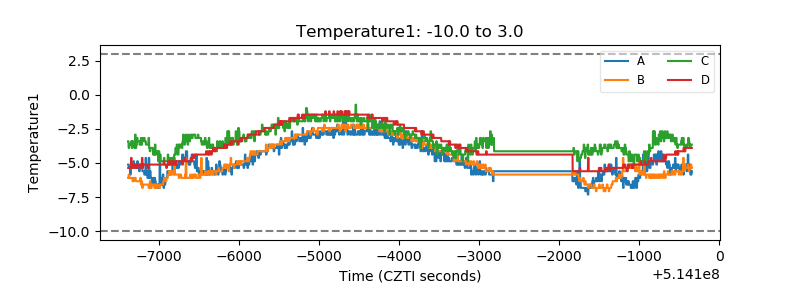 |
| Veto HV Monitor |  |
| Veto LLD | 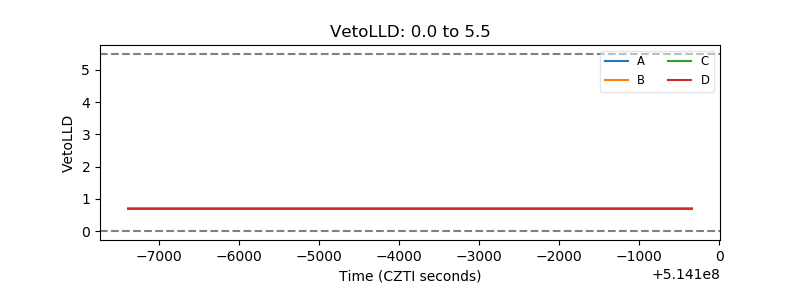 |
| Alpha Counter | 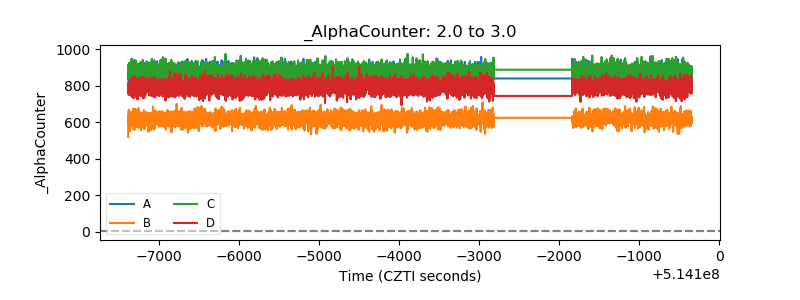 |
| _CPM_Rate | 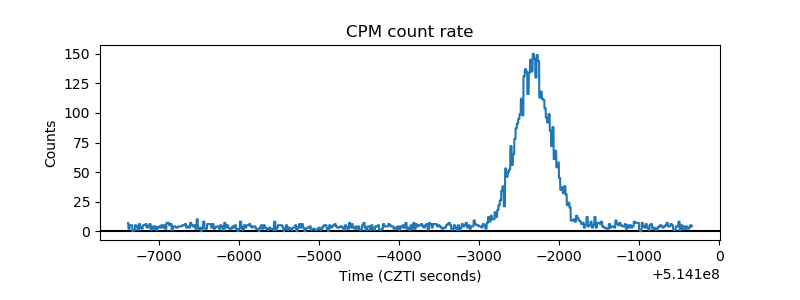 |
| CZT Counter | 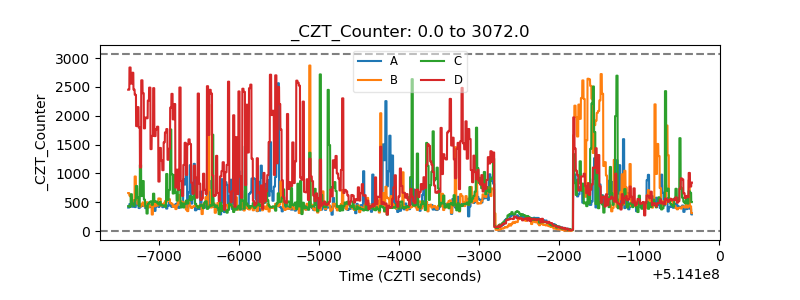 |
| +2.5 Volts monitor |  |
| +5 Volts monitor |  |
| _ROLL_ROT | 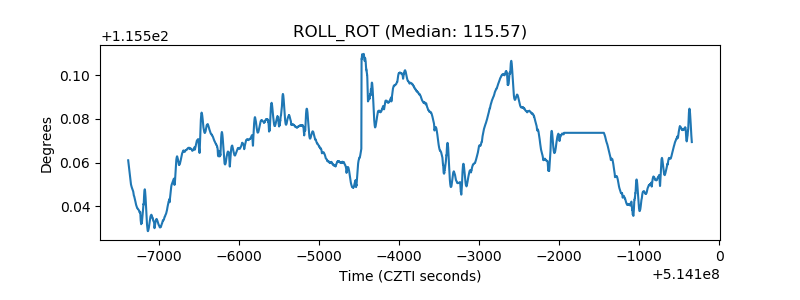 |
| _Roll_DEC | 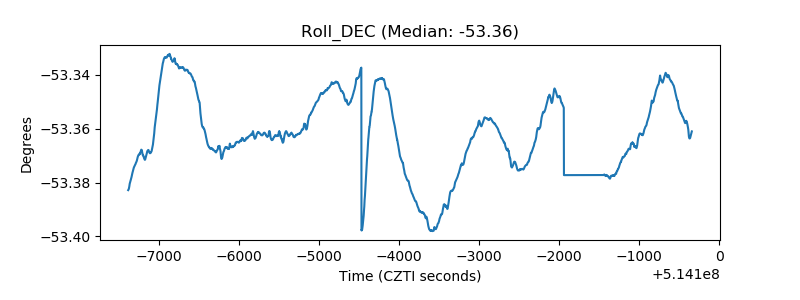 |
| _Roll_RA | 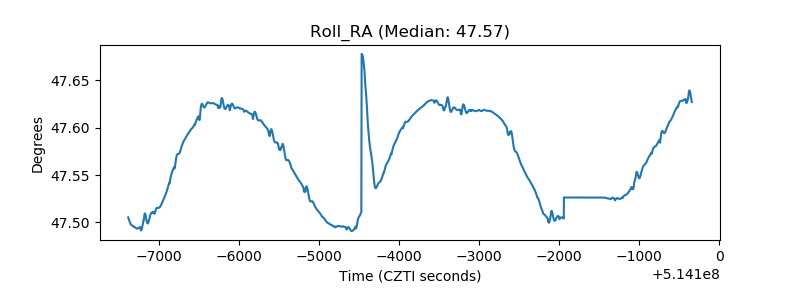 |
| Veto Counter | 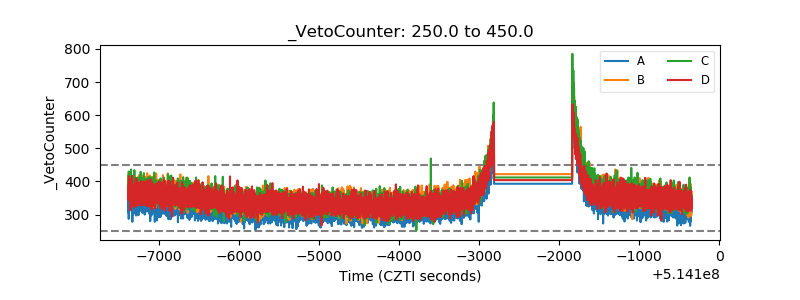 |