| Param | Original file | Final file |
|---|---|---|
| Filename | modeM0/AS1A14_083T10_9000006566_57091cztM0_level2.fits | modeM0/AS1A14_083T10_9000006566_57091cztM0_level2_quad_clean.evt |
| Size (bytes) | 484,796,160 | 97,243,200 |
| Size | 462.3 MB | 92.7 MB |
| Events in quadrant A | 4,700,870 | 624,705 |
| Events in quadrant B | 3,577,897 | 682,410 |
| Events in quadrant C | 4,573,241 | 597,490 |
| Events in quadrant D | 4,565,185 | 565,821 |
| Mode M9 | |||
|---|---|---|---|
| Quadrant | BADHDUFLAG | Total packets | Discarded packets |
| A | 0 | 5 | 0 |
| B | 0 | 5 | 0 |
| C | 0 | 5 | 0 |
| D | 0 | 5 | 0 |
| Mode M0 | |||
|---|---|---|---|
| Quadrant | BADHDUFLAG | Total packets | Discarded packets |
| A | 0 | 18681 | 2 |
| B | 0 | 15440 | 2 |
| C | 0 | 18365 | 2 |
| D | 0 | 18211 | 6 |
| Mode SS | |||
|---|---|---|---|
| Quadrant | BADHDUFLAG | Total packets | Discarded packets |
| A | 0 | 138 | 0 |
| B | 0 | 138 | 0 |
| C | 0 | 138 | 0 |
| D | 0 | 138 | 0 |
| Quadrant | Total seconds | Saturated seconds | Saturation percentage |
|---|---|---|---|
| A | 6801 | 407 | 5.984414% |
| B | 6801 | 247 | 3.631819% |
| C | 6801 | 449 | 6.601970% |
| D | 6800 | 316 | 4.647059% |
Noise dominated data is calculated using 1-second bins in cleaned event files. If a bin has >2000 counts, and if more than 50% of those come from <1% of pixels, then it is considered to be noise-dominated and hence unusable.
| Quadrant | # 1 sec bins | Bins with >0 counts | Bins with >2000 counts | High rate bins dominated by noise | Noise dominated (total time) | Noise dominated (detector-on time) | Marked lightcurve |
|---|---|---|---|---|---|---|---|
| A | 7371 | 6803 | 242 | 242 | 3.28% | 3.56% | 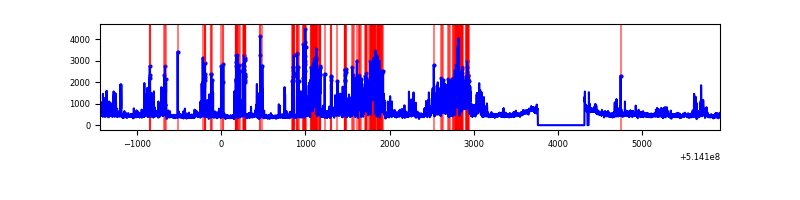 |
| B | 7371 | 6803 | 60 | 60 | 0.81% | 0.88% | 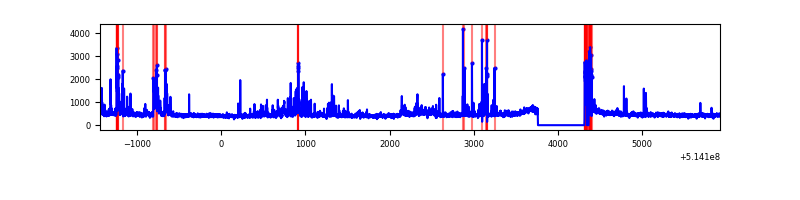 |
| C | 7371 | 6803 | 266 | 266 | 3.61% | 3.91% | 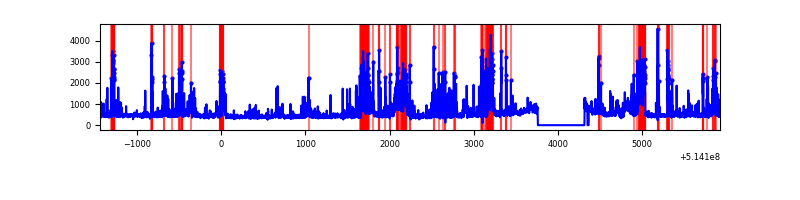 |
| D | 7370 | 6802 | 142 | 142 | 1.93% | 2.09% | 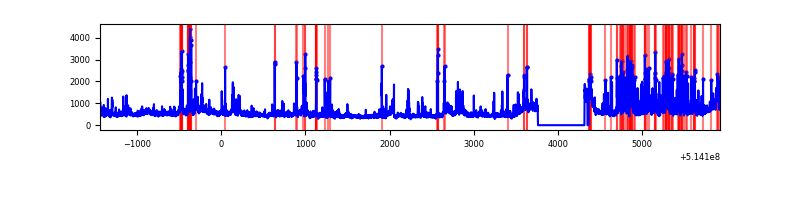 |
Top three noisy pixels from each quadrant. If the there are fewer than three noisy pixels in the level2.evt file, extra rows are filled as -1
| Pixel properties | Quadrant properties | ||||||
|---|---|---|---|---|---|---|---|
| Quadrant | DetID | PixID | Counts | Sigma | Mean | Median | Sigma |
| A | 4 | 249 | 1643431 | 9100.45 | 737 | 717 | 180.5 |
| A | 4 | 13 | 92641 | 509.25 | 737 | 717 | 180.5 |
| A | 5 | 113 | 40479 | 220.28 | 737 | 717 | 180.5 |
| B | 10 | 16 | 375036 | 2406.3 | 725 | 697 | 155.6 |
| B | 4 | 171 | 141094 | 902.49 | 725 | 697 | 155.6 |
| B | 7 | 252 | 53200 | 337.5 | 725 | 697 | 155.6 |
| C | 15 | 198 | 604100 | 3088.08 | 718 | 709 | 195.4 |
| C | 14 | 245 | 289733 | 1479.19 | 718 | 709 | 195.4 |
| C | 2 | 12 | 166654 | 849.29 | 718 | 709 | 195.4 |
| D | 15 | 142 | 672885 | 3320.79 | 718 | 683 | 202.4 |
| D | 12 | 33 | 647561 | 3195.68 | 718 | 683 | 202.4 |
| D | 2 | 249 | 135067 | 663.88 | 718 | 683 | 202.4 |
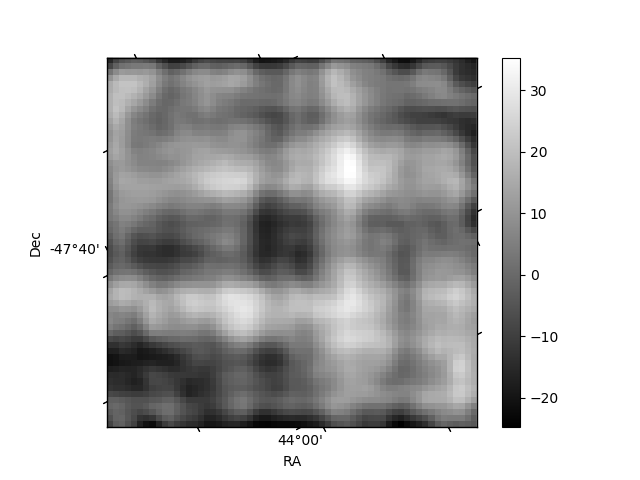
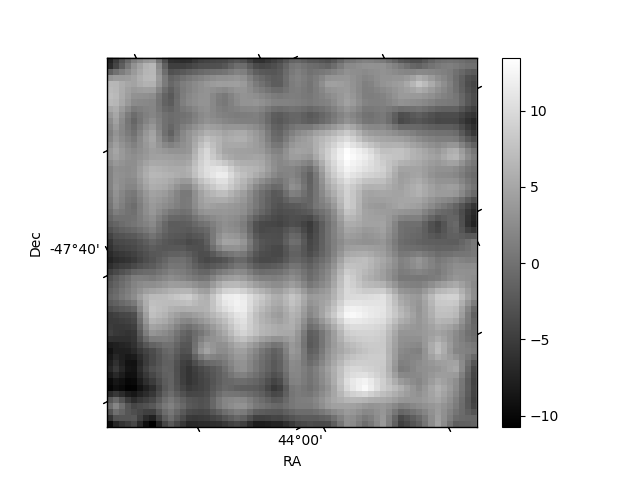
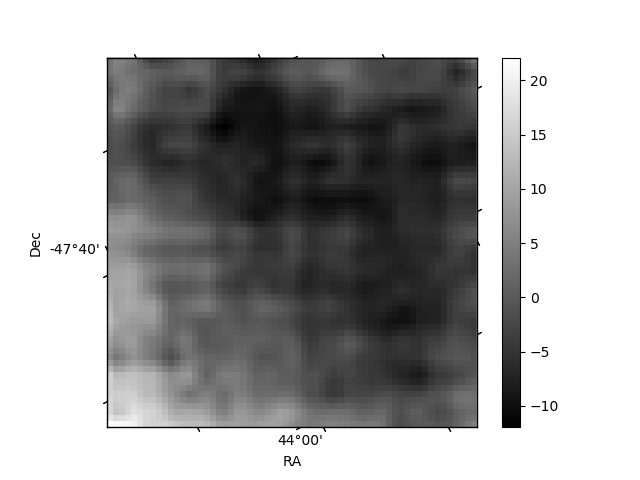
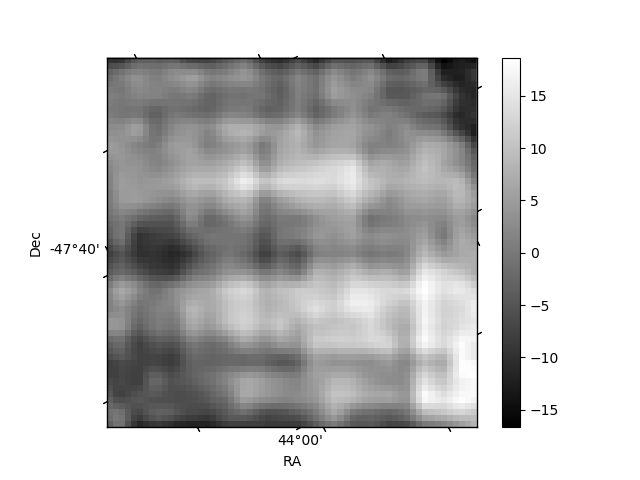
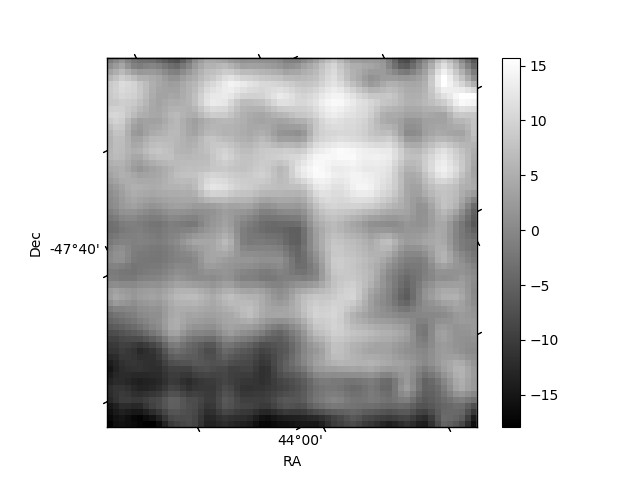
Histogram calculated using DETX and DETY for each event in the final _common_clean file
| Quadrant A | 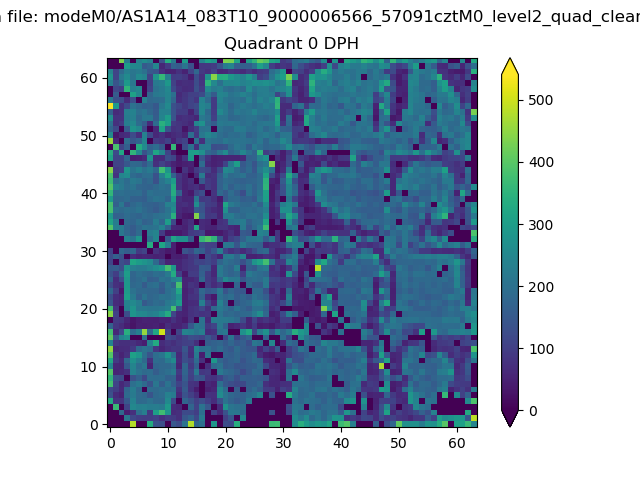 |
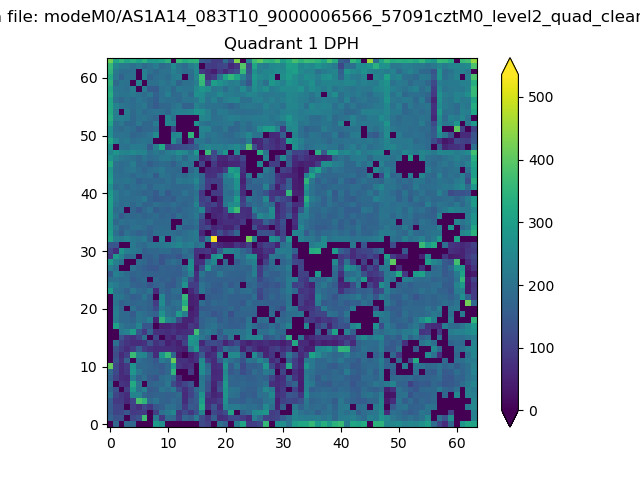 |
Quadrant B |
|---|---|---|---|
| Quadrant D | 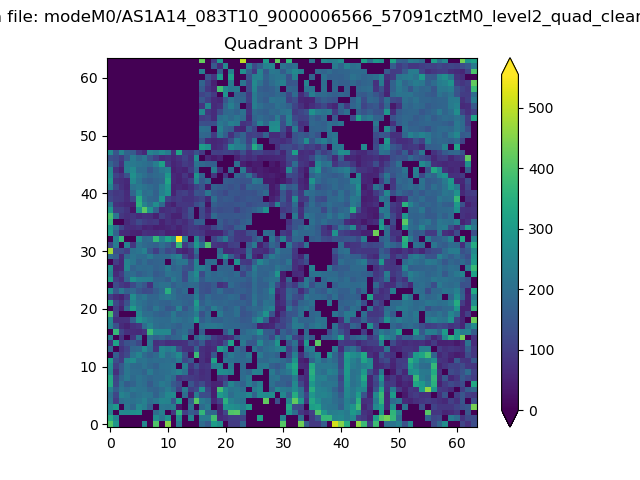 |
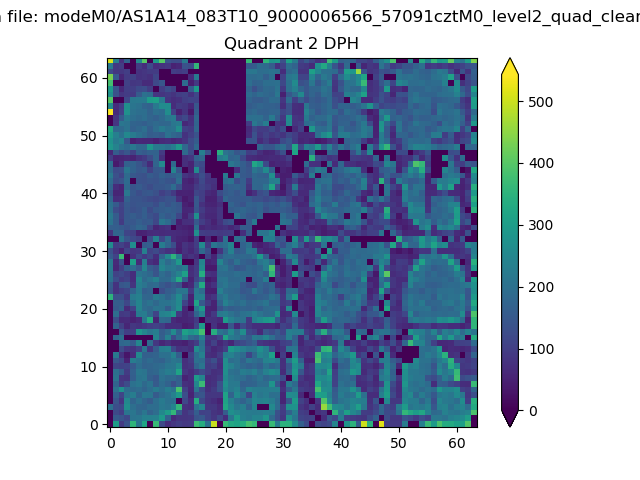 |
Quadrant C |
| Plot type | Count rate plots | Images |
|---|---|---|
| Comparison with Poisson distribution Blue bars denote a histogram of data divided into 1 sec bins. Red curve is a Poisson curve with rate = median count rate of data. |
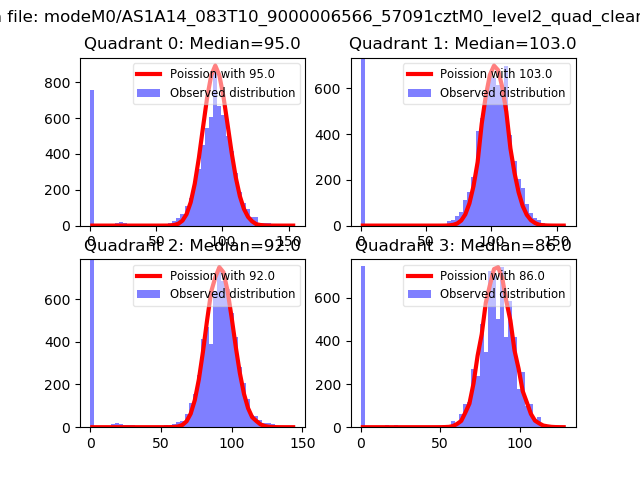 |
 |
| Quadrant-wise count rates Data is divided into 100 sec bins |
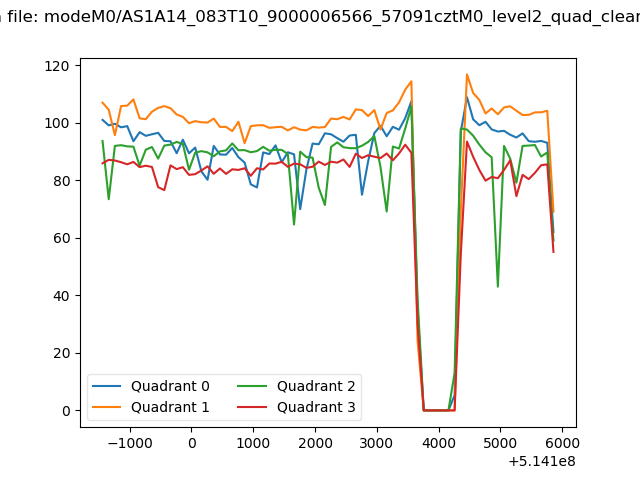 |
|
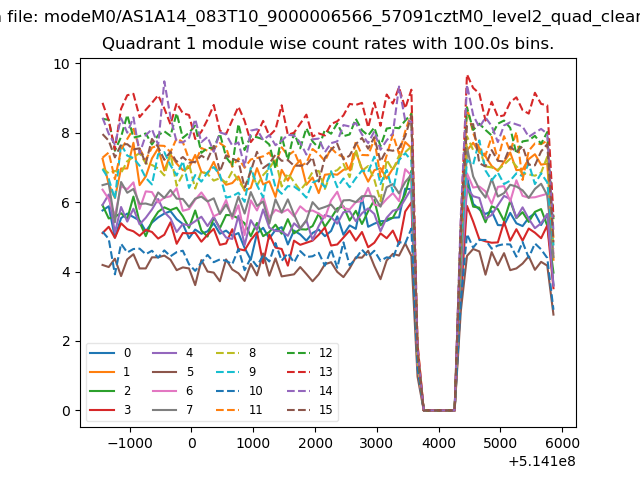
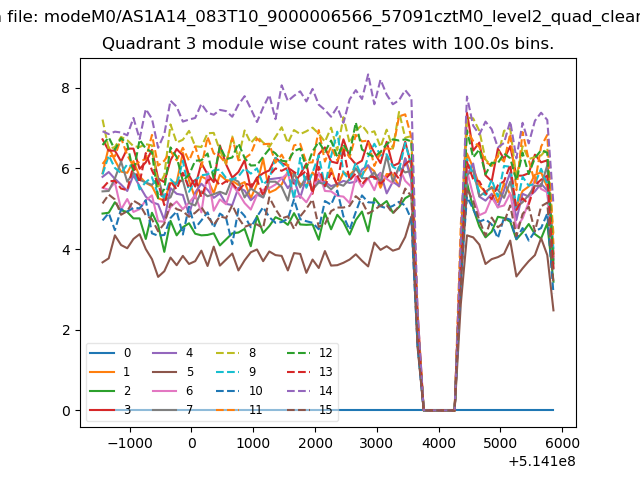
| Module-wise count rates for Quadrant A Data is divided into 100 sec bins |
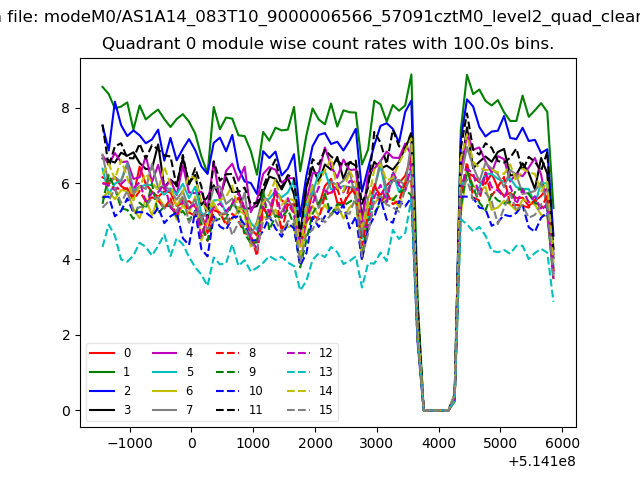 |
 |
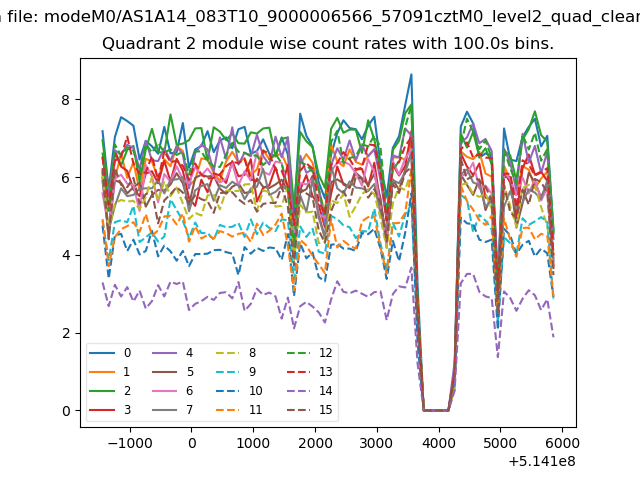
| Module-wise count rates for Quadrant B Data is divided into 100 sec bins |
 |
 |
| Module-wise count rates for Quadrant C Data is divided into 100 sec bins |
 |
 |
| Module-wise count rates for Quadrant D Data is divided into 100 sec bins |
 |
 |
| Parameter | Plot |
|---|---|
| CZT HV Monitor | 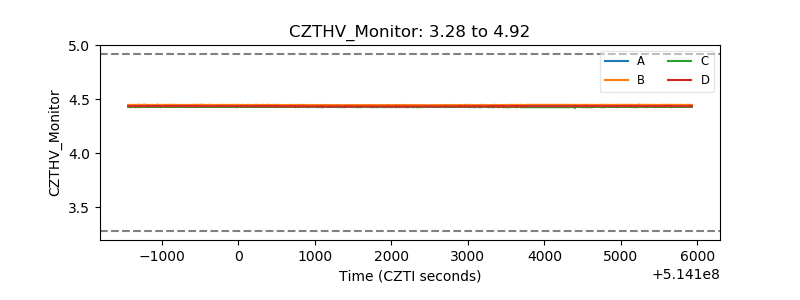 |
| D_VDD | 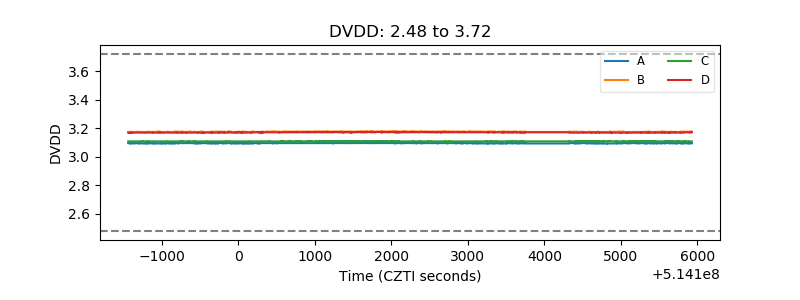 |
| Temperature 1 | 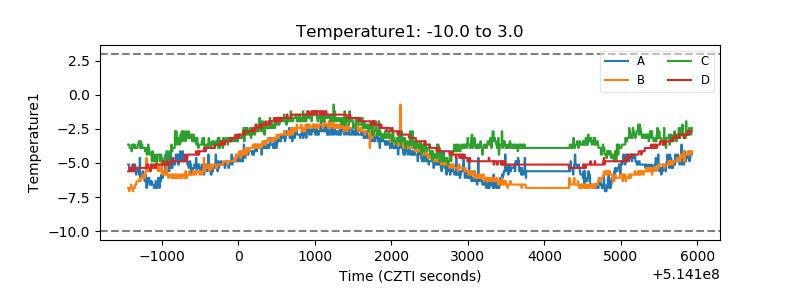 |
| Veto HV Monitor | 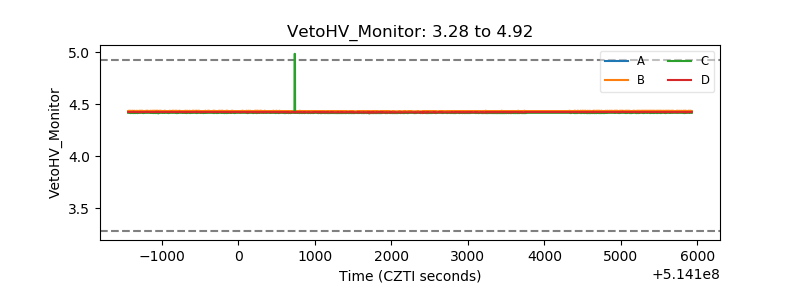 |
| Veto LLD | 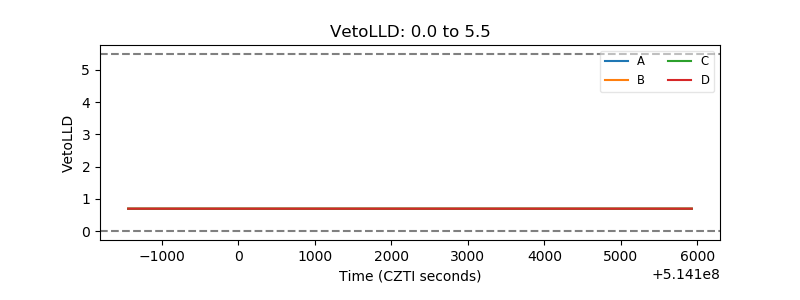 |
| Alpha Counter | 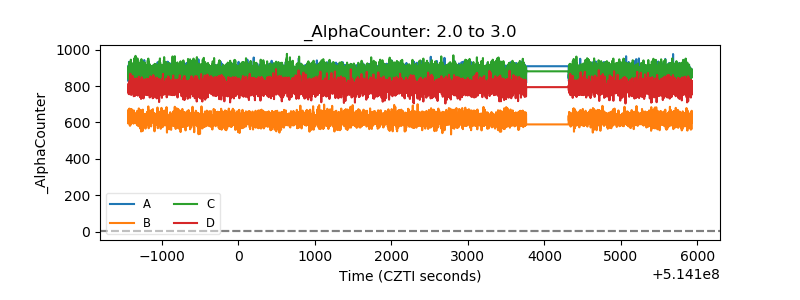 |
| _CPM_Rate | 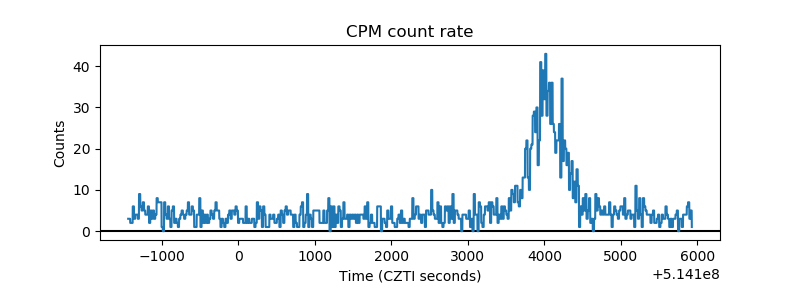 |
| CZT Counter | 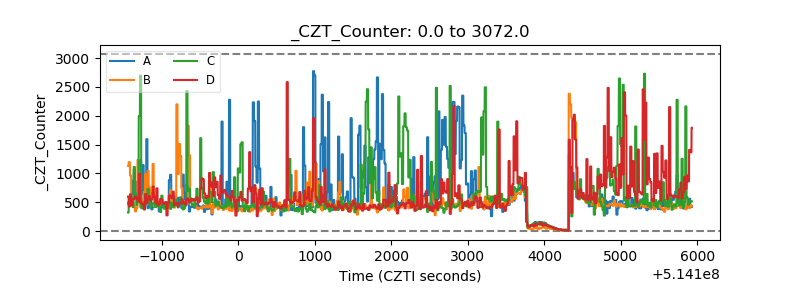 |
| +2.5 Volts monitor | 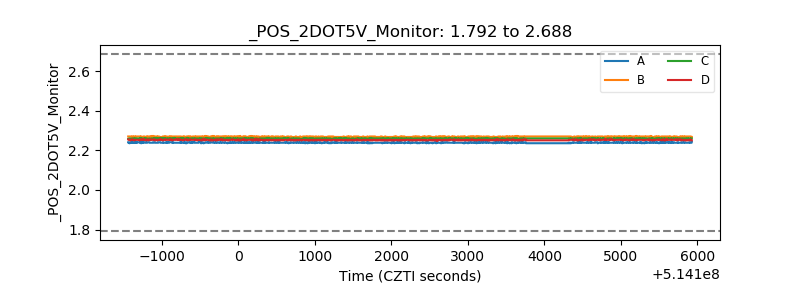 |
| +5 Volts monitor | 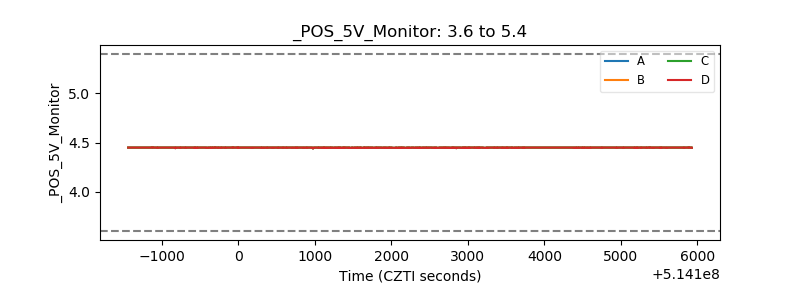 |
| _ROLL_ROT | 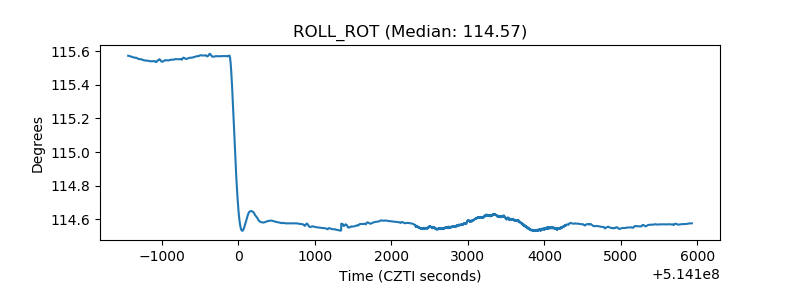 |
| _Roll_DEC | 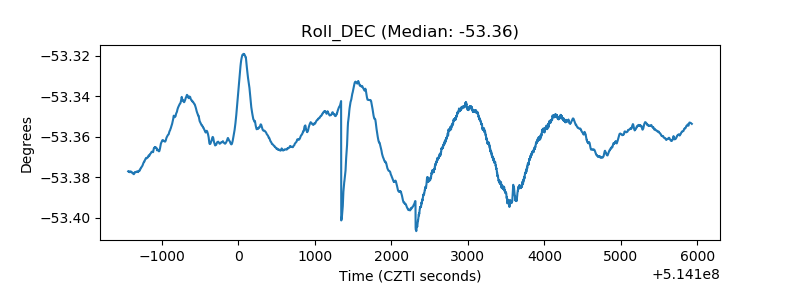 |
| _Roll_RA | 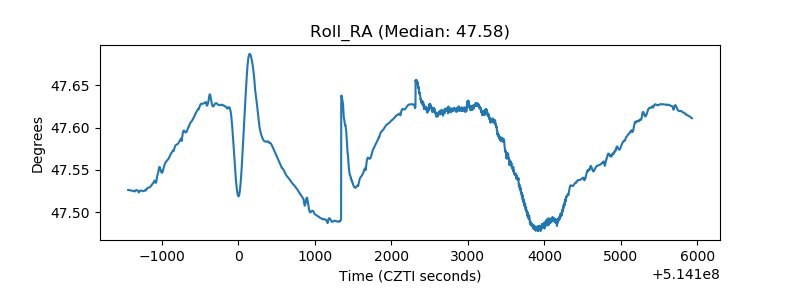 |
| Veto Counter | 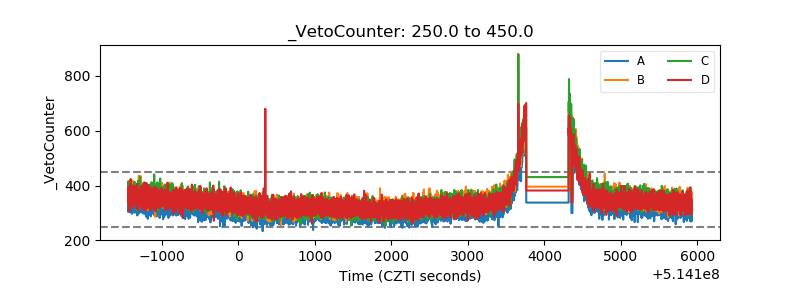 |