| Param | Original file | Final file |
|---|---|---|
| Filename | modeM0/AS1A14_083T10_9000006566_57092cztM0_level2.fits | modeM0/AS1A14_083T10_9000006566_57092cztM0_level2_quad_clean.evt |
| Size (bytes) | 592,358,400 | 111,925,440 |
| Size | 564.9 MB | 106.7 MB |
| Events in quadrant A | 3,824,581 | 744,014 |
| Events in quadrant B | 3,612,384 | 807,114 |
| Events in quadrant C | 4,753,724 | 699,966 |
| Events in quadrant D | 9,130,661 | 594,254 |
| Mode M0 | |||
|---|---|---|---|
| Quadrant | BADHDUFLAG | Total packets | Discarded packets |
| A | 0 | 16889 | 1 |
| B | 0 | 16465 | 0 |
| C | 0 | 19562 | 0 |
| D | 0 | 32623 | 0 |
| Mode SS | |||
|---|---|---|---|
| Quadrant | BADHDUFLAG | Total packets | Discarded packets |
| A | 0 | 158 | 0 |
| B | 0 | 158 | 0 |
| C | 0 | 158 | 0 |
| D | 0 | 158 | 0 |
| Quadrant | Total seconds | Saturated seconds | Saturation percentage |
|---|---|---|---|
| A | 7808 | 98 | 1.255123% |
| B | 7809 | 110 | 1.408631% |
| C | 7809 | 292 | 3.739275% |
| D | 7809 | 1087 | 13.919836% |
Noise dominated data is calculated using 1-second bins in cleaned event files. If a bin has >2000 counts, and if more than 50% of those come from <1% of pixels, then it is considered to be noise-dominated and hence unusable.
| Quadrant | # 1 sec bins | Bins with >0 counts | Bins with >2000 counts | High rate bins dominated by noise | Noise dominated (total time) | Noise dominated (detector-on time) | Marked lightcurve |
|---|---|---|---|---|---|---|---|
| A | 7808 | 7808 | 8 | 8 | 0.10% | 0.10% | 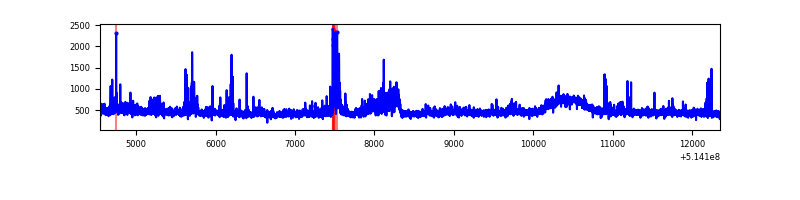 |
| B | 7809 | 7809 | 17 | 17 | 0.22% | 0.22% | 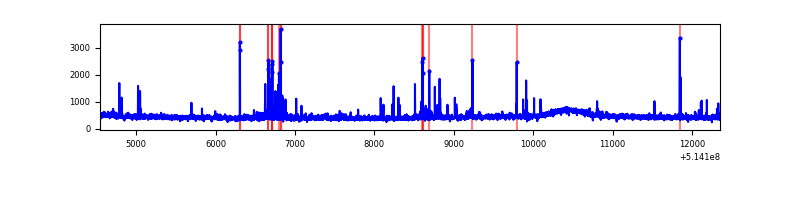 |
| C | 7809 | 7809 | 196 | 196 | 2.51% | 2.51% | 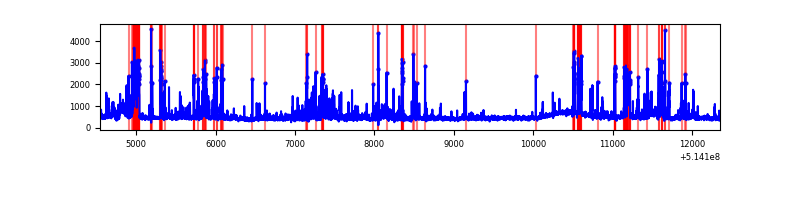 |
| D | 7809 | 7809 | 852 | 852 | 10.91% | 10.91% | 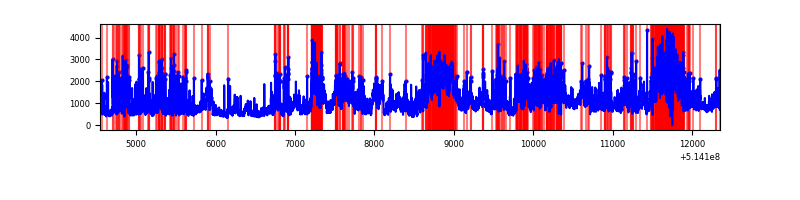 |
Top three noisy pixels from each quadrant. If the there are fewer than three noisy pixels in the level2.evt file, extra rows are filled as -1
| Pixel properties | Quadrant properties | ||||||
|---|---|---|---|---|---|---|---|
| Quadrant | DetID | PixID | Counts | Sigma | Mean | Median | Sigma |
| A | 4 | 13 | 291022 | 1354.62 | 867 | 844 | 214.2 |
| A | 5 | 113 | 89807 | 415.3 | 867 | 844 | 214.2 |
| A | 8 | 4 | 21065 | 94.4 | 867 | 844 | 214.2 |
| B | 0 | 213 | 63336 | 340.99 | 853 | 819 | 183.3 |
| B | 4 | 171 | 49421 | 265.09 | 853 | 819 | 183.3 |
| B | 10 | 247 | 31185 | 165.62 | 853 | 819 | 183.3 |
| C | 12 | 252 | 310424 | 1372.35 | 833 | 825 | 225.6 |
| C | 15 | 198 | 281789 | 1245.42 | 833 | 825 | 225.6 |
| C | 14 | 245 | 203919 | 900.25 | 833 | 825 | 225.6 |
| D | 15 | 142 | 3235874 | 14361.27 | 803 | 769 | 225.3 |
| D | 12 | 33 | 2336222 | 10367.54 | 803 | 769 | 225.3 |
| D | 8 | 240 | 118759 | 523.78 | 803 | 769 | 225.3 |
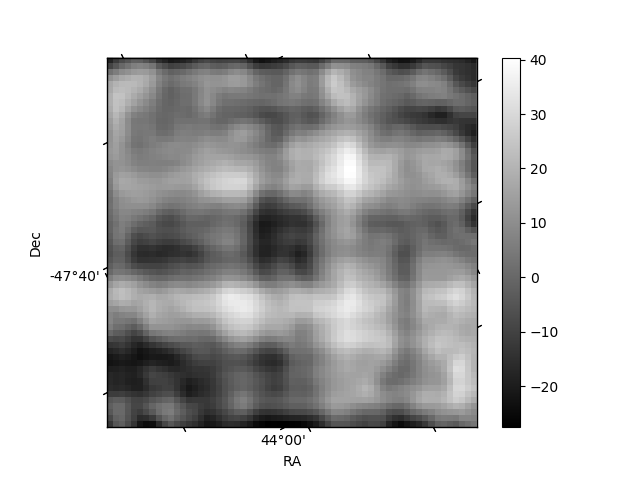
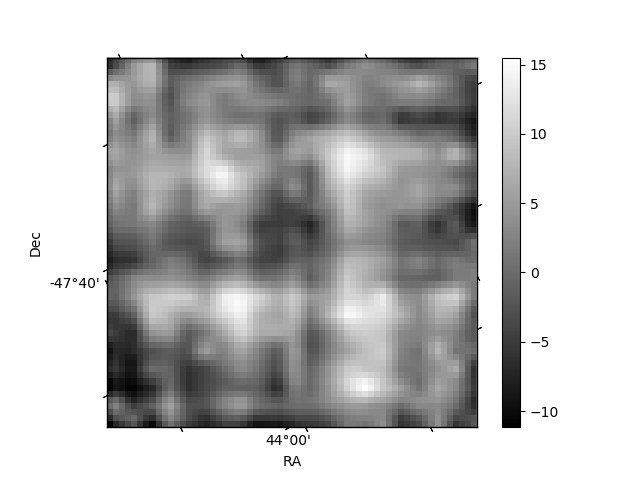
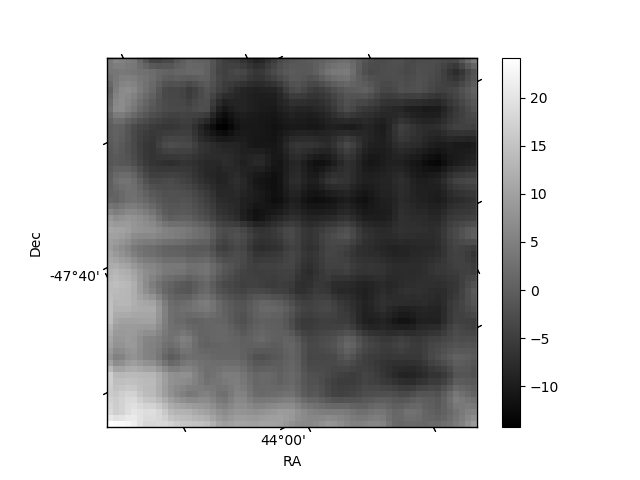
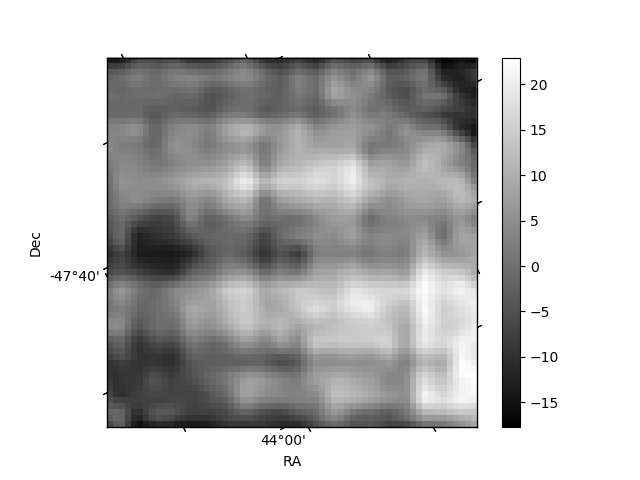
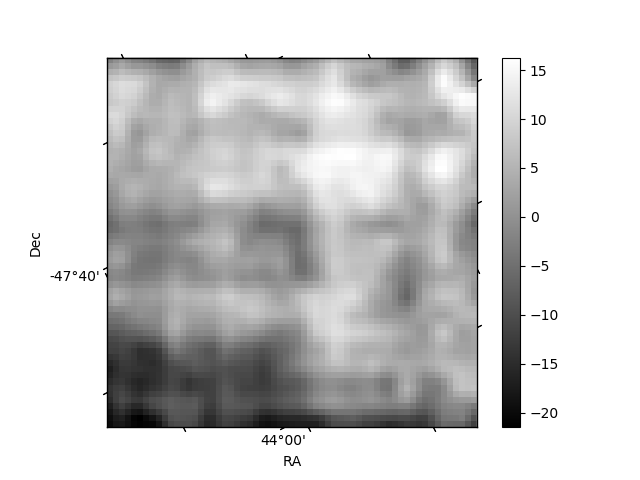
Histogram calculated using DETX and DETY for each event in the final _common_clean file
| Quadrant A | 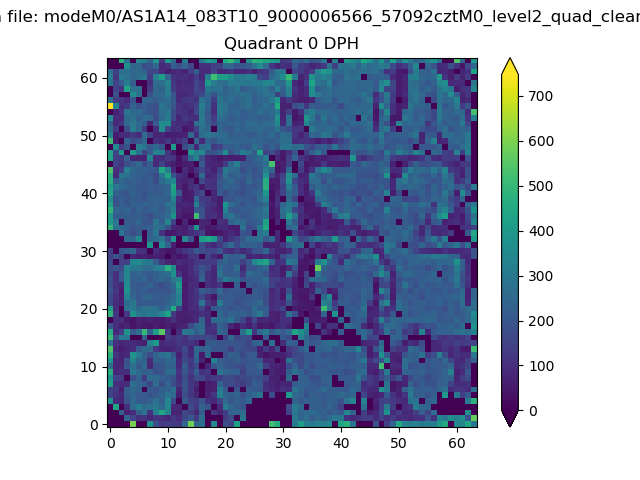 |
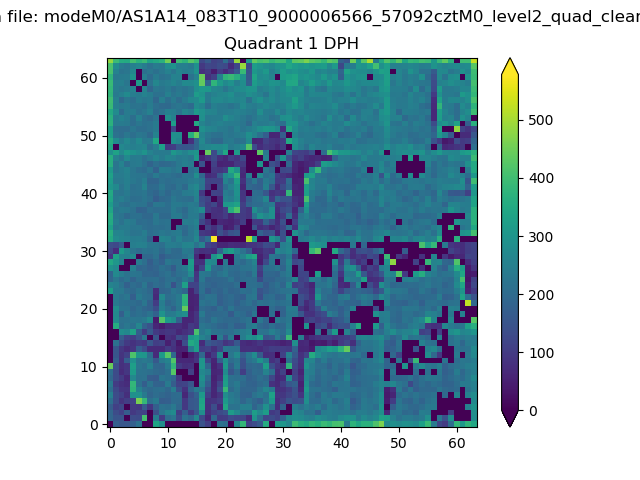 |
Quadrant B |
|---|---|---|---|
| Quadrant D | 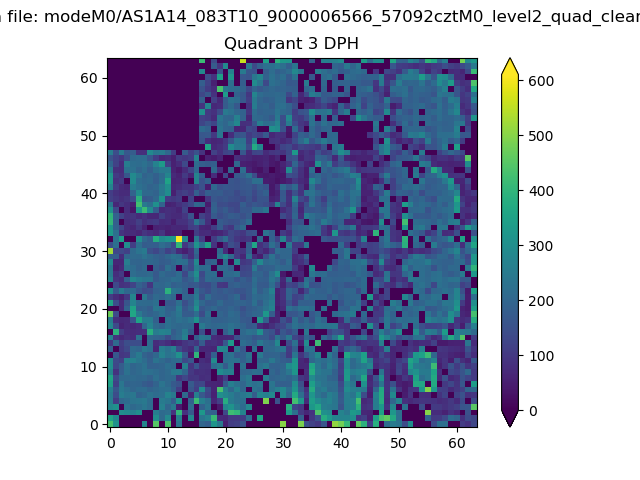 |
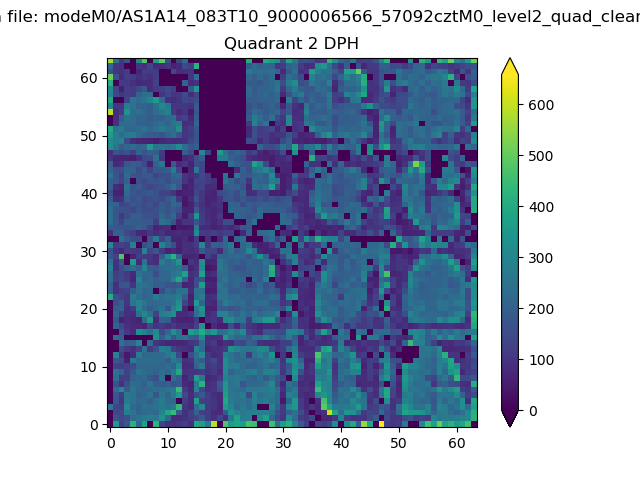 |
Quadrant C |
| Plot type | Count rate plots | Images |
|---|---|---|
| Comparison with Poisson distribution Blue bars denote a histogram of data divided into 1 sec bins. Red curve is a Poisson curve with rate = median count rate of data. |
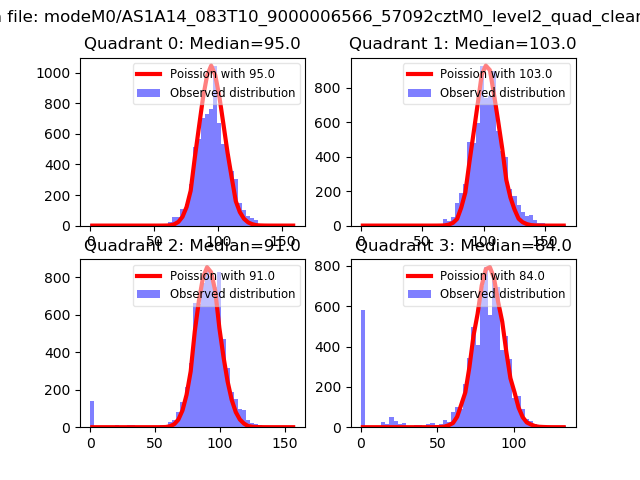 |
 |
| Quadrant-wise count rates Data is divided into 100 sec bins |
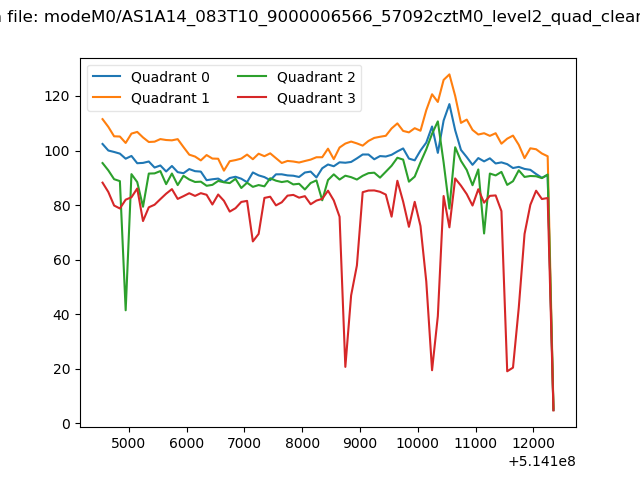 |
|
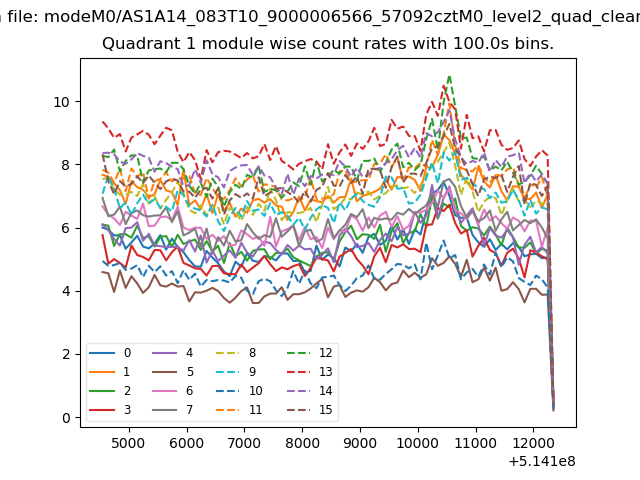
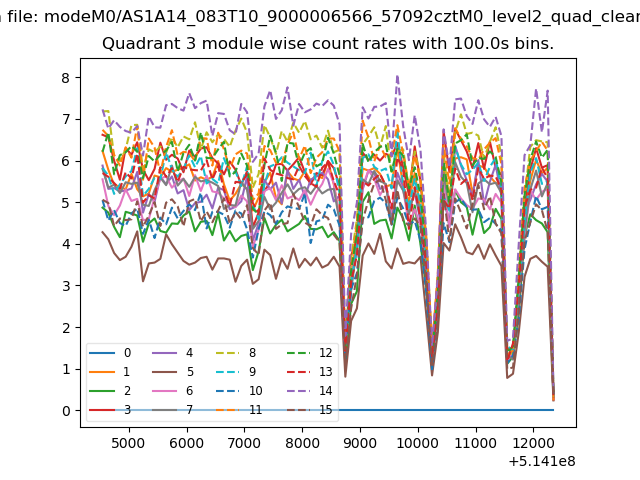
| Module-wise count rates for Quadrant A Data is divided into 100 sec bins |
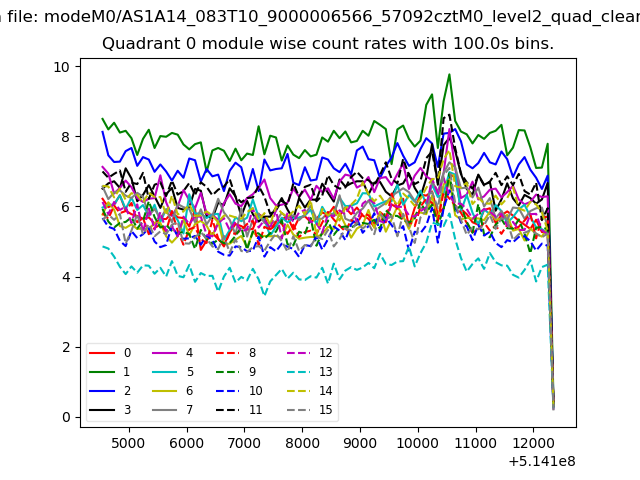 |
 |
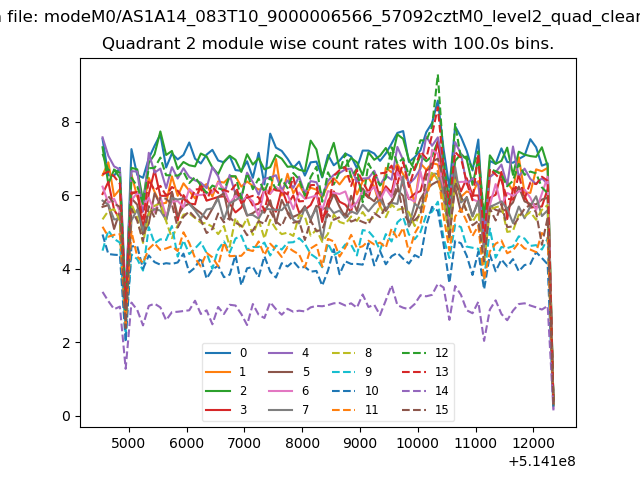
| Module-wise count rates for Quadrant B Data is divided into 100 sec bins |
 |
 |
| Module-wise count rates for Quadrant C Data is divided into 100 sec bins |
 |
 |
| Module-wise count rates for Quadrant D Data is divided into 100 sec bins |
 |
 |
| Parameter | Plot |
|---|---|
| CZT HV Monitor |  |
| D_VDD | 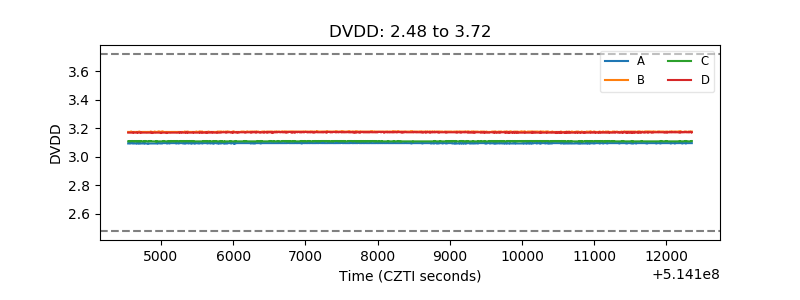 |
| Temperature 1 | 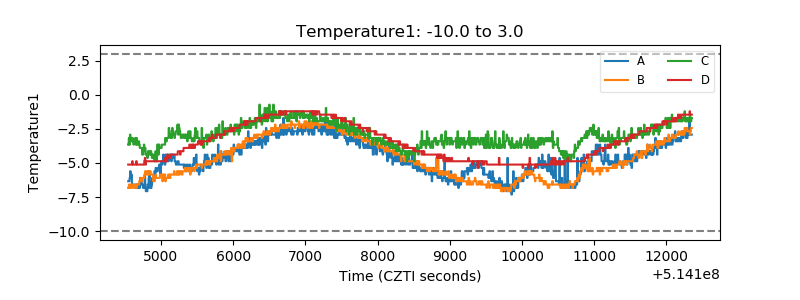 |
| Veto HV Monitor | 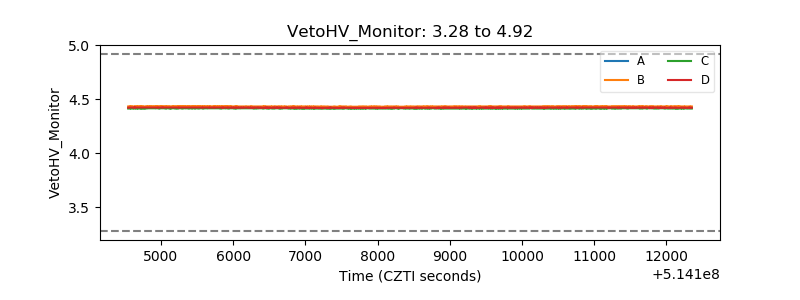 |
| Veto LLD | 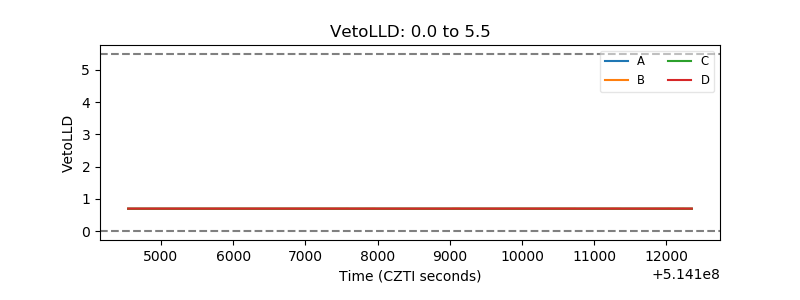 |
| Alpha Counter | 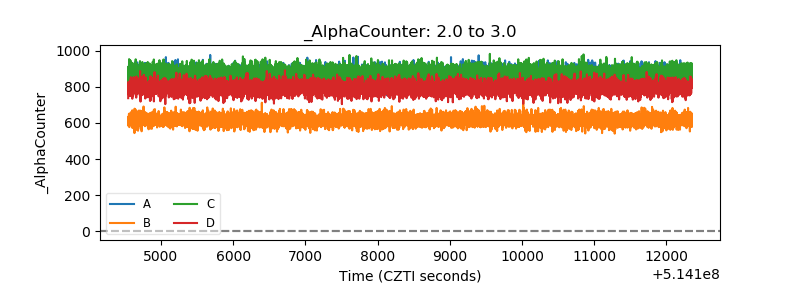 |
| _CPM_Rate | 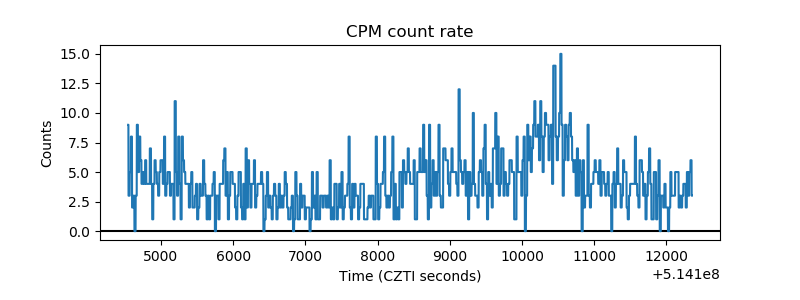 |
| CZT Counter | 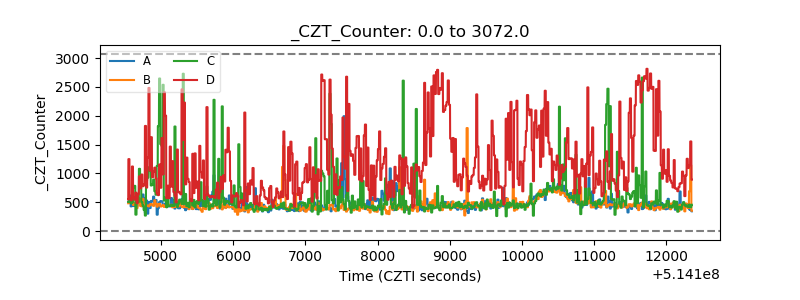 |
| +2.5 Volts monitor |  |
| +5 Volts monitor |  |
| _ROLL_ROT | 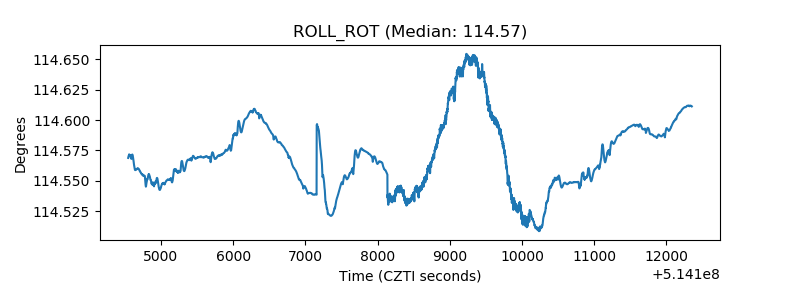 |
| _Roll_DEC | 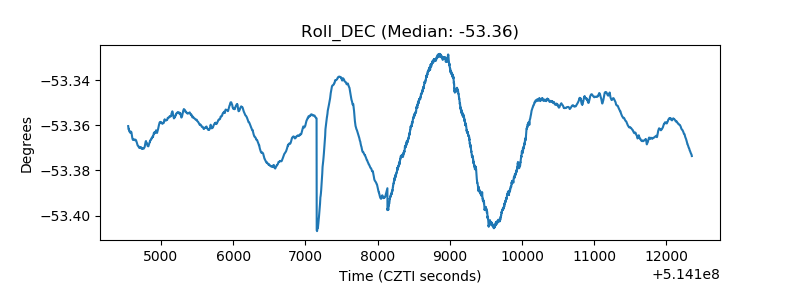 |
| _Roll_RA | 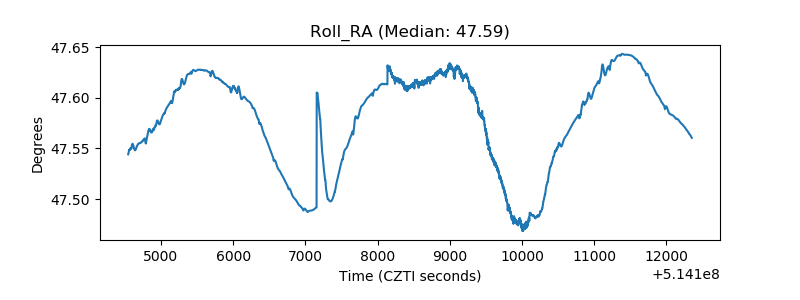 |
| Veto Counter | 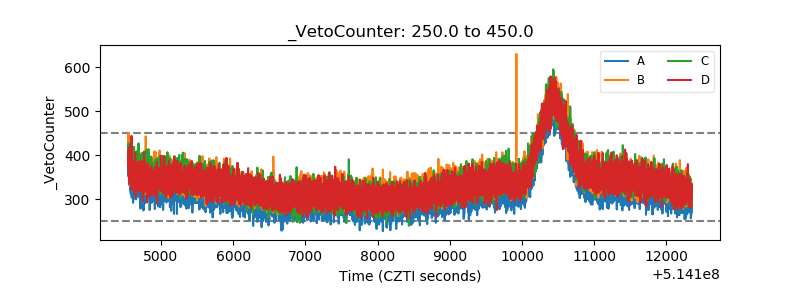 |