| Param | Original file | Final file |
|---|---|---|
| Filename | modeM0/AS1A14_083T10_9000006566_57093cztM0_level2.fits | modeM0/AS1A14_083T10_9000006566_57093cztM0_level2_quad_clean.evt |
| Size (bytes) | 617,227,200 | 104,391,360 |
| Size | 588.6 MB | 99.6 MB |
| Events in quadrant A | 6,786,594 | 616,084 |
| Events in quadrant B | 3,440,659 | 763,030 |
| Events in quadrant C | 3,842,031 | 676,578 |
| Events in quadrant D | 8,199,168 | 584,947 |
| Mode M0 | |||
|---|---|---|---|
| Quadrant | BADHDUFLAG | Total packets | Discarded packets |
| A | 0 | 25381 | 0 |
| B | 0 | 15568 | 0 |
| C | 0 | 16793 | 0 |
| D | 0 | 29477 | 1 |
| Mode SS | |||
|---|---|---|---|
| Quadrant | BADHDUFLAG | Total packets | Discarded packets |
| A | 0 | 150 | 0 |
| B | 0 | 150 | 0 |
| C | 0 | 150 | 0 |
| D | 0 | 150 | 0 |
| Quadrant | Total seconds | Saturated seconds | Saturation percentage |
|---|---|---|---|
| A | 7471 | 1054 | 14.107884% |
| B | 7471 | 37 | 0.495248% |
| C | 7472 | 101 | 1.351713% |
| D | 7471 | 787 | 10.534065% |
Noise dominated data is calculated using 1-second bins in cleaned event files. If a bin has >2000 counts, and if more than 50% of those come from <1% of pixels, then it is considered to be noise-dominated and hence unusable.
| Quadrant | # 1 sec bins | Bins with >0 counts | Bins with >2000 counts | High rate bins dominated by noise | Noise dominated (total time) | Noise dominated (detector-on time) | Marked lightcurve |
|---|---|---|---|---|---|---|---|
| A | 7471 | 7471 | 854 | 854 | 11.43% | 11.43% | 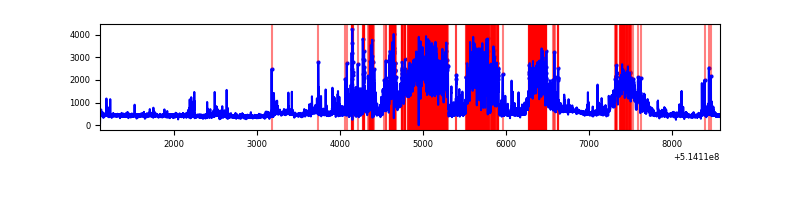 |
| B | 7471 | 7471 | 6 | 6 | 0.08% | 0.08% | 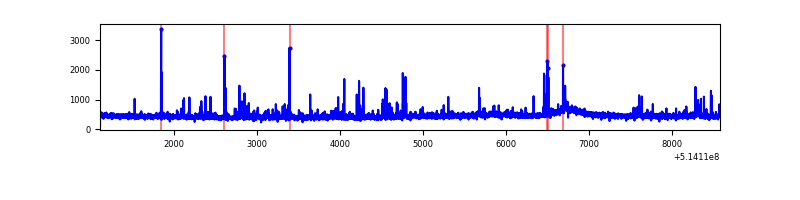 |
| C | 7472 | 7472 | 86 | 86 | 1.15% | 1.15% | 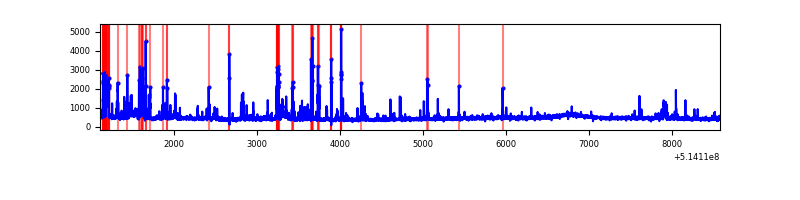 |
| D | 7471 | 7471 | 847 | 847 | 11.34% | 11.34% | 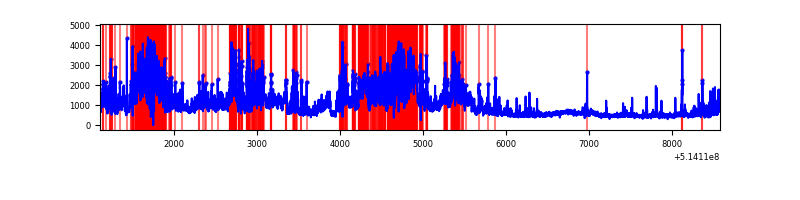 |
Top three noisy pixels from each quadrant. If the there are fewer than three noisy pixels in the level2.evt file, extra rows are filled as -1
| Pixel properties | Quadrant properties | ||||||
|---|---|---|---|---|---|---|---|
| Quadrant | DetID | PixID | Counts | Sigma | Mean | Median | Sigma |
| A | 4 | 13 | 3597833 | 19000.1 | 767 | 747 | 189.3 |
| A | 5 | 113 | 83558 | 437.41 | 767 | 747 | 189.3 |
| A | 13 | 248 | 56670 | 295.39 | 767 | 747 | 189.3 |
| B | 4 | 171 | 94078 | 538.91 | 799 | 770 | 173.1 |
| B | 7 | 252 | 28251 | 158.72 | 799 | 770 | 173.1 |
| B | 10 | 247 | 24433 | 136.67 | 799 | 770 | 173.1 |
| C | 14 | 245 | 164881 | 762.94 | 788 | 780 | 215.1 |
| C | 12 | 252 | 163060 | 754.47 | 788 | 780 | 215.1 |
| C | 14 | 254 | 162953 | 753.98 | 788 | 780 | 215.1 |
| D | 15 | 142 | 2677487 | 12572.37 | 757 | 722 | 212.9 |
| D | 12 | 33 | 2201527 | 10336.86 | 757 | 722 | 212.9 |
| D | 7 | 96 | 83003 | 386.46 | 757 | 722 | 212.9 |
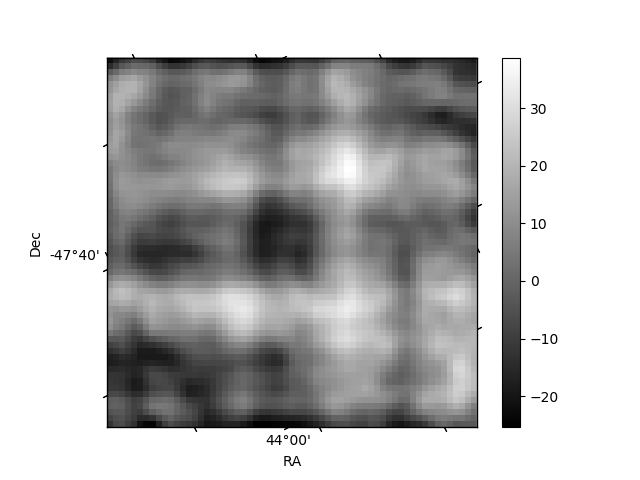
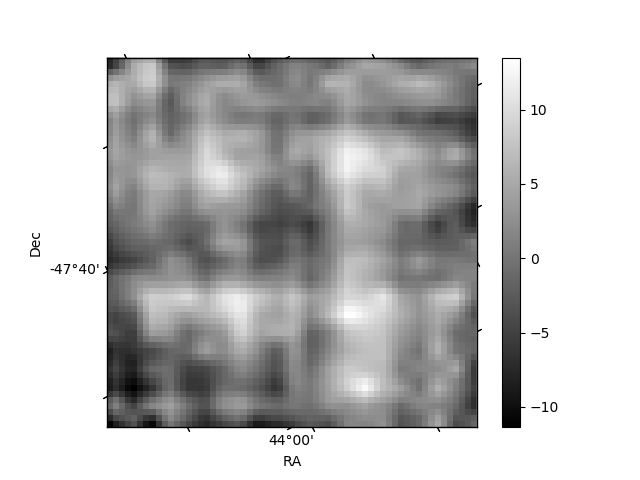
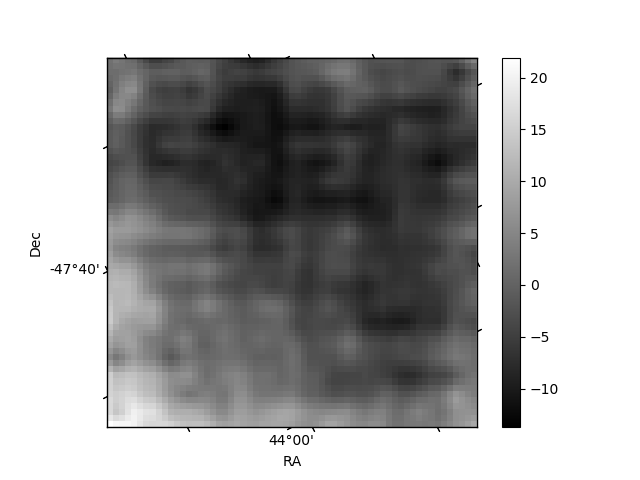
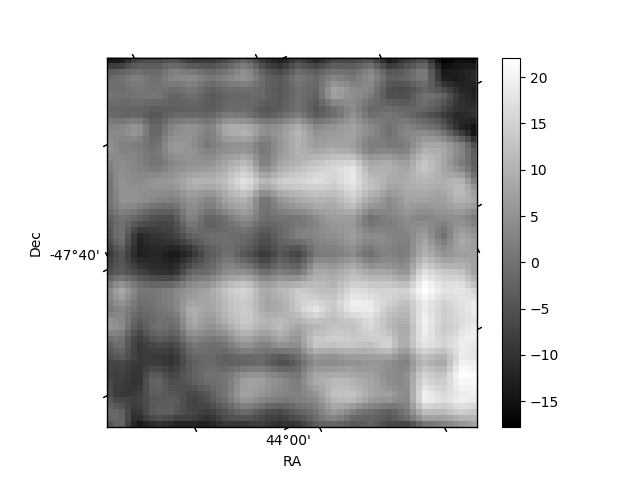
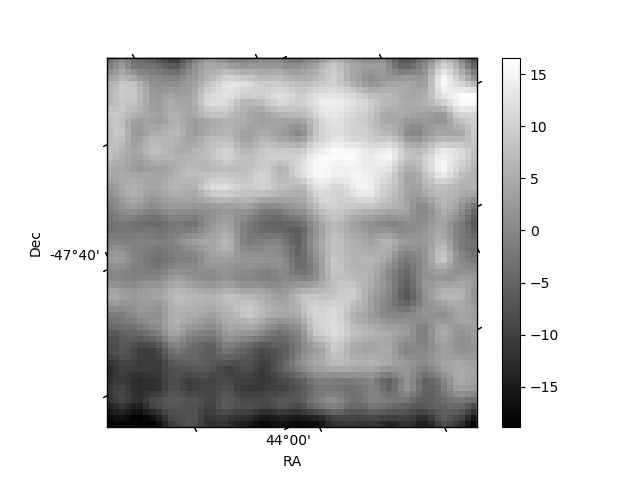
Histogram calculated using DETX and DETY for each event in the final _common_clean file
| Quadrant A | 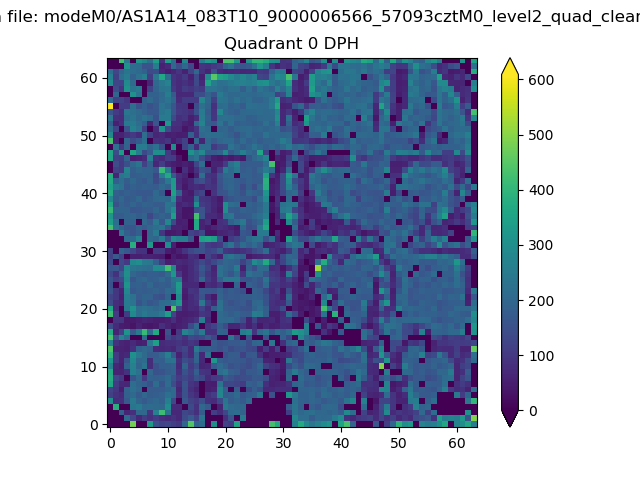 |
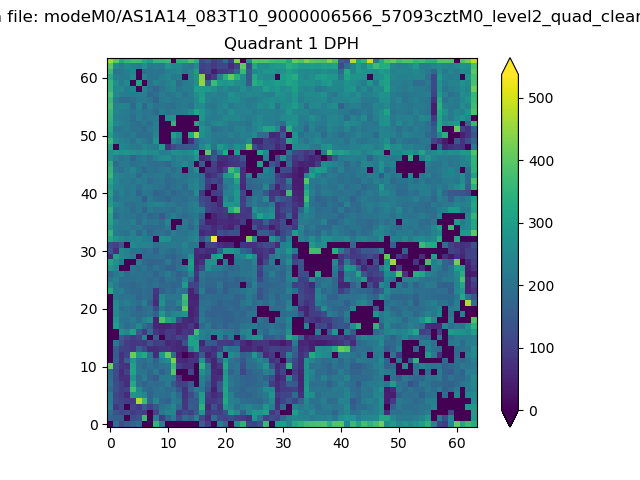 |
Quadrant B |
|---|---|---|---|
| Quadrant D | 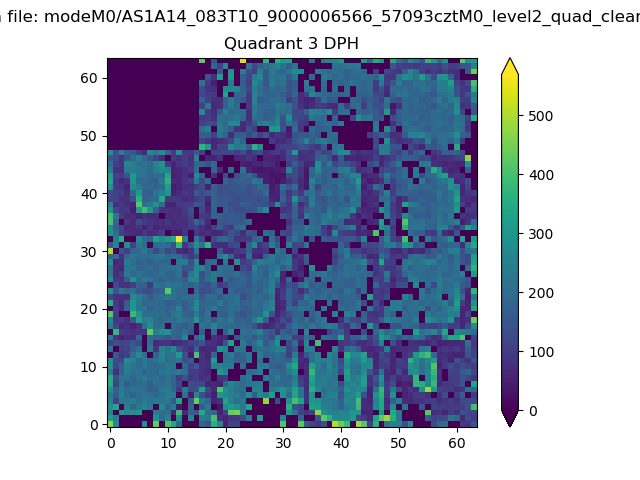 |
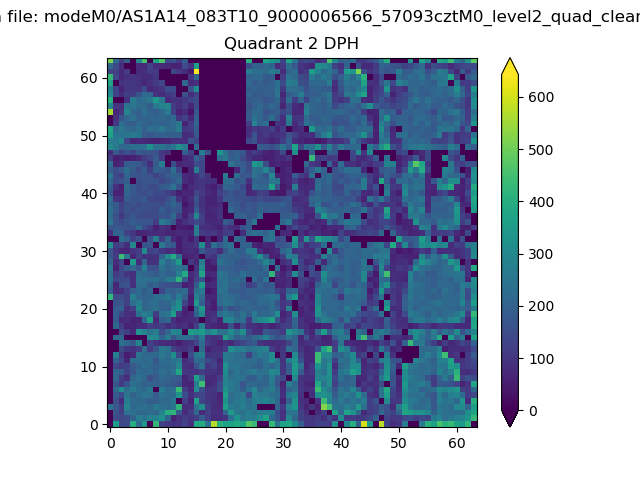 |
Quadrant C |
| Plot type | Count rate plots | Images |
|---|---|---|
| Comparison with Poisson distribution Blue bars denote a histogram of data divided into 1 sec bins. Red curve is a Poisson curve with rate = median count rate of data. |
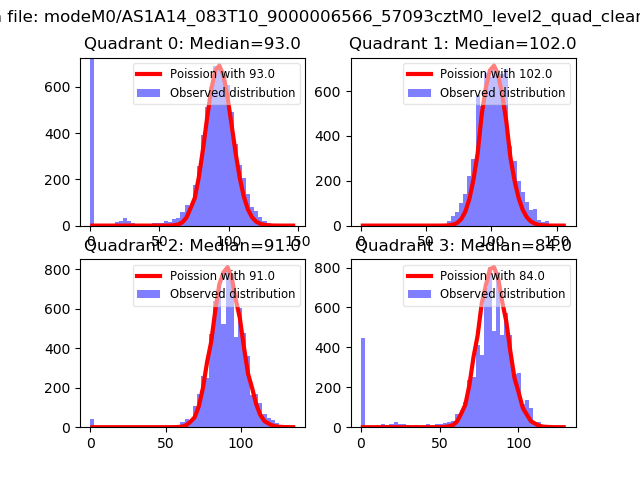 |
 |
| Quadrant-wise count rates Data is divided into 100 sec bins |
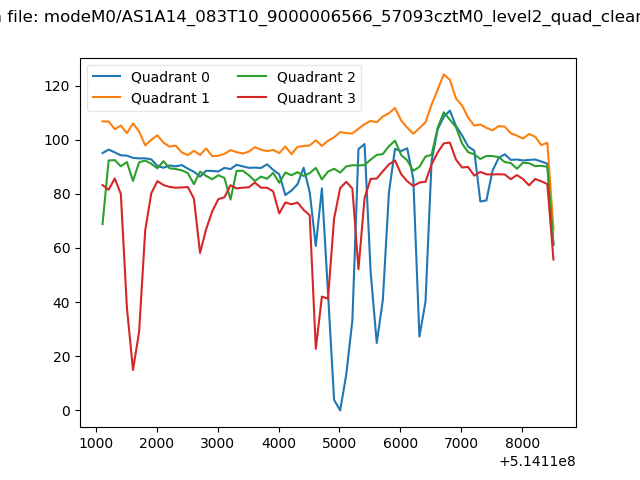 |
|
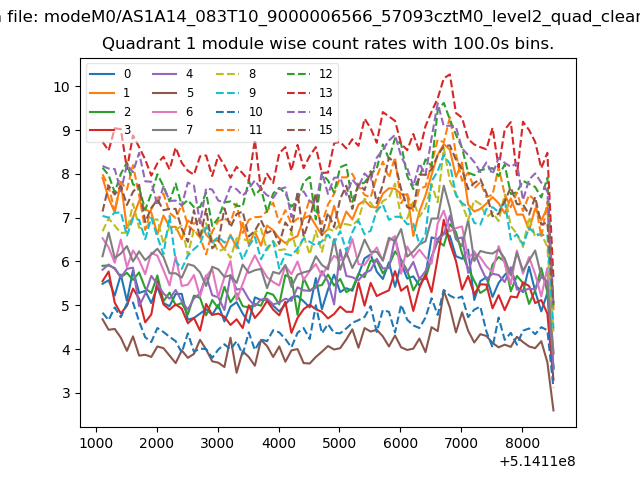
| Module-wise count rates for Quadrant A Data is divided into 100 sec bins |
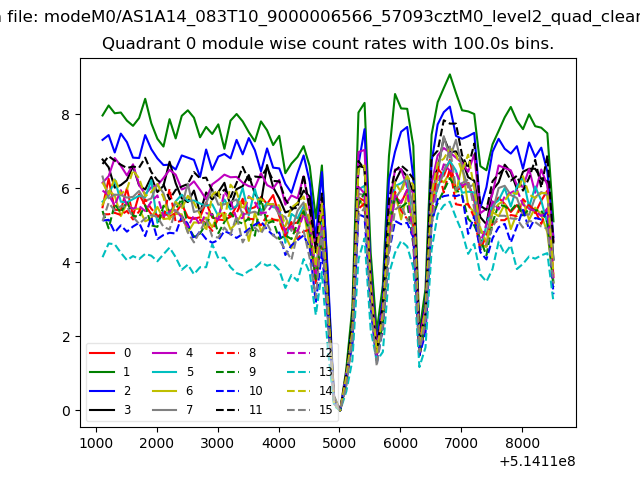 |
 |
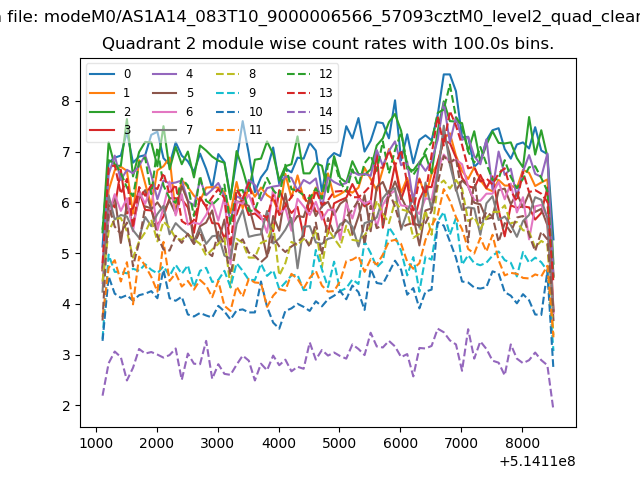
| Module-wise count rates for Quadrant B Data is divided into 100 sec bins |
 |
 |
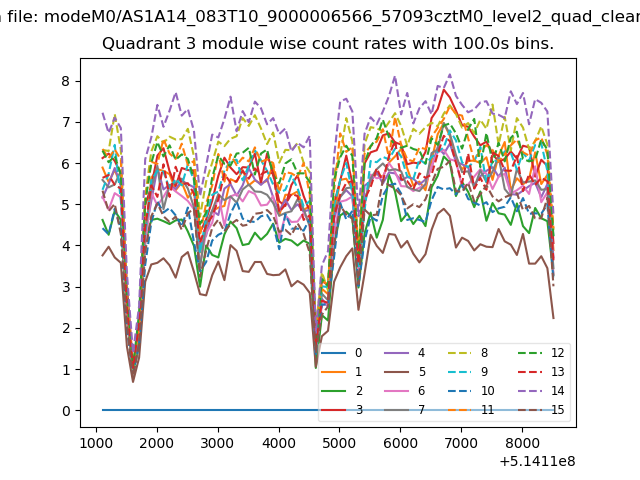
| Module-wise count rates for Quadrant C Data is divided into 100 sec bins |
 |
 |
| Module-wise count rates for Quadrant D Data is divided into 100 sec bins |
 |
 |
| Parameter | Plot |
|---|---|
| CZT HV Monitor | 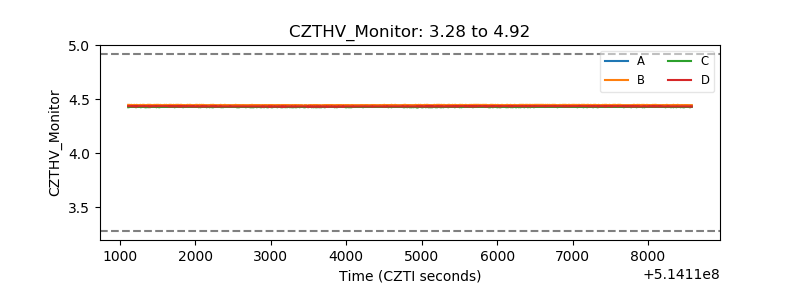 |
| D_VDD | 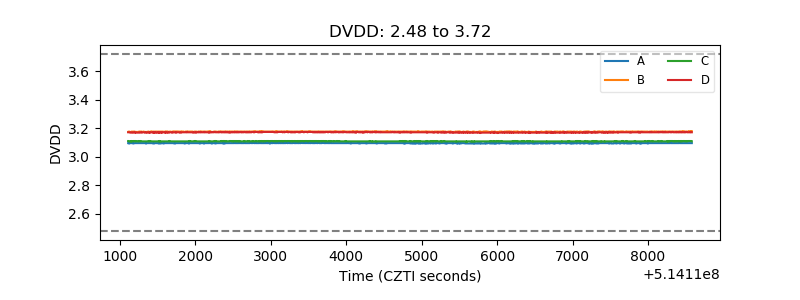 |
| Temperature 1 | 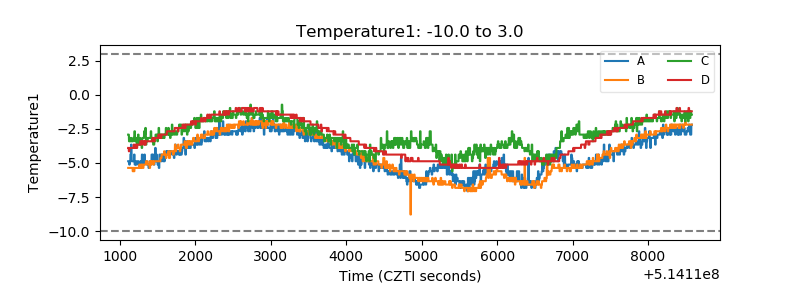 |
| Veto HV Monitor |  |
| Veto LLD | 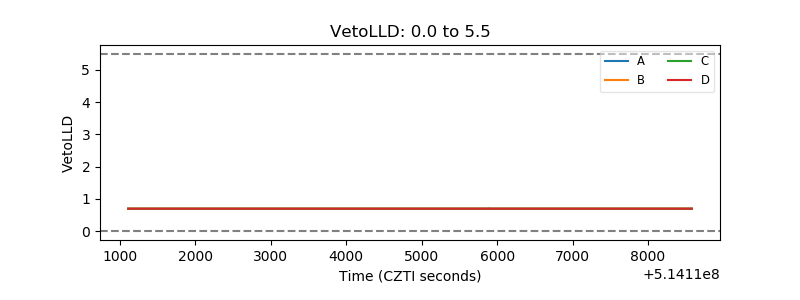 |
| Alpha Counter | 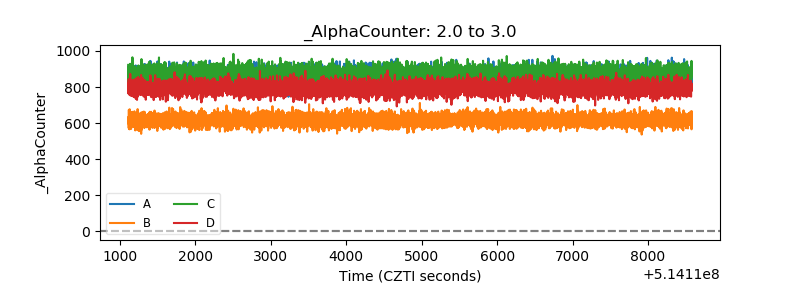 |
| _CPM_Rate | 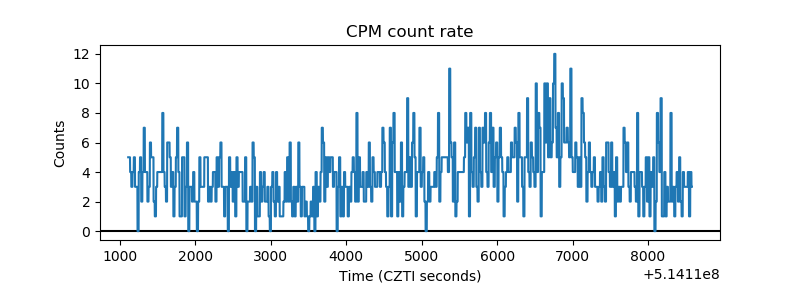 |
| CZT Counter | 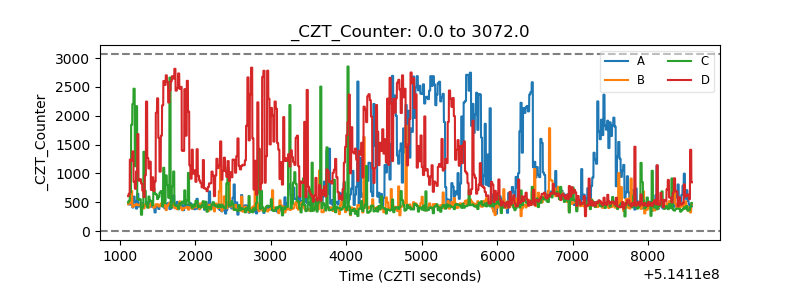 |
| +2.5 Volts monitor |  |
| +5 Volts monitor |  |
| _ROLL_ROT | 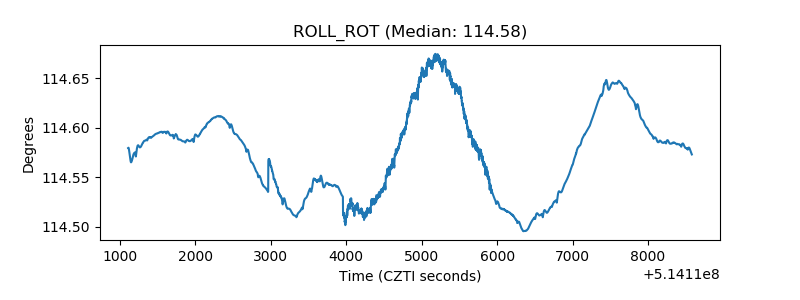 |
| _Roll_DEC | 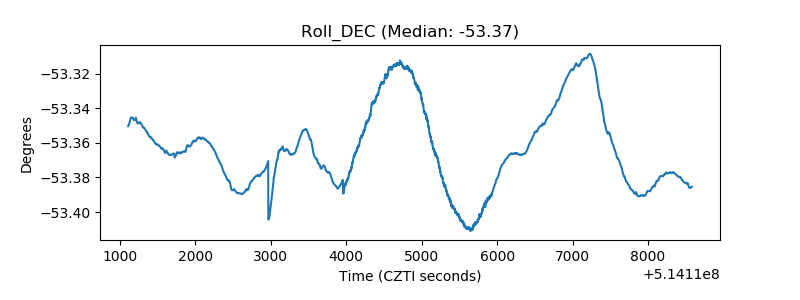 |
| _Roll_RA | 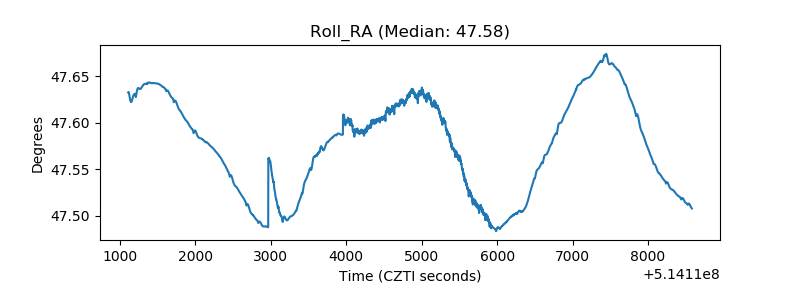 |
| Veto Counter | 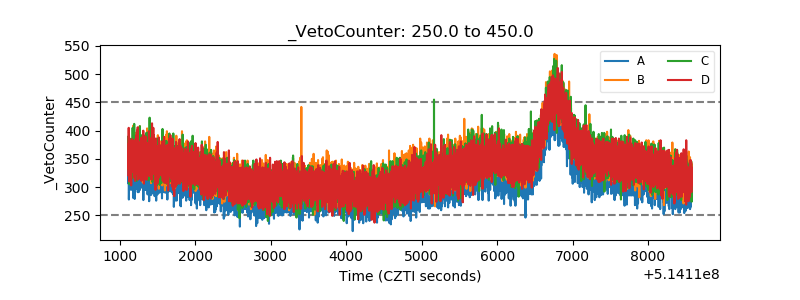 |