| Param | Original file | Final file |
|---|---|---|
| Filename | modeM0/AS1A14_083T10_9000006566_57094cztM0_level2.fits | modeM0/AS1A14_083T10_9000006566_57094cztM0_level2_quad_clean.evt |
| Size (bytes) | 471,588,480 | 107,524,800 |
| Size | 449.7 MB | 102.5 MB |
| Events in quadrant A | 4,832,336 | 689,149 |
| Events in quadrant B | 3,657,981 | 754,500 |
| Events in quadrant C | 3,609,627 | 672,636 |
| Events in quadrant D | 4,784,333 | 626,805 |
| Mode M0 | |||
|---|---|---|---|
| Quadrant | BADHDUFLAG | Total packets | Discarded packets |
| A | 0 | 19384 | 0 |
| B | 0 | 16113 | 1 |
| C | 0 | 16094 | 0 |
| D | 0 | 19211 | 0 |
| Mode SS | |||
|---|---|---|---|
| Quadrant | BADHDUFLAG | Total packets | Discarded packets |
| A | 0 | 146 | 0 |
| B | 0 | 146 | 0 |
| C | 0 | 146 | 0 |
| D | 0 | 146 | 0 |
| Quadrant | Total seconds | Saturated seconds | Saturation percentage |
|---|---|---|---|
| A | 7368 | 188 | 2.551574% |
| B | 7368 | 57 | 0.773616% |
| C | 7368 | 51 | 0.692182% |
| D | 7368 | 116 | 1.574376% |
Noise dominated data is calculated using 1-second bins in cleaned event files. If a bin has >2000 counts, and if more than 50% of those come from <1% of pixels, then it is considered to be noise-dominated and hence unusable.
| Quadrant | # 1 sec bins | Bins with >0 counts | Bins with >2000 counts | High rate bins dominated by noise | Noise dominated (total time) | Noise dominated (detector-on time) | Marked lightcurve |
|---|---|---|---|---|---|---|---|
| A | 7368 | 7368 | 137 | 137 | 1.86% | 1.86% | 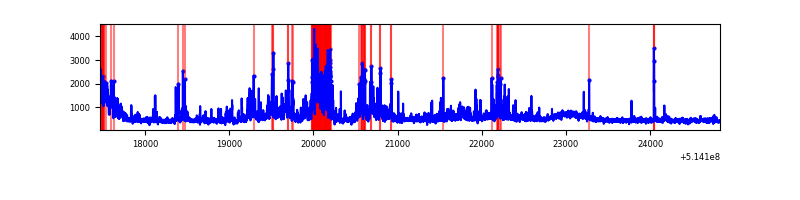 |
| B | 7368 | 7368 | 10 | 10 | 0.14% | 0.14% | 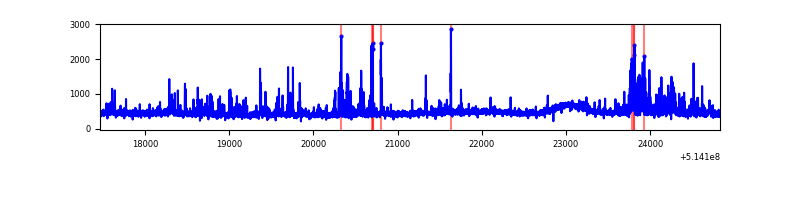 |
| C | 7368 | 7368 | 37 | 37 | 0.50% | 0.50% | 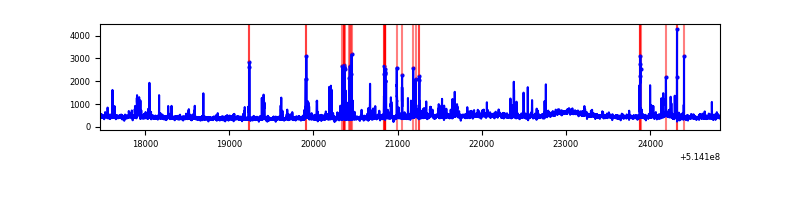 |
| D | 7368 | 7368 | 91 | 91 | 1.24% | 1.24% | 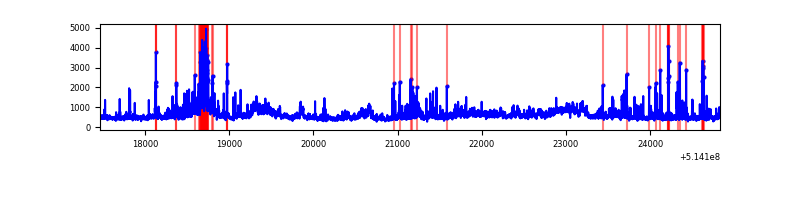 |
Top three noisy pixels from each quadrant. If the there are fewer than three noisy pixels in the level2.evt file, extra rows are filled as -1
| Pixel properties | Quadrant properties | ||||||
|---|---|---|---|---|---|---|---|
| Quadrant | DetID | PixID | Counts | Sigma | Mean | Median | Sigma |
| A | 4 | 13 | 1477403 | 7422.28 | 798 | 775 | 198.9 |
| A | 5 | 113 | 88112 | 439.0 | 798 | 775 | 198.9 |
| A | 4 | 249 | 85123 | 423.98 | 798 | 775 | 198.9 |
| B | 4 | 171 | 334683 | 1961.7 | 791 | 762 | 170.2 |
| B | 7 | 252 | 56738 | 328.85 | 791 | 762 | 170.2 |
| B | 5 | 185 | 27506 | 157.11 | 791 | 762 | 170.2 |
| C | 13 | 3 | 218013 | 1017.95 | 781 | 775 | 213.4 |
| C | 14 | 245 | 112153 | 521.91 | 781 | 775 | 213.4 |
| C | 14 | 254 | 72038 | 333.93 | 781 | 775 | 213.4 |
| D | 15 | 142 | 918716 | 4225.2 | 775 | 740 | 217.3 |
| D | 12 | 33 | 500277 | 2299.24 | 775 | 740 | 217.3 |
| D | 2 | 249 | 69488 | 316.43 | 775 | 740 | 217.3 |
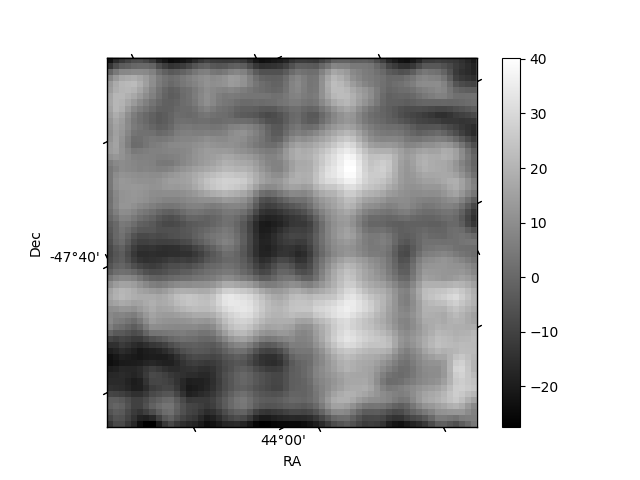
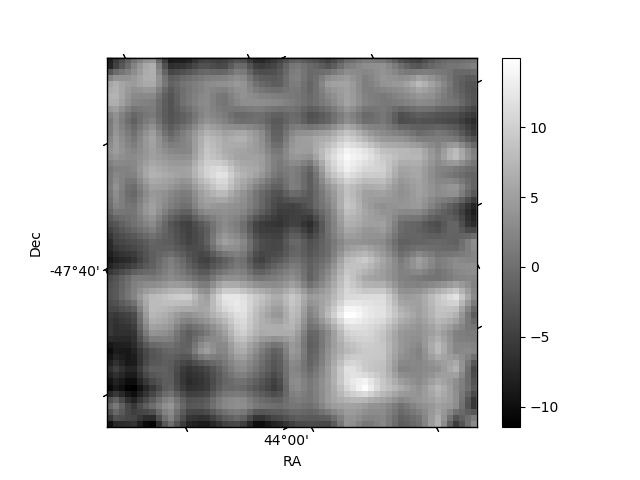
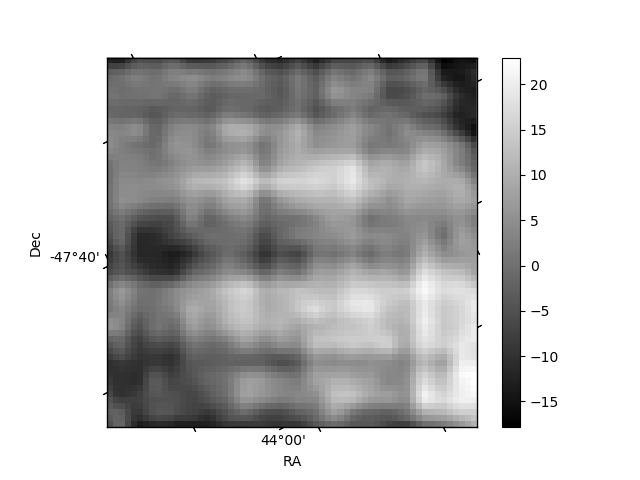
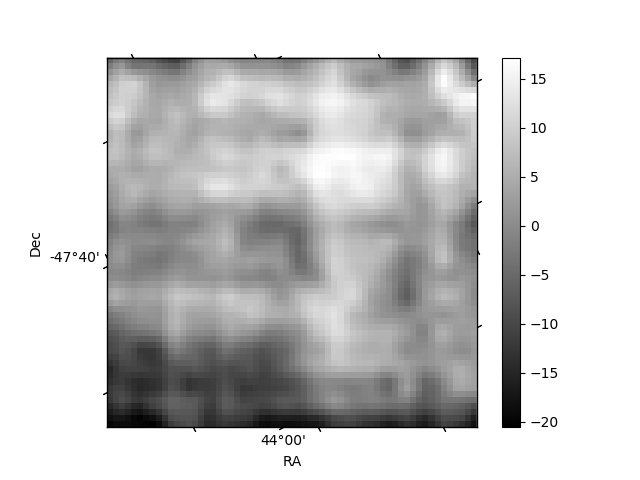
Histogram calculated using DETX and DETY for each event in the final _common_clean file
| Quadrant A | 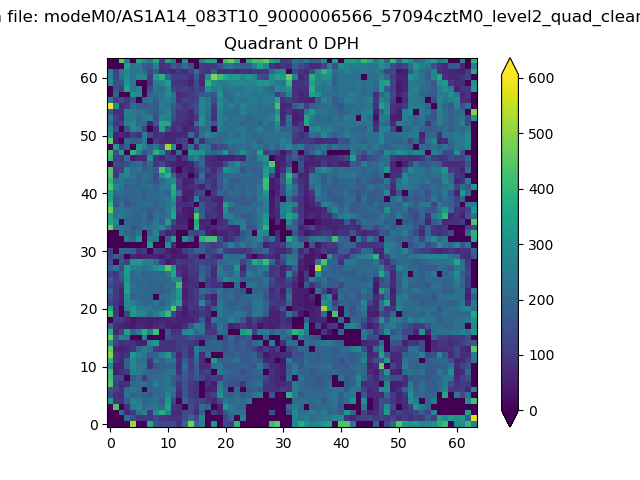 |
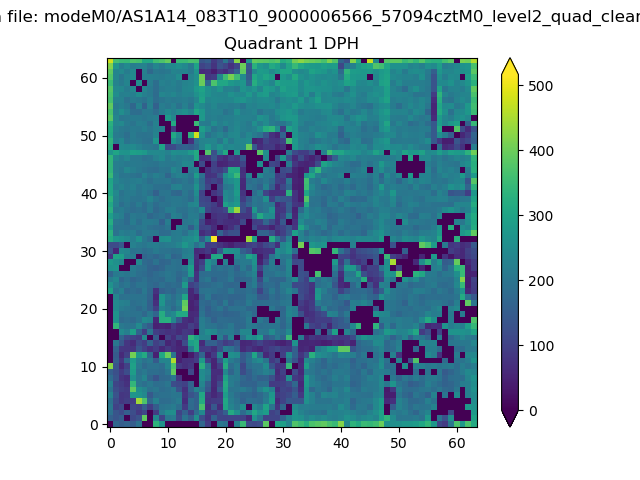 |
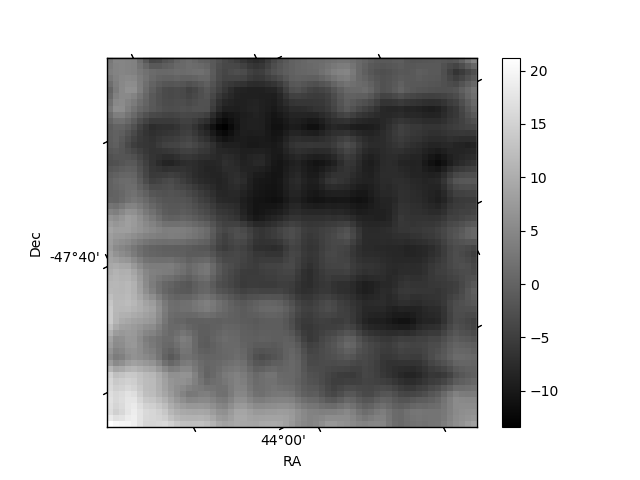
Quadrant B |
|---|---|---|---|
| Quadrant D | 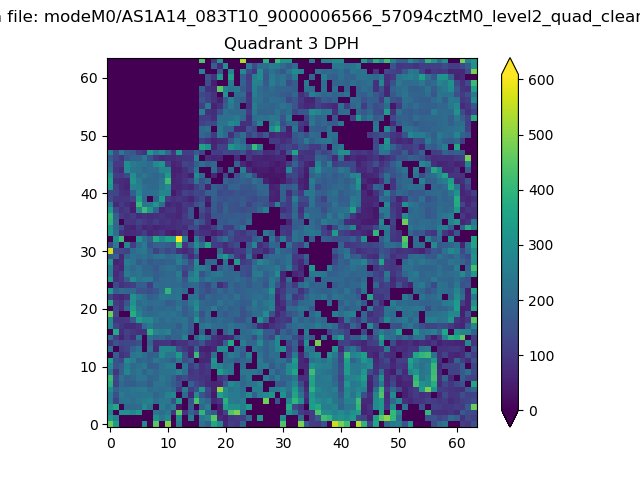 |
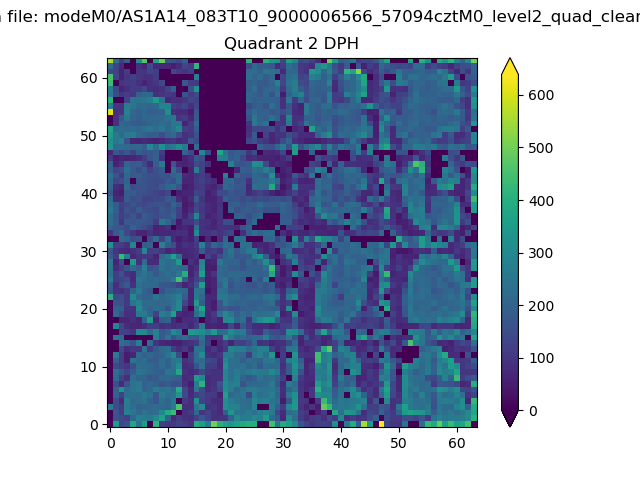 |
Quadrant C |
| Plot type | Count rate plots | Images |
|---|---|---|
| Comparison with Poisson distribution Blue bars denote a histogram of data divided into 1 sec bins. Red curve is a Poisson curve with rate = median count rate of data. |
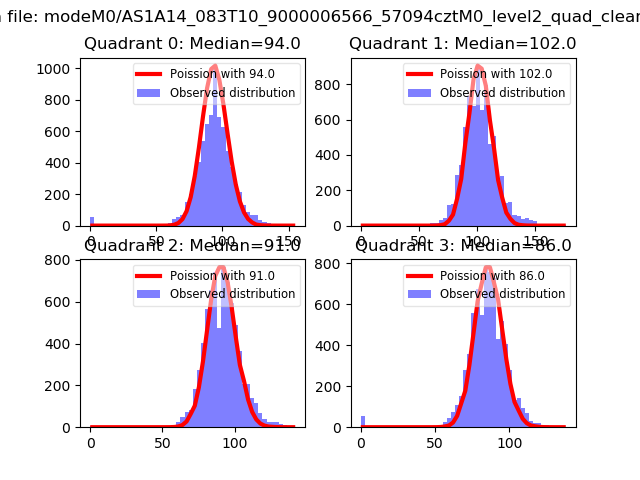 |
 |
| Quadrant-wise count rates Data is divided into 100 sec bins |
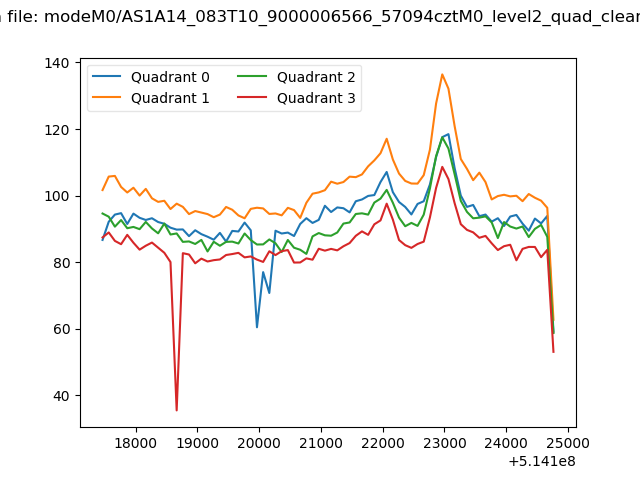 |
|
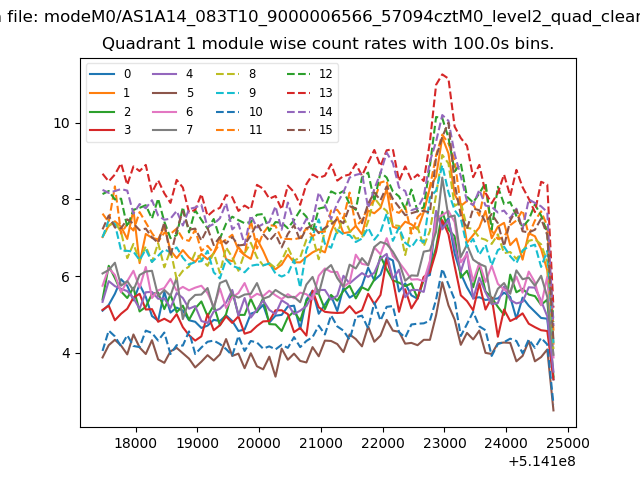
| Module-wise count rates for Quadrant A Data is divided into 100 sec bins |
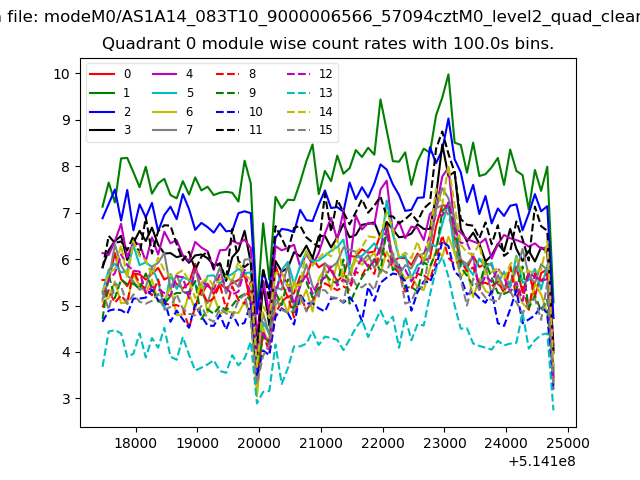 |
 |
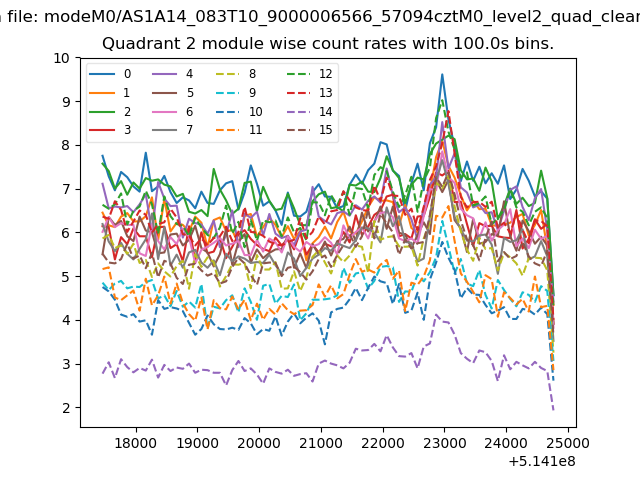
| Module-wise count rates for Quadrant B Data is divided into 100 sec bins |
 |
 |
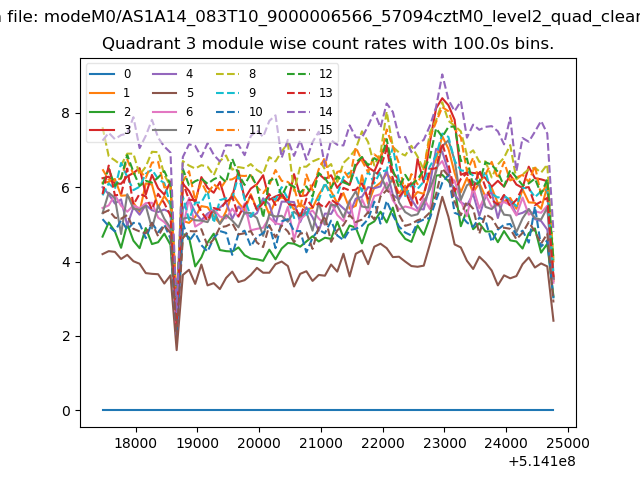
| Module-wise count rates for Quadrant C Data is divided into 100 sec bins |
 |
 |
| Module-wise count rates for Quadrant D Data is divided into 100 sec bins |
 |
 |
| Parameter | Plot |
|---|---|
| CZT HV Monitor | 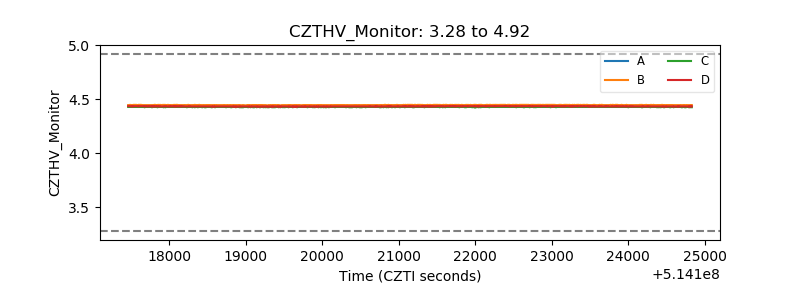 |
| D_VDD | 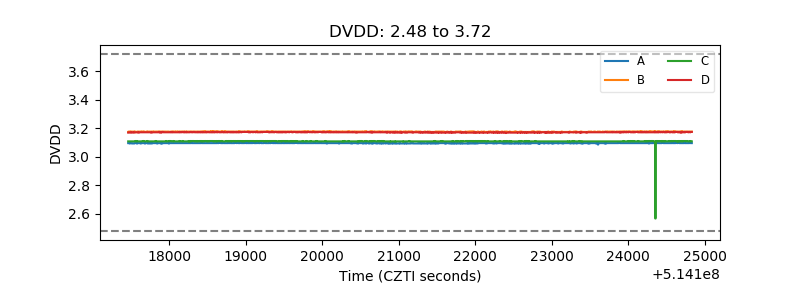 |
| Temperature 1 | 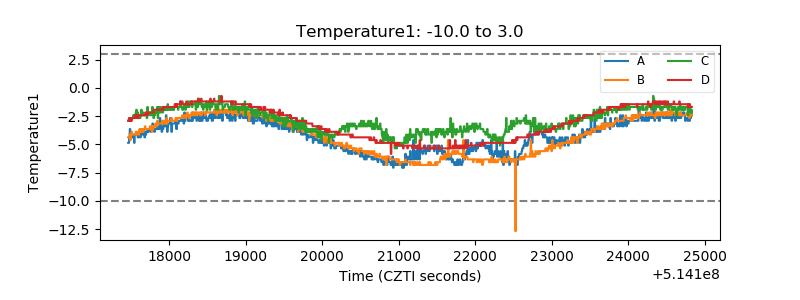 |
| Veto HV Monitor | 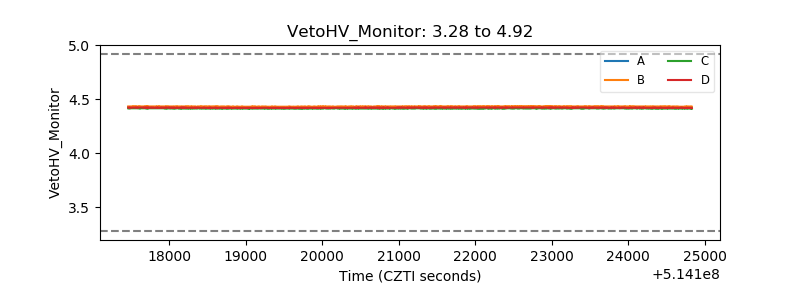 |
| Veto LLD | 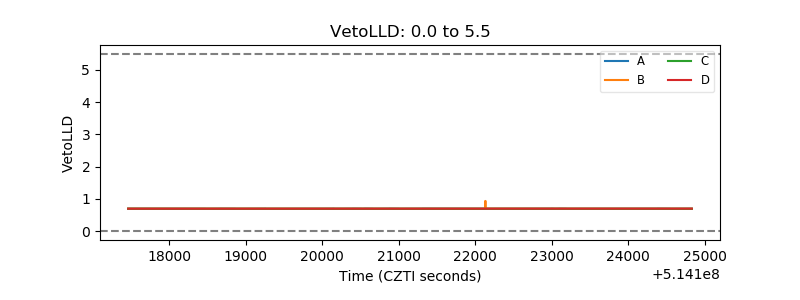 |
| Alpha Counter | 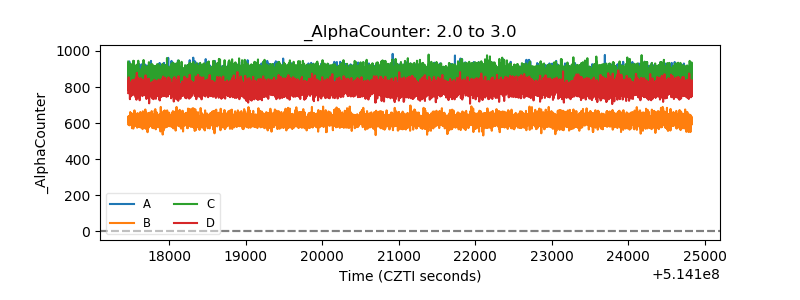 |
| _CPM_Rate | 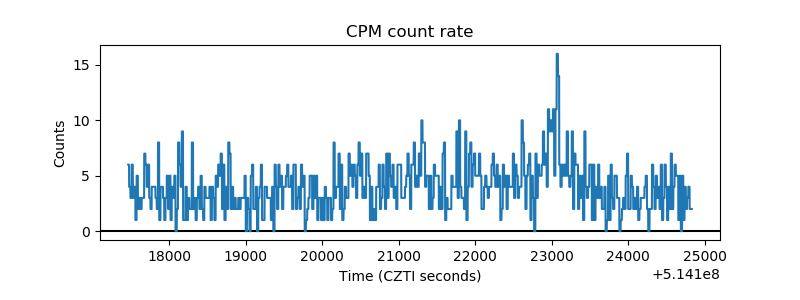 |
| CZT Counter | 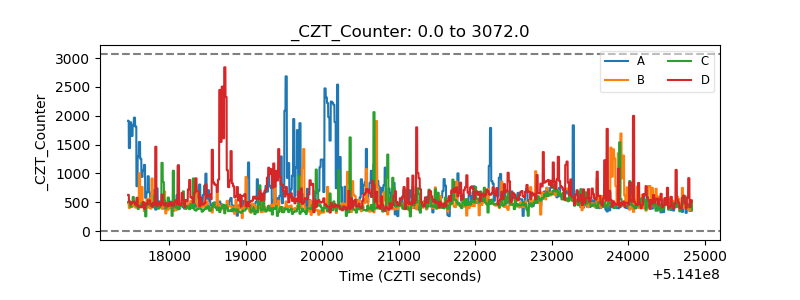 |
| +2.5 Volts monitor | 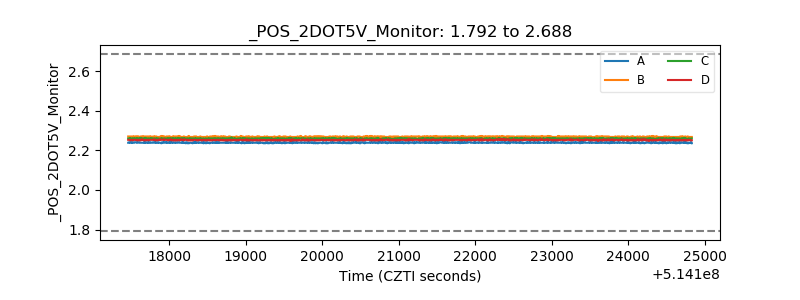 |
| +5 Volts monitor | 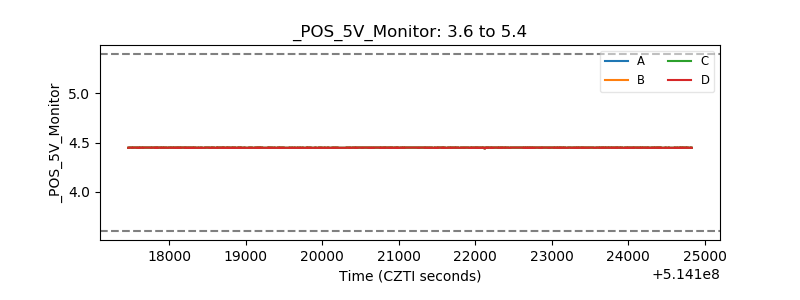 |
| _ROLL_ROT | 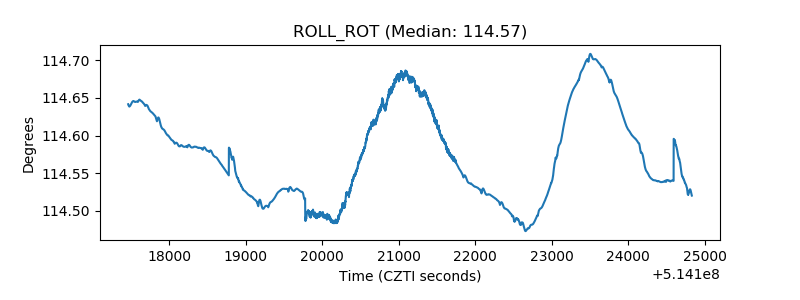 |
| _Roll_DEC | 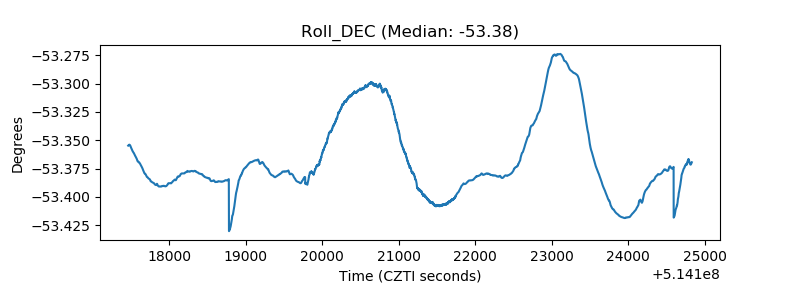 |
| _Roll_RA | 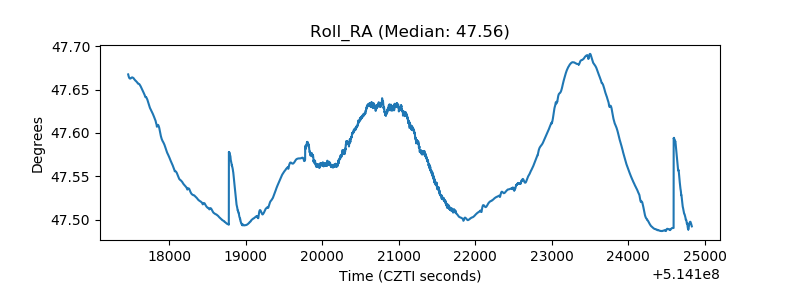 |
| Veto Counter | 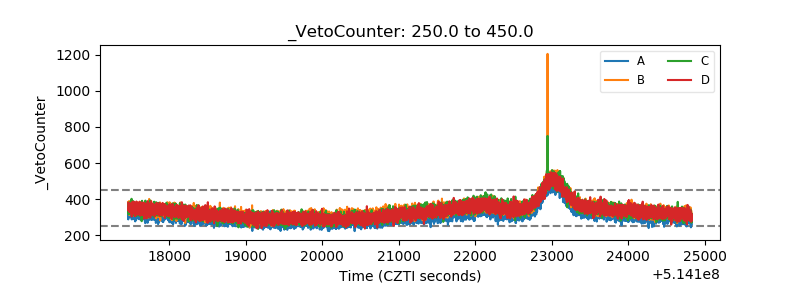 |