| Param | Original file | Final file |
|---|---|---|
| Filename | modeM0/AS1A14_083T10_9000006566_57098cztM0_level2.fits | modeM0/AS1A14_083T10_9000006566_57098cztM0_level2_quad_clean.evt |
| Size (bytes) | 568,339,200 | 94,757,760 |
| Size | 542.0 MB | 90.4 MB |
| Events in quadrant A | 3,522,220 | 638,978 |
| Events in quadrant B | 4,166,879 | 646,431 |
| Events in quadrant C | 3,179,383 | 612,964 |
| Events in quadrant D | 9,643,079 | 497,199 |
| Mode M9 | |||
|---|---|---|---|
| Quadrant | BADHDUFLAG | Total packets | Discarded packets |
| A | 0 | 10 | 0 |
| B | 0 | 11 | 0 |
| C | 0 | 11 | 0 |
| D | 0 | 11 | 0 |
| Mode M0 | |||
|---|---|---|---|
| Quadrant | BADHDUFLAG | Total packets | Discarded packets |
| A | 0 | 15071 | 3 |
| B | 0 | 17081 | 2 |
| C | 0 | 14649 | 2 |
| D | 0 | 33418 | 2 |
| Mode SS | |||
|---|---|---|---|
| Quadrant | BADHDUFLAG | Total packets | Discarded packets |
| A | 0 | 138 | 0 |
| B | 0 | 138 | 0 |
| C | 0 | 138 | 0 |
| D | 0 | 138 | 0 |
| Quadrant | Total seconds | Saturated seconds | Saturation percentage |
|---|---|---|---|
| A | 6792 | 102 | 1.501767% |
| B | 6792 | 479 | 7.052415% |
| C | 6792 | 36 | 0.530035% |
| D | 6792 | 1117 | 16.445819% |
Noise dominated data is calculated using 1-second bins in cleaned event files. If a bin has >2000 counts, and if more than 50% of those come from <1% of pixels, then it is considered to be noise-dominated and hence unusable.
| Quadrant | # 1 sec bins | Bins with >0 counts | Bins with >2000 counts | High rate bins dominated by noise | Noise dominated (total time) | Noise dominated (detector-on time) | Marked lightcurve |
|---|---|---|---|---|---|---|---|
| A | 7672 | 6793 | 50 | 50 | 0.65% | 0.74% | 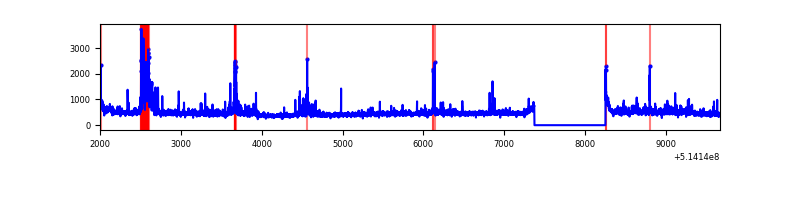 |
| B | 7672 | 6793 | 295 | 295 | 3.85% | 4.34% | 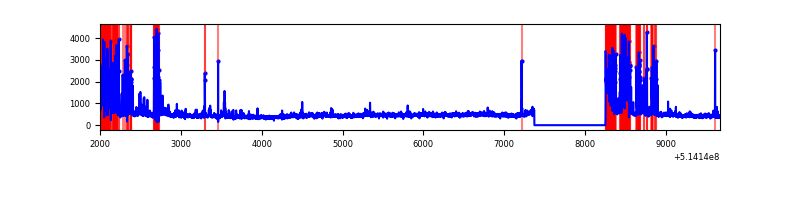 |
| C | 7672 | 6793 | 25 | 25 | 0.33% | 0.37% | 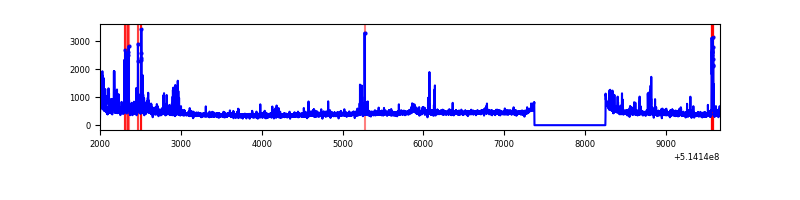 |
| D | 7672 | 6793 | 1397 | 1397 | 18.21% | 20.57% | 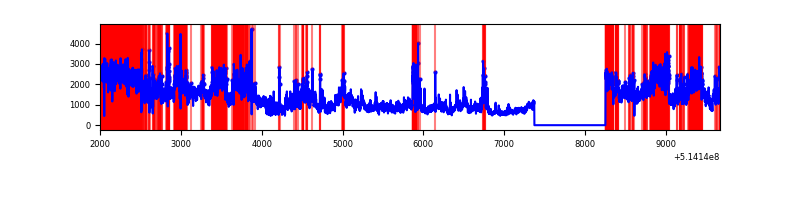 |
Top three noisy pixels from each quadrant. If the there are fewer than three noisy pixels in the level2.evt file, extra rows are filled as -1
| Pixel properties | Quadrant properties | ||||||
|---|---|---|---|---|---|---|---|
| Quadrant | DetID | PixID | Counts | Sigma | Mean | Median | Sigma |
| A | 13 | 248 | 209168 | 1163.02 | 729 | 709 | 179.2 |
| A | 4 | 13 | 159665 | 886.84 | 729 | 709 | 179.2 |
| A | 5 | 113 | 139846 | 776.27 | 729 | 709 | 179.2 |
| B | 10 | 16 | 1097646 | 7427.81 | 687 | 661 | 147.7 |
| B | 0 | 197 | 111744 | 752.16 | 687 | 661 | 147.7 |
| B | 4 | 171 | 106466 | 716.42 | 687 | 661 | 147.7 |
| C | 12 | 252 | 200634 | 1036.82 | 703 | 696 | 192.8 |
| C | 1 | 241 | 55881 | 286.17 | 703 | 696 | 192.8 |
| C | 14 | 254 | 48059 | 245.61 | 703 | 696 | 192.8 |
| D | 15 | 142 | 5785359 | 31077.6 | 657 | 625 | 186.1 |
| D | 12 | 33 | 698303 | 3748.17 | 657 | 625 | 186.1 |
| D | 2 | 249 | 270651 | 1450.67 | 657 | 625 | 186.1 |
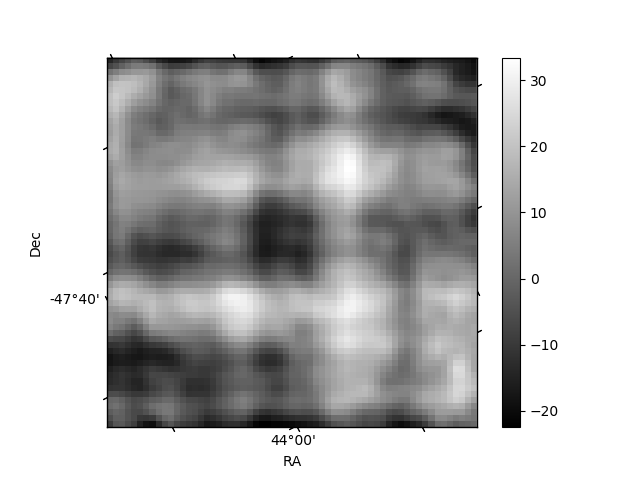
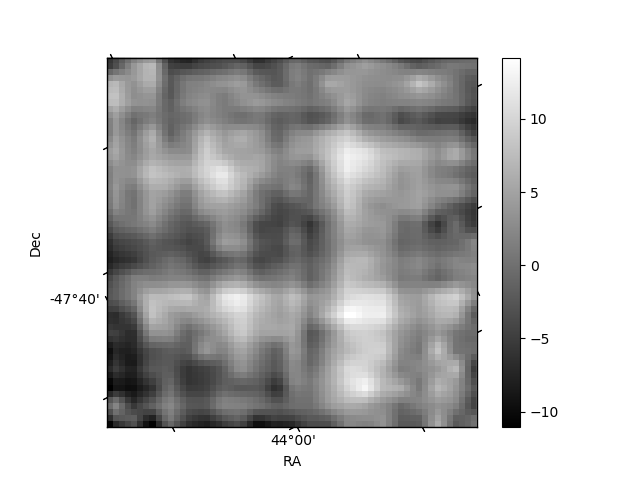
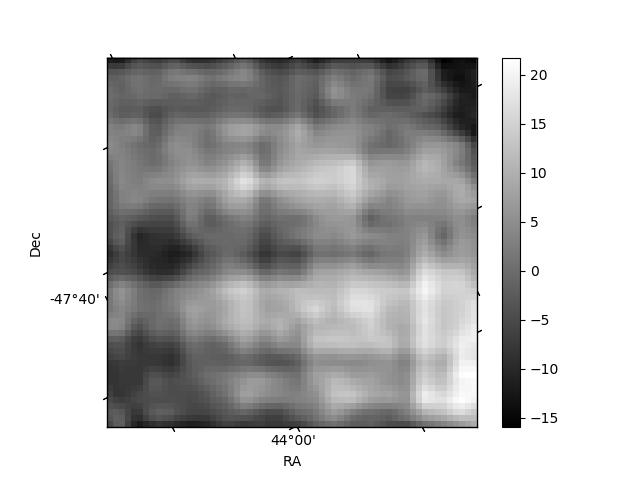
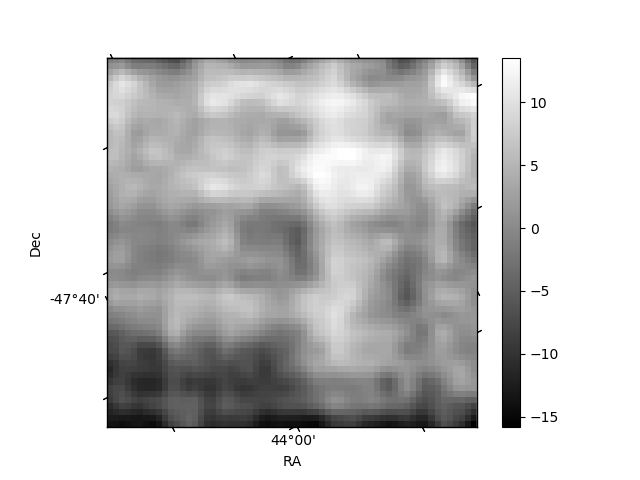
Histogram calculated using DETX and DETY for each event in the final _common_clean file
| Quadrant A | 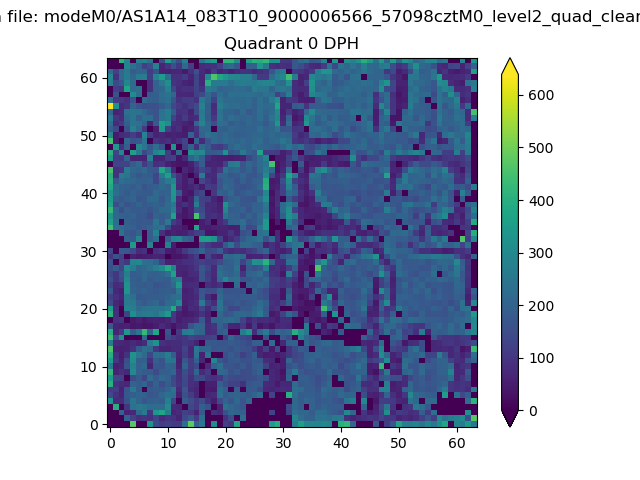 |
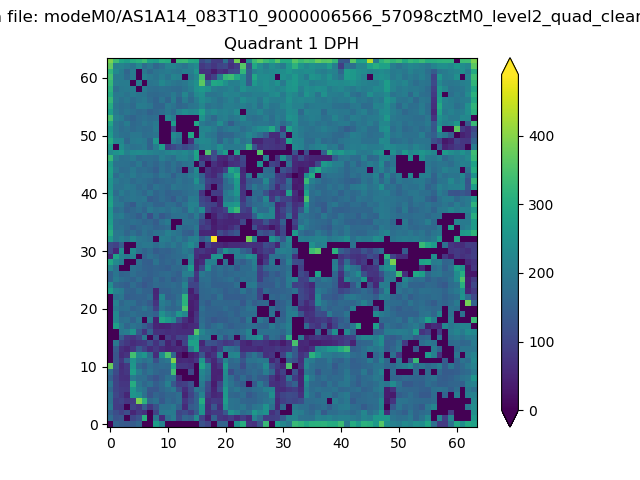 |
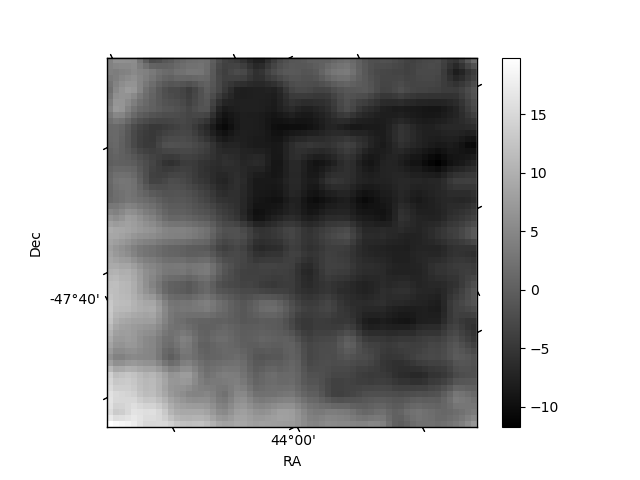
Quadrant B |
|---|---|---|---|
| Quadrant D | 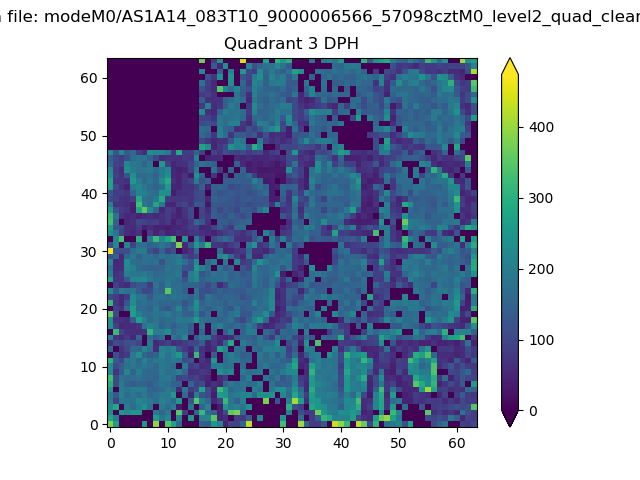 |
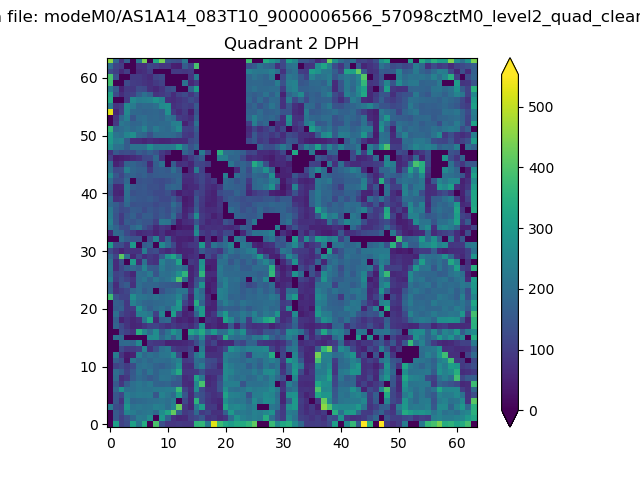 |
Quadrant C |
| Plot type | Count rate plots | Images |
|---|---|---|
| Comparison with Poisson distribution Blue bars denote a histogram of data divided into 1 sec bins. Red curve is a Poisson curve with rate = median count rate of data. |
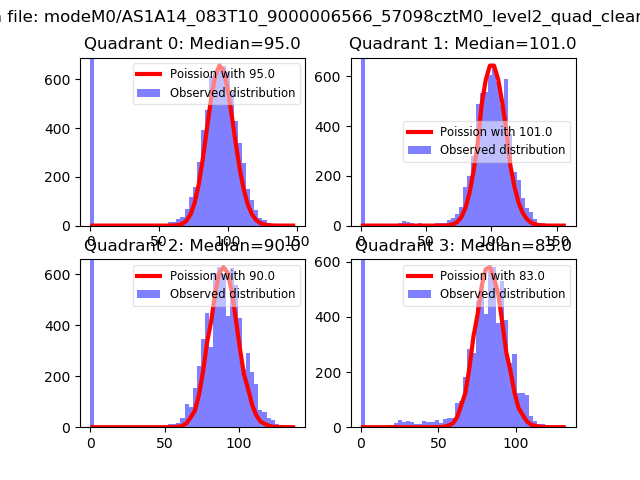 |
 |
| Quadrant-wise count rates Data is divided into 100 sec bins |
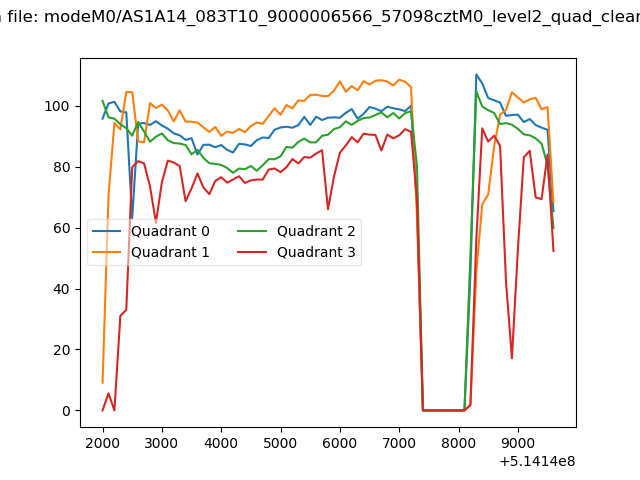 |
|
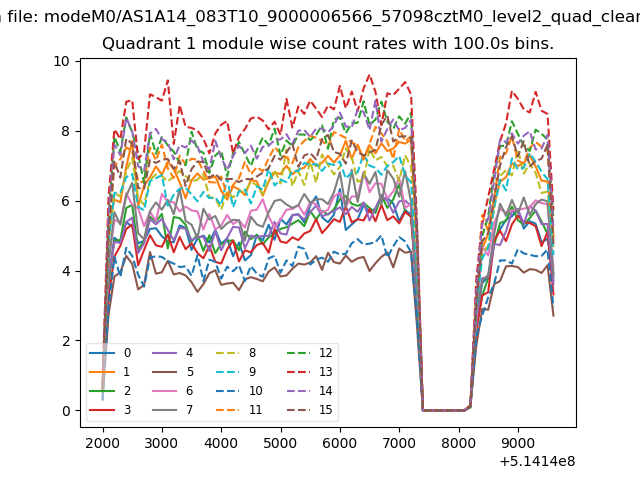
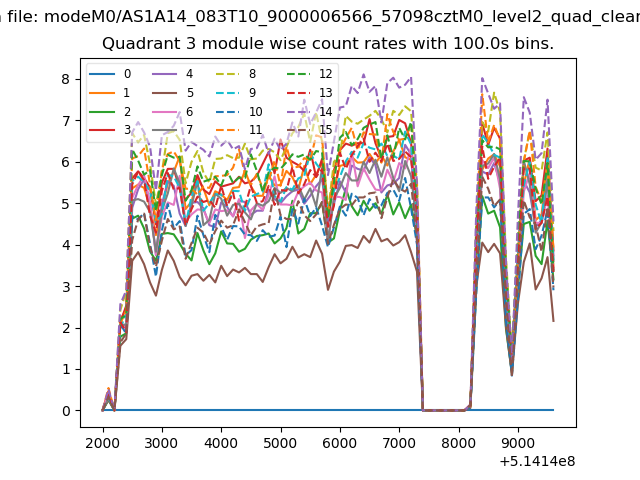
| Module-wise count rates for Quadrant A Data is divided into 100 sec bins |
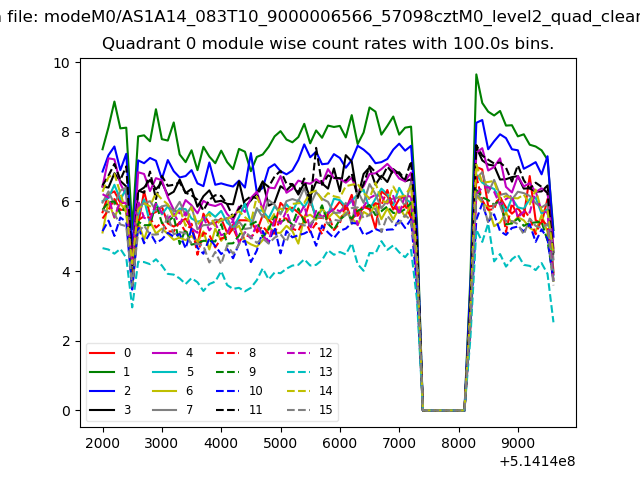 |
 |
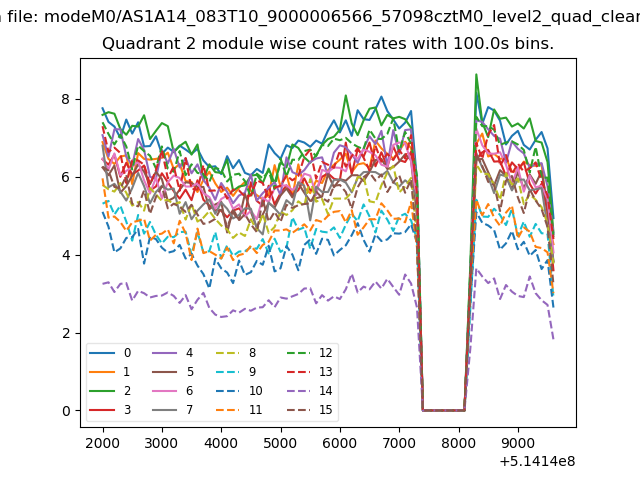
| Module-wise count rates for Quadrant B Data is divided into 100 sec bins |
 |
 |
| Module-wise count rates for Quadrant C Data is divided into 100 sec bins |
 |
 |
| Module-wise count rates for Quadrant D Data is divided into 100 sec bins |
 |
 |
| Parameter | Plot |
|---|---|
| CZT HV Monitor | 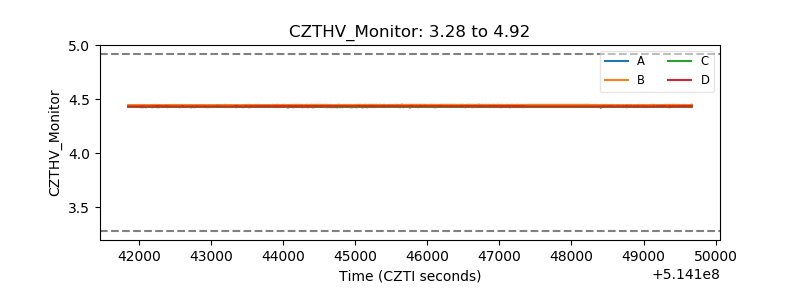 |
| D_VDD | 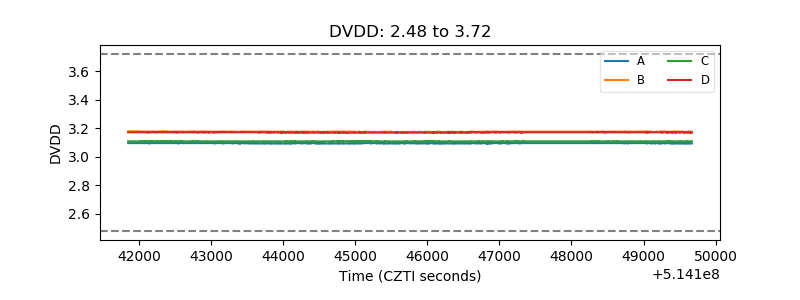 |
| Temperature 1 | 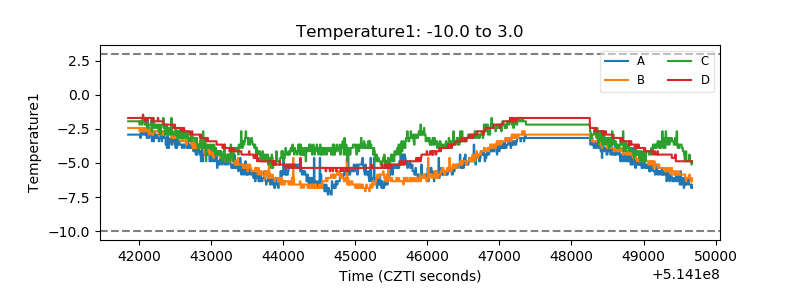 |
| Veto HV Monitor | 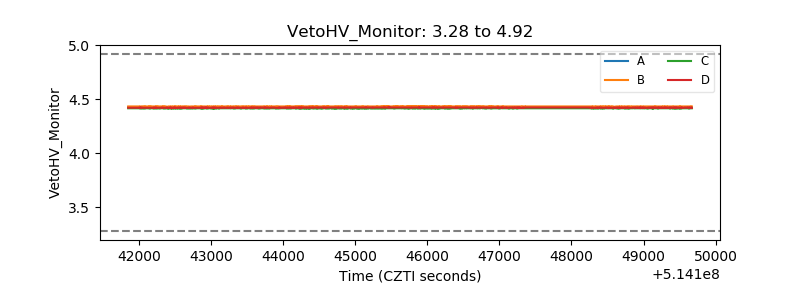 |
| Veto LLD | 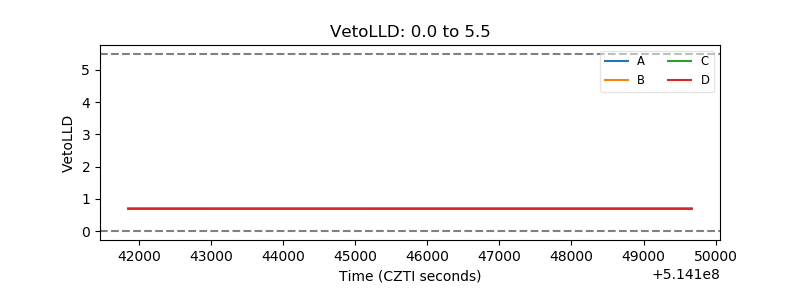 |
| Alpha Counter | 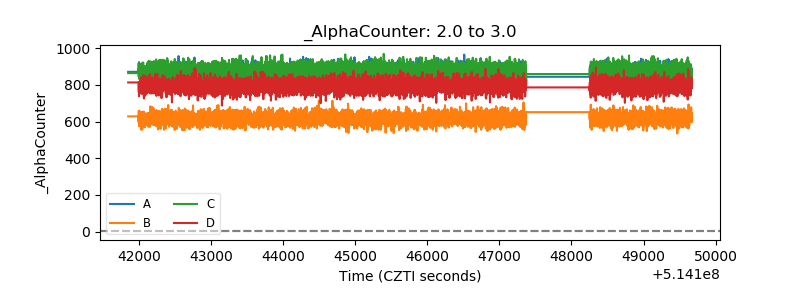 |
| _CPM_Rate | 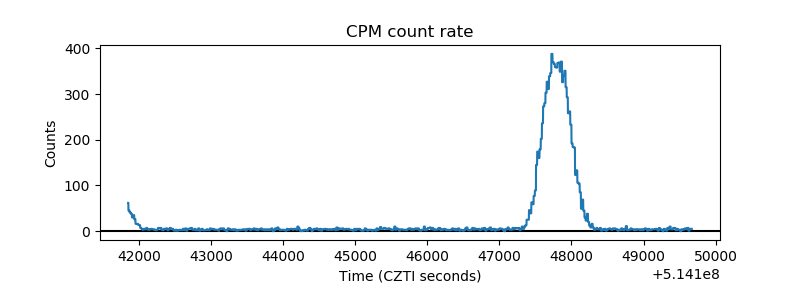 |
| CZT Counter | 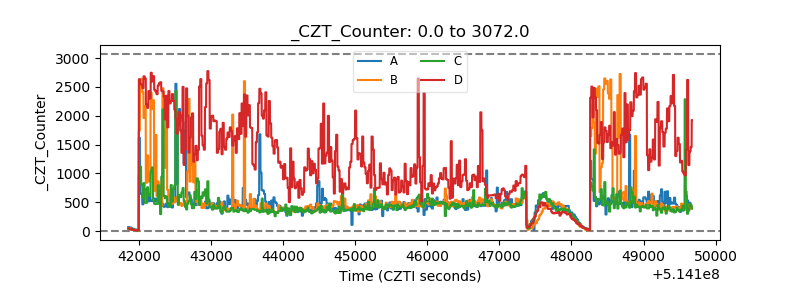 |
| +2.5 Volts monitor |  |
| +5 Volts monitor |  |
| _ROLL_ROT | 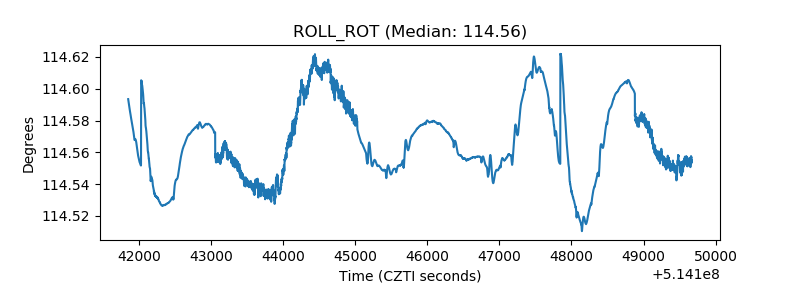 |
| _Roll_DEC | 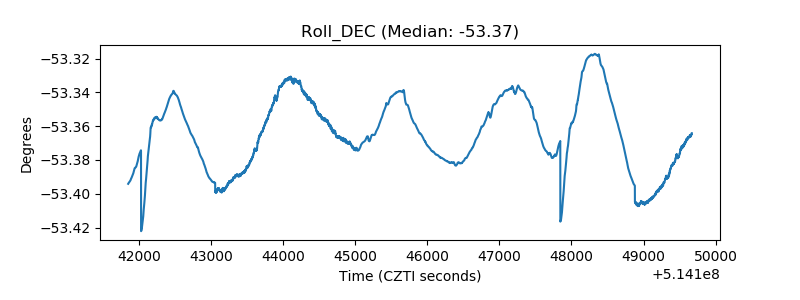 |
| _Roll_RA |  |
| Veto Counter | 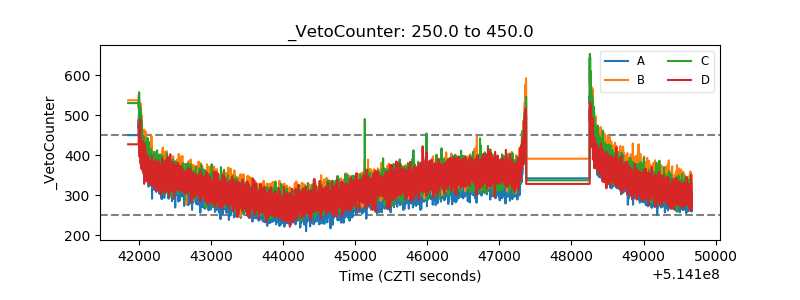 |