| Param | Original file | Final file |
|---|---|---|
| Filename | modeM0/AS1A14_083T10_9000006566_57100cztM0_level2.fits | modeM0/AS1A14_083T10_9000006566_57100cztM0_level2_quad_clean.evt |
| Size (bytes) | 513,264,960 | 94,167,360 |
| Size | 489.5 MB | 89.8 MB |
| Events in quadrant A | 3,352,506 | 631,632 |
| Events in quadrant B | 4,536,742 | 642,097 |
| Events in quadrant C | 3,163,132 | 602,450 |
| Events in quadrant D | 7,433,942 | 514,111 |
| Mode M9 | |||
|---|---|---|---|
| Quadrant | BADHDUFLAG | Total packets | Discarded packets |
| A | 0 | 16 | 0 |
| B | 0 | 17 | 0 |
| C | 0 | 17 | 0 |
| D | 0 | 17 | 0 |
| Mode M0 | |||
|---|---|---|---|
| Quadrant | BADHDUFLAG | Total packets | Discarded packets |
| A | 0 | 14502 | 2 |
| B | 0 | 18074 | 2 |
| C | 0 | 14401 | 2 |
| D | 0 | 26512 | 2 |
| Mode SS | |||
|---|---|---|---|
| Quadrant | BADHDUFLAG | Total packets | Discarded packets |
| A | 0 | 134 | 0 |
| B | 0 | 134 | 0 |
| C | 0 | 134 | 0 |
| D | 0 | 134 | 0 |
| Quadrant | Total seconds | Saturated seconds | Saturation percentage |
|---|---|---|---|
| A | 6612 | 112 | 1.693890% |
| B | 6612 | 478 | 7.229280% |
| C | 6611 | 60 | 0.907578% |
| D | 6611 | 782 | 11.828770% |
Noise dominated data is calculated using 1-second bins in cleaned event files. If a bin has >2000 counts, and if more than 50% of those come from <1% of pixels, then it is considered to be noise-dominated and hence unusable.
| Quadrant | # 1 sec bins | Bins with >0 counts | Bins with >2000 counts | High rate bins dominated by noise | Noise dominated (total time) | Noise dominated (detector-on time) | Marked lightcurve |
|---|---|---|---|---|---|---|---|
| A | 7637 | 6613 | 45 | 45 | 0.59% | 0.68% | 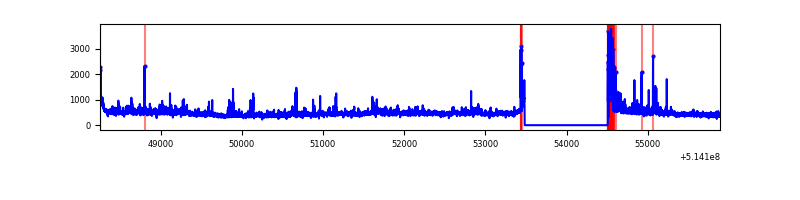 |
| B | 7637 | 6613 | 256 | 256 | 3.35% | 3.87% | 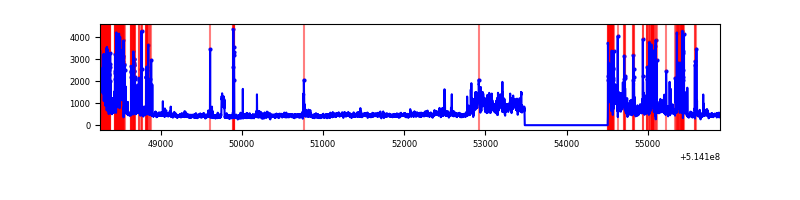 |
| C | 7636 | 6612 | 44 | 44 | 0.58% | 0.67% | 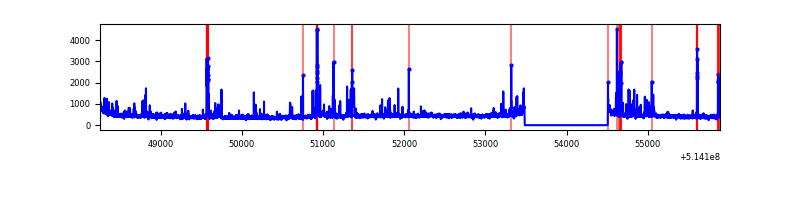 |
| D | 7636 | 6612 | 958 | 958 | 12.55% | 14.49% | 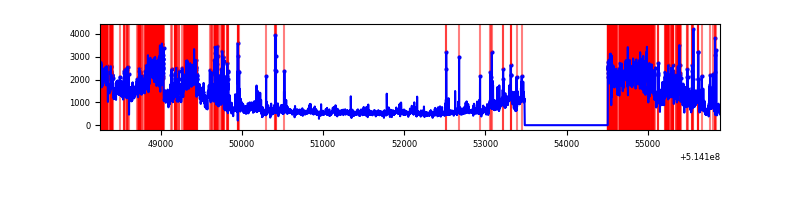 |
Top three noisy pixels from each quadrant. If the there are fewer than three noisy pixels in the level2.evt file, extra rows are filled as -1
| Pixel properties | Quadrant properties | ||||||
|---|---|---|---|---|---|---|---|
| Quadrant | DetID | PixID | Counts | Sigma | Mean | Median | Sigma |
| A | 10 | 251 | 211339 | 1204.59 | 708 | 689 | 174.9 |
| A | 5 | 113 | 120296 | 683.97 | 708 | 689 | 174.9 |
| A | 4 | 13 | 107414 | 610.3 | 708 | 689 | 174.9 |
| B | 10 | 16 | 1109692 | 7682.6 | 677 | 651 | 144.4 |
| B | 4 | 171 | 360752 | 2494.51 | 677 | 651 | 144.4 |
| B | 0 | 197 | 144588 | 997.09 | 677 | 651 | 144.4 |
| C | 6 | 223 | 132140 | 699.76 | 687 | 681 | 187.9 |
| C | 14 | 254 | 96303 | 509.0 | 687 | 681 | 187.9 |
| C | 9 | 237 | 53388 | 280.56 | 687 | 681 | 187.9 |
| D | 15 | 142 | 3395598 | 18146.58 | 655 | 624 | 187.1 |
| D | 12 | 33 | 947311 | 5060.16 | 655 | 624 | 187.1 |
| D | 7 | 96 | 151817 | 808.15 | 655 | 624 | 187.1 |
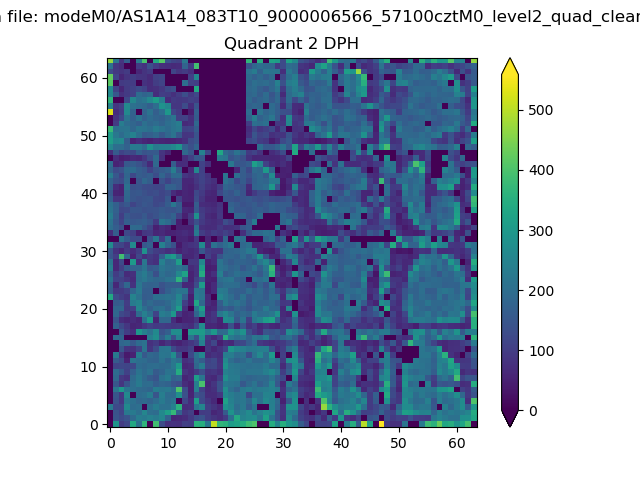
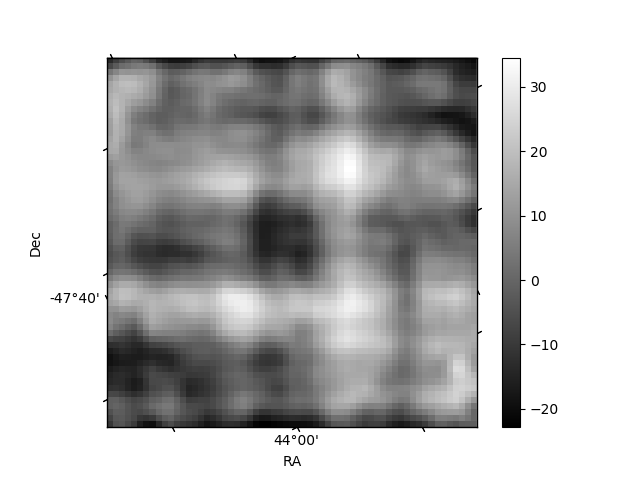
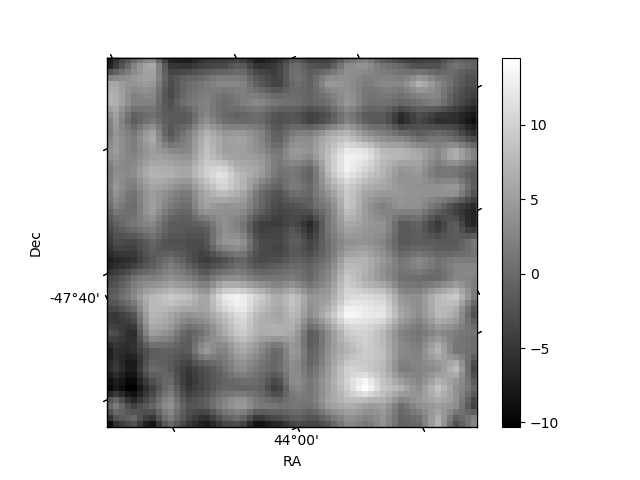
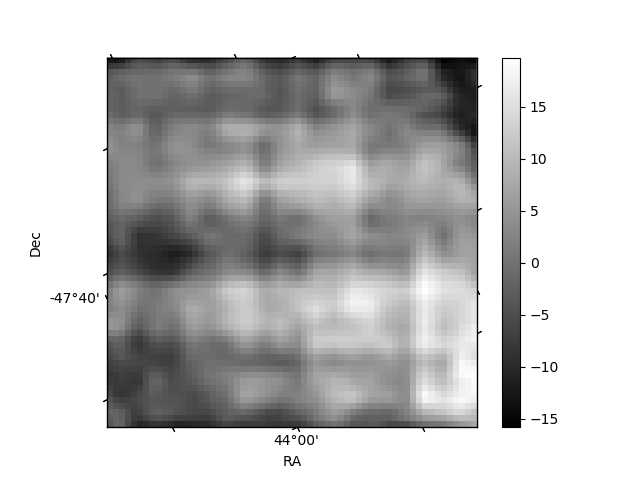
Histogram calculated using DETX and DETY for each event in the final _common_clean file
| Quadrant A | 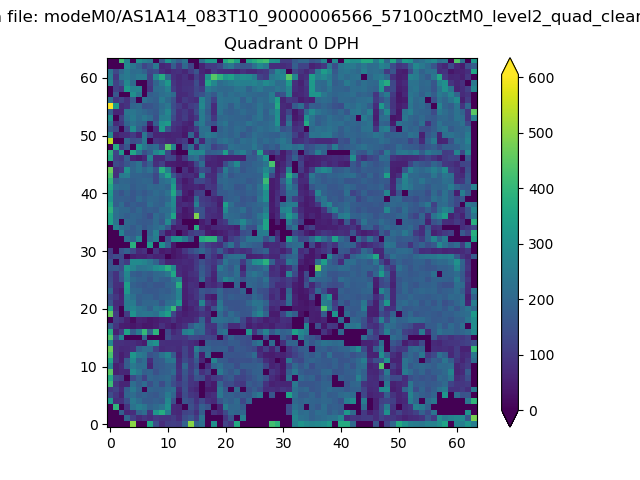 |
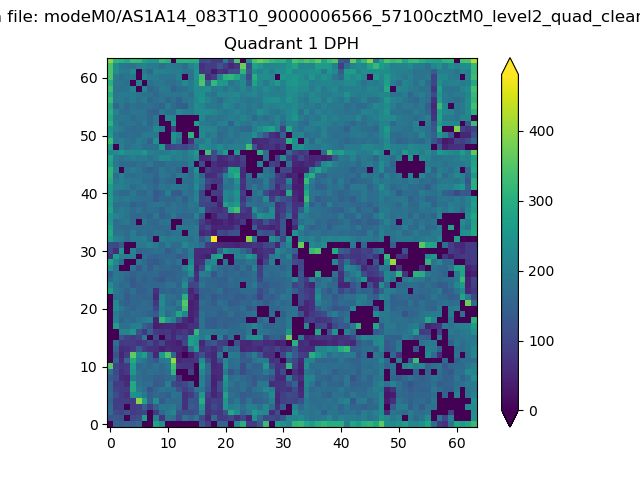 |
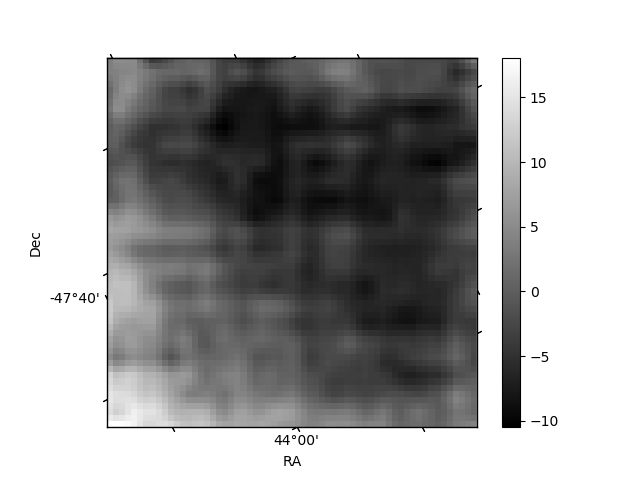
Quadrant B |
|---|---|---|---|
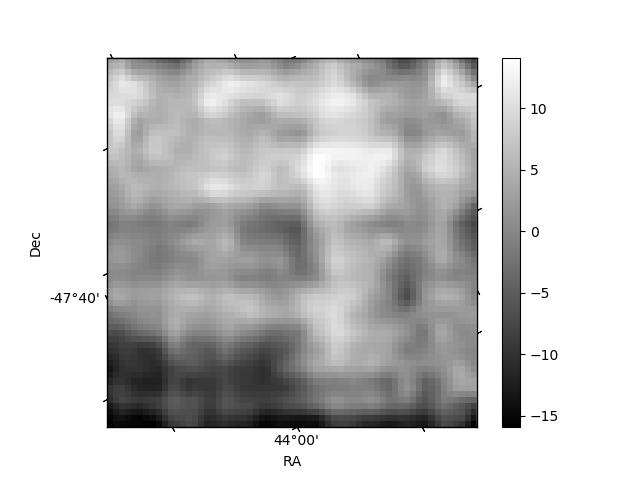
| Quadrant D | 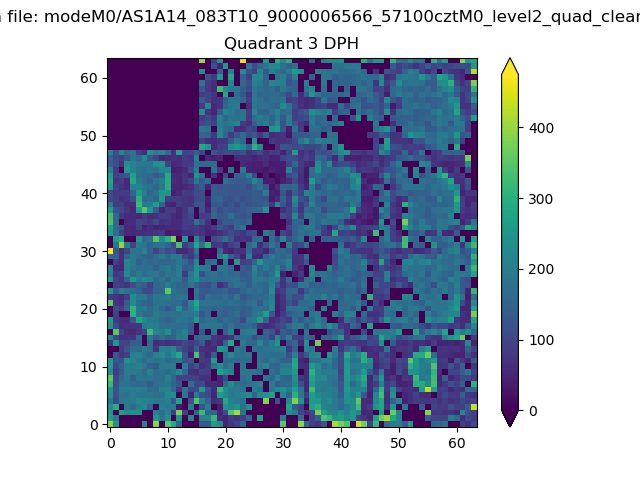 |
 |
Quadrant C |
| Plot type | Count rate plots | Images |
|---|---|---|
| Comparison with Poisson distribution Blue bars denote a histogram of data divided into 1 sec bins. Red curve is a Poisson curve with rate = median count rate of data. |
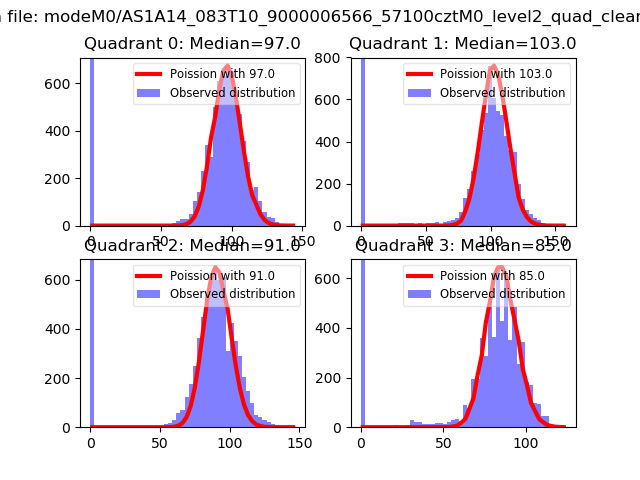 |
 |
| Quadrant-wise count rates Data is divided into 100 sec bins |
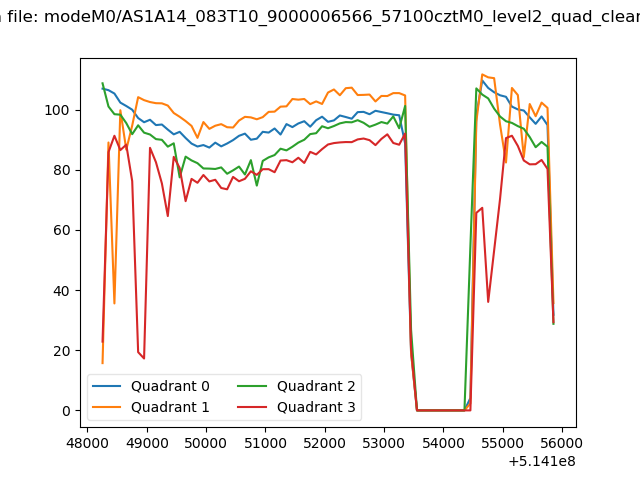 |
|
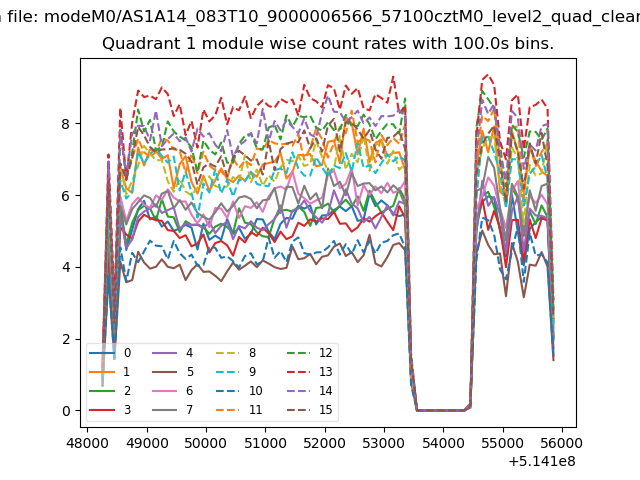
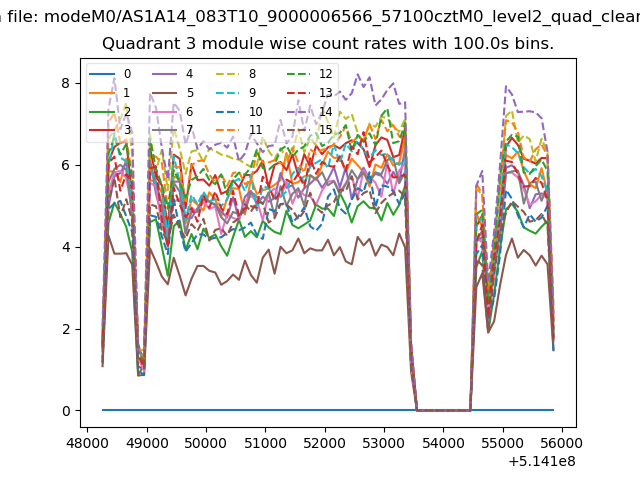
| Module-wise count rates for Quadrant A Data is divided into 100 sec bins |
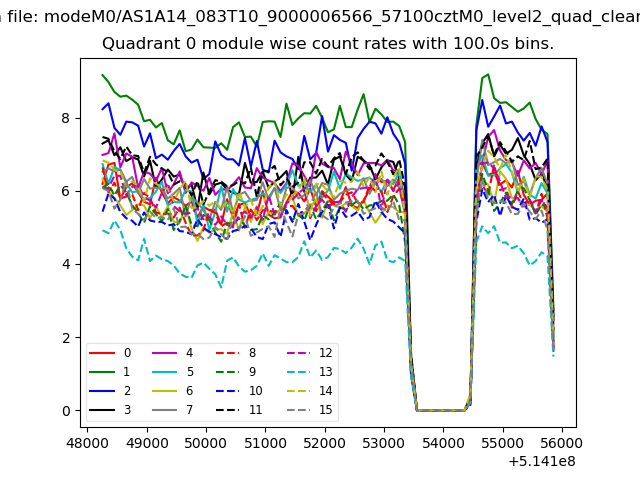 |
 |
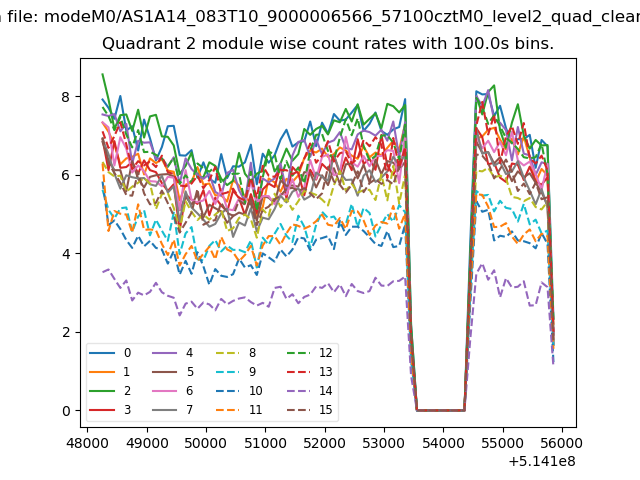
| Module-wise count rates for Quadrant B Data is divided into 100 sec bins |
 |
 |
| Module-wise count rates for Quadrant C Data is divided into 100 sec bins |
 |
 |
| Module-wise count rates for Quadrant D Data is divided into 100 sec bins |
 |
 |
| Parameter | Plot |
|---|---|
| CZT HV Monitor | 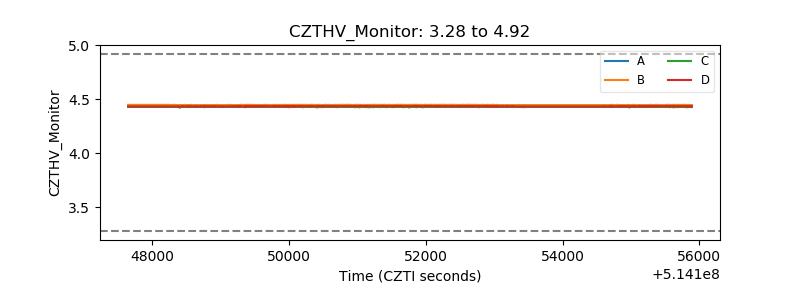 |
| D_VDD | 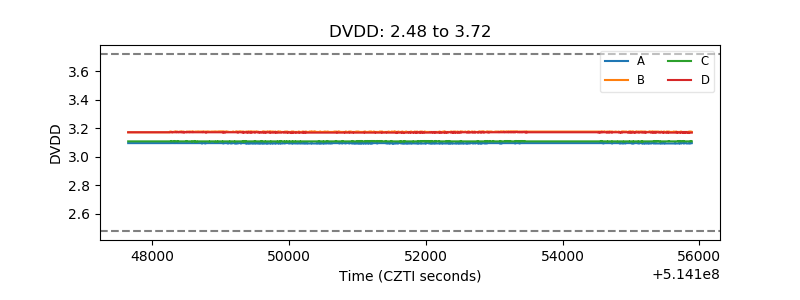 |
| Temperature 1 | 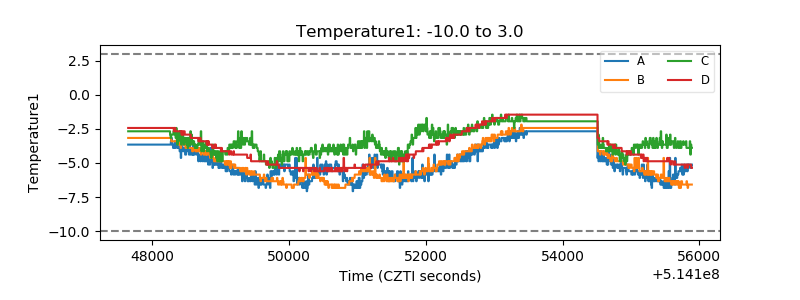 |
| Veto HV Monitor | 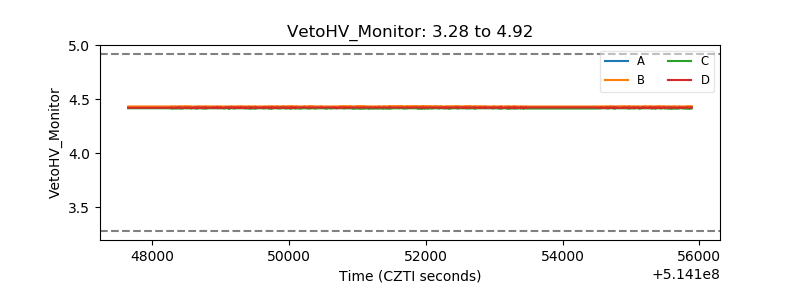 |
| Veto LLD | 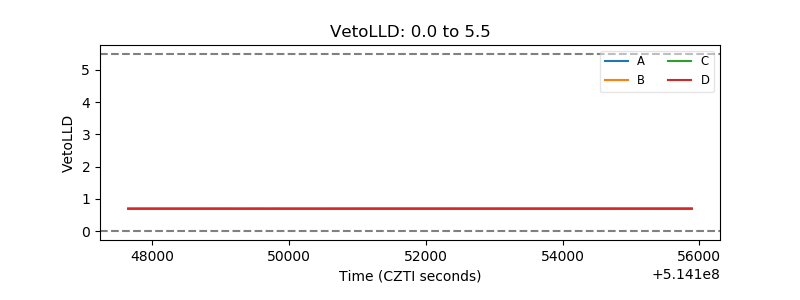 |
| Alpha Counter | 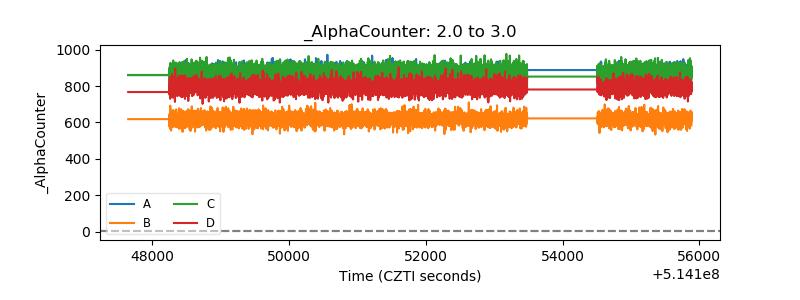 |
| _CPM_Rate | 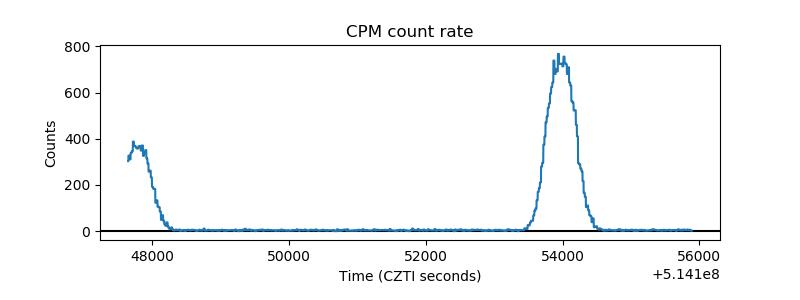 |
| CZT Counter | 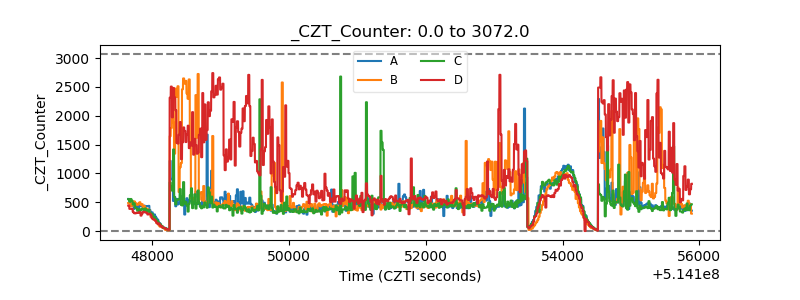 |
| +2.5 Volts monitor |  |
| +5 Volts monitor |  |
| _ROLL_ROT | 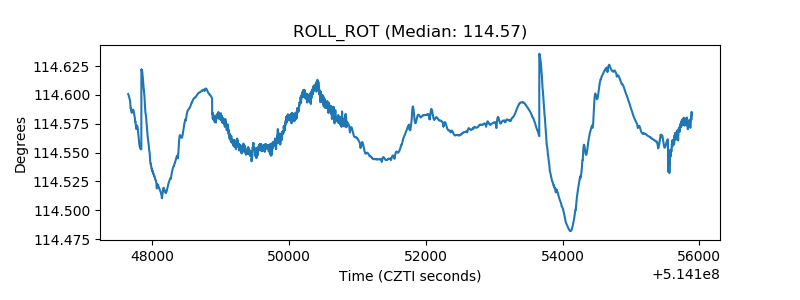 |
| _Roll_DEC | 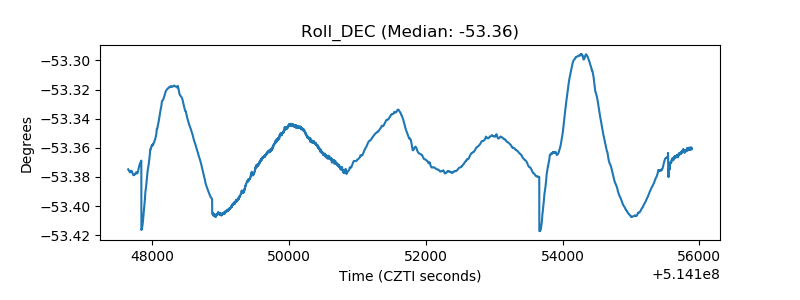 |
| _Roll_RA | 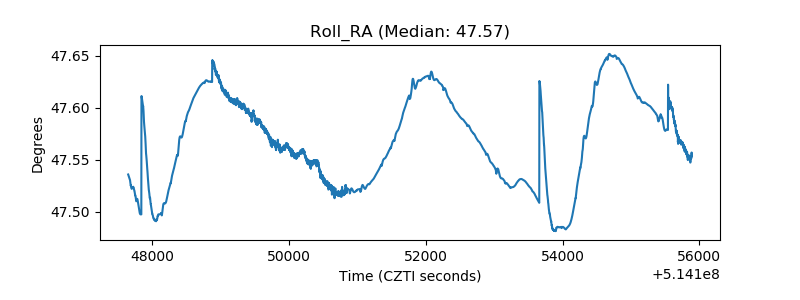 |
| Veto Counter | 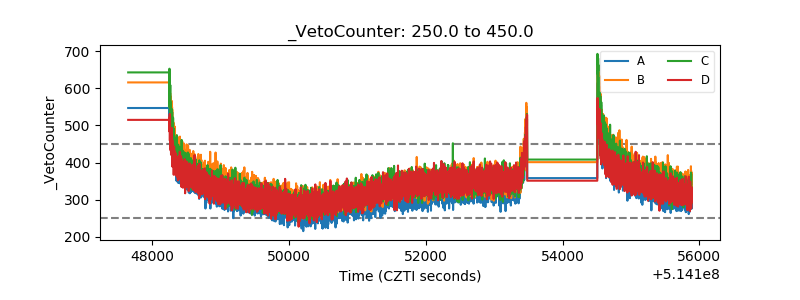 |