| Param | Original file | Final file |
|---|---|---|
| Filename | modeM0/AS1A14_083T10_9000006566_57101cztM0_level2.fits | modeM0/AS1A14_083T10_9000006566_57101cztM0_level2_quad_clean.evt |
| Size (bytes) | 480,441,600 | 93,513,600 |
| Size | 458.2 MB | 89.2 MB |
| Events in quadrant A | 3,279,278 | 627,424 |
| Events in quadrant B | 3,971,796 | 653,773 |
| Events in quadrant C | 3,241,289 | 599,803 |
| Events in quadrant D | 6,796,612 | 505,324 |
| Mode M9 | |||
|---|---|---|---|
| Quadrant | BADHDUFLAG | Total packets | Discarded packets |
| A | 0 | 18 | 0 |
| B | 0 | 19 | 0 |
| C | 0 | 19 | 0 |
| D | 0 | 19 | 0 |
| Mode M0 | |||
|---|---|---|---|
| Quadrant | BADHDUFLAG | Total packets | Discarded packets |
| A | 0 | 14280 | 2 |
| B | 0 | 16091 | 2 |
| C | 0 | 14263 | 2 |
| D | 0 | 24595 | 2 |
| Mode SS | |||
|---|---|---|---|
| Quadrant | BADHDUFLAG | Total packets | Discarded packets |
| A | 0 | 130 | 0 |
| B | 0 | 130 | 0 |
| C | 0 | 130 | 0 |
| D | 0 | 130 | 0 |
| Quadrant | Total seconds | Saturated seconds | Saturation percentage |
|---|---|---|---|
| A | 6377 | 122 | 1.913125% |
| B | 6377 | 333 | 5.221891% |
| C | 6377 | 74 | 1.160420% |
| D | 6376 | 799 | 12.531368% |
Noise dominated data is calculated using 1-second bins in cleaned event files. If a bin has >2000 counts, and if more than 50% of those come from <1% of pixels, then it is considered to be noise-dominated and hence unusable.
| Quadrant | # 1 sec bins | Bins with >0 counts | Bins with >2000 counts | High rate bins dominated by noise | Noise dominated (total time) | Noise dominated (detector-on time) | Marked lightcurve |
|---|---|---|---|---|---|---|---|
| A | 7487 | 6378 | 49 | 49 | 0.65% | 0.77% | 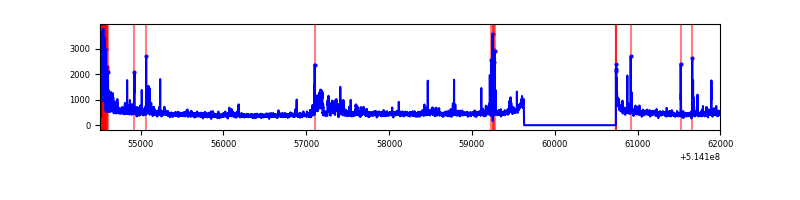 |
| B | 7487 | 6378 | 152 | 152 | 2.03% | 2.38% | 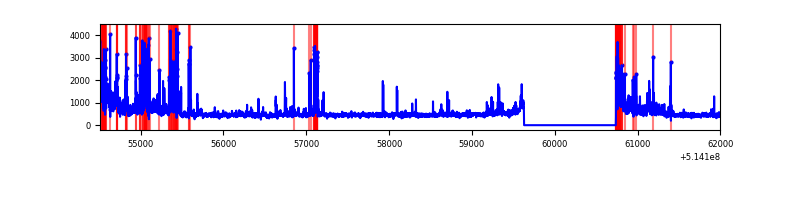 |
| C | 7487 | 6378 | 52 | 52 | 0.69% | 0.82% | 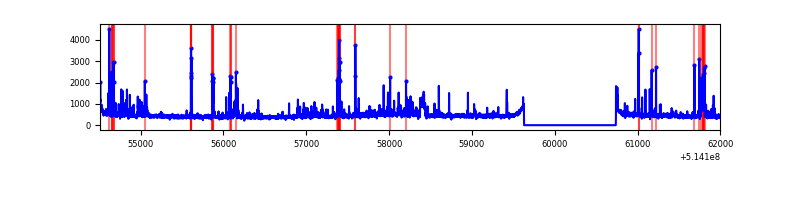 |
| D | 7486 | 6377 | 889 | 889 | 11.88% | 13.94% | 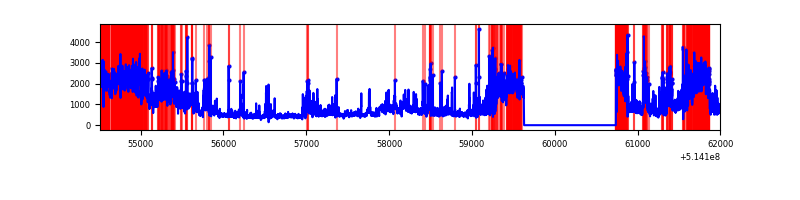 |
Top three noisy pixels from each quadrant. If the there are fewer than three noisy pixels in the level2.evt file, extra rows are filled as -1
| Pixel properties | Quadrant properties | ||||||
|---|---|---|---|---|---|---|---|
| Quadrant | DetID | PixID | Counts | Sigma | Mean | Median | Sigma |
| A | 10 | 251 | 203671 | 1181.03 | 697 | 680 | 171.9 |
| A | 3 | 14 | 183934 | 1066.2 | 697 | 680 | 171.9 |
| A | 4 | 13 | 57810 | 332.39 | 697 | 680 | 171.9 |
| B | 10 | 16 | 821739 | 5750.94 | 673 | 650 | 142.8 |
| B | 4 | 171 | 114605 | 798.15 | 673 | 650 | 142.8 |
| B | 0 | 197 | 105303 | 732.99 | 673 | 650 | 142.8 |
| C | 6 | 223 | 228655 | 1235.53 | 679 | 672 | 184.5 |
| C | 14 | 254 | 89885 | 483.48 | 679 | 672 | 184.5 |
| C | 1 | 16 | 79776 | 428.69 | 679 | 672 | 184.5 |
| D | 15 | 142 | 2533034 | 13739.29 | 643 | 612 | 184.3 |
| D | 12 | 33 | 740616 | 4014.78 | 643 | 612 | 184.3 |
| D | 8 | 240 | 359761 | 1948.51 | 643 | 612 | 184.3 |
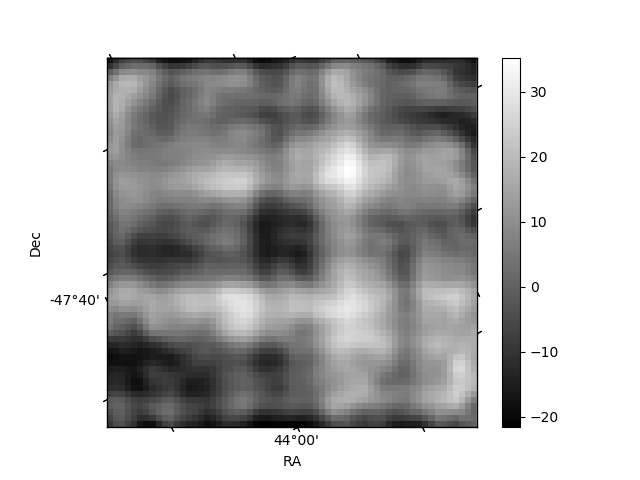
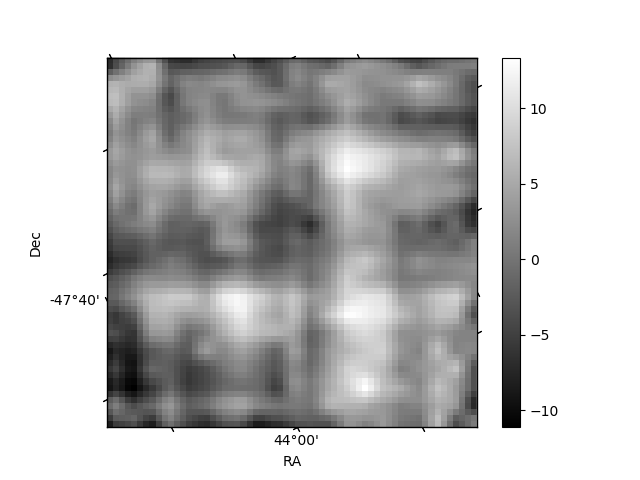
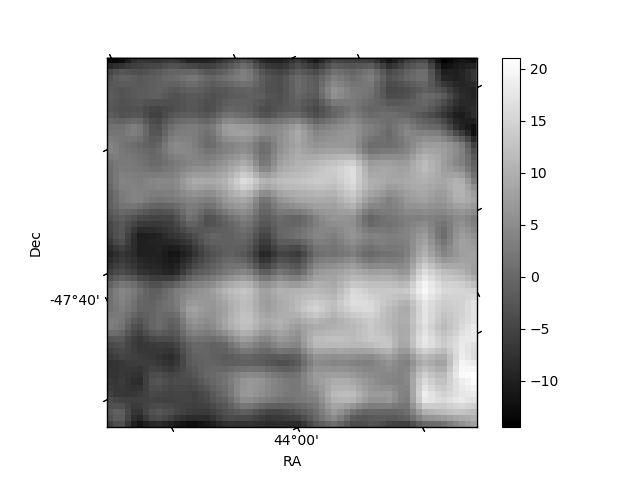
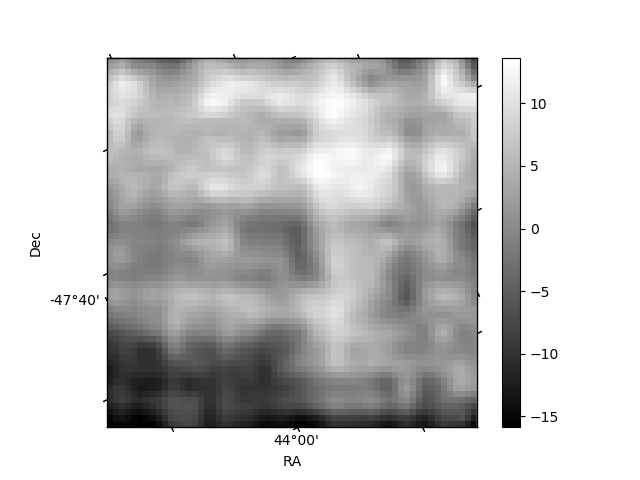
Histogram calculated using DETX and DETY for each event in the final _common_clean file
| Quadrant A | 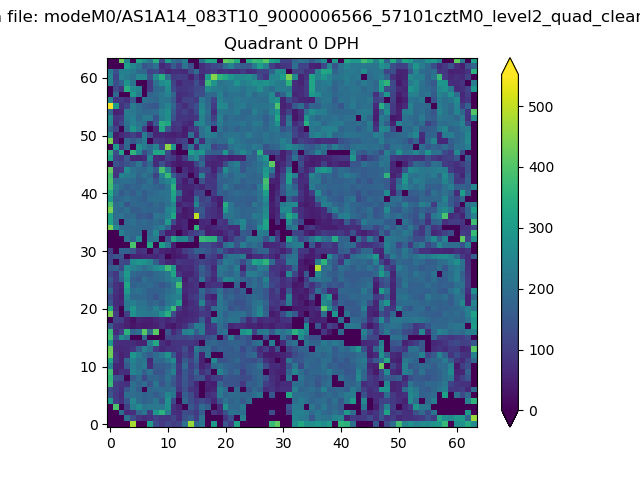 |
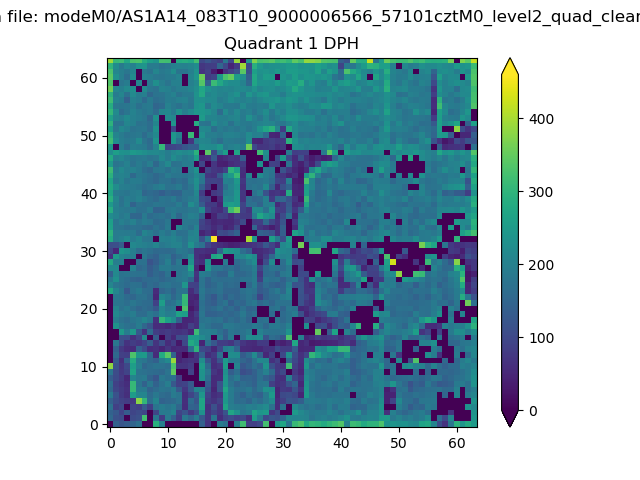 |
Quadrant B |
|---|---|---|---|
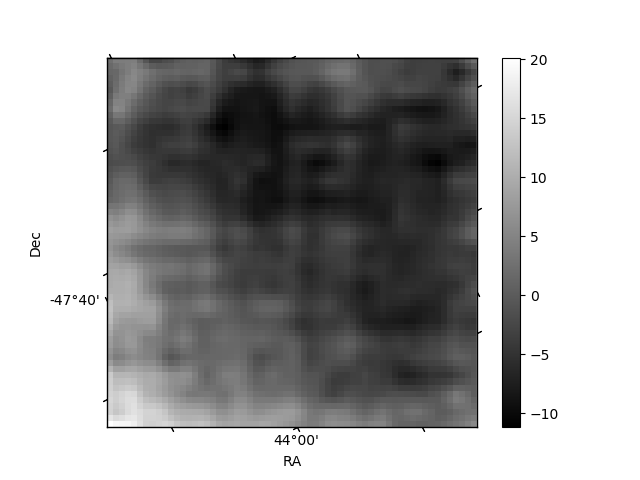
| Quadrant D | 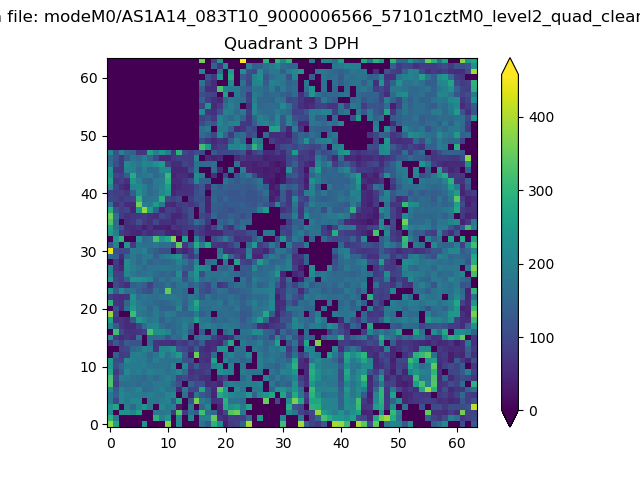 |
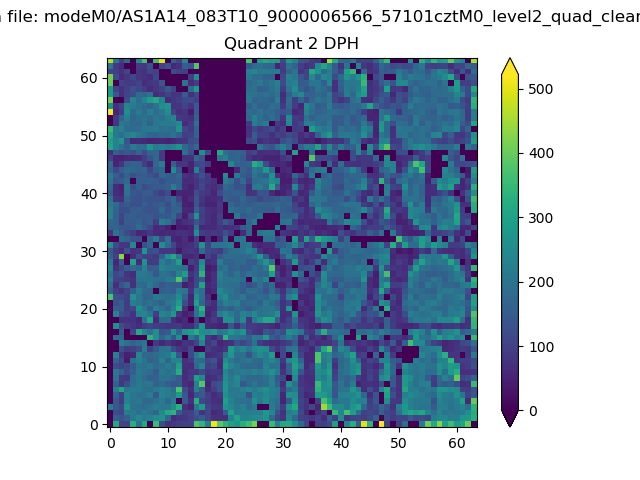 |
Quadrant C |
| Plot type | Count rate plots | Images |
|---|---|---|
| Comparison with Poisson distribution Blue bars denote a histogram of data divided into 1 sec bins. Red curve is a Poisson curve with rate = median count rate of data. |
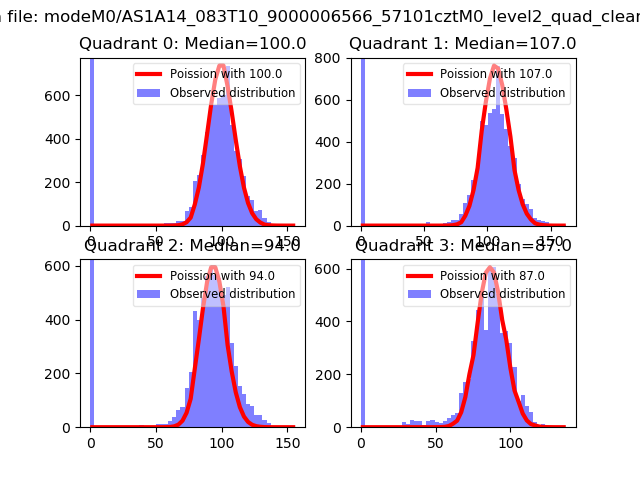 |
 |
| Quadrant-wise count rates Data is divided into 100 sec bins |
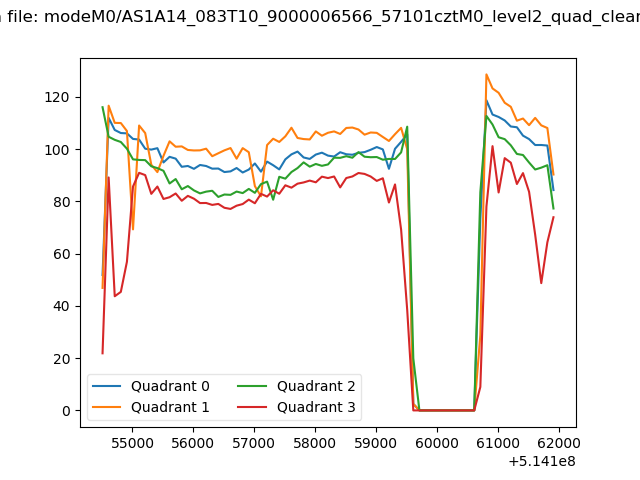 |
|
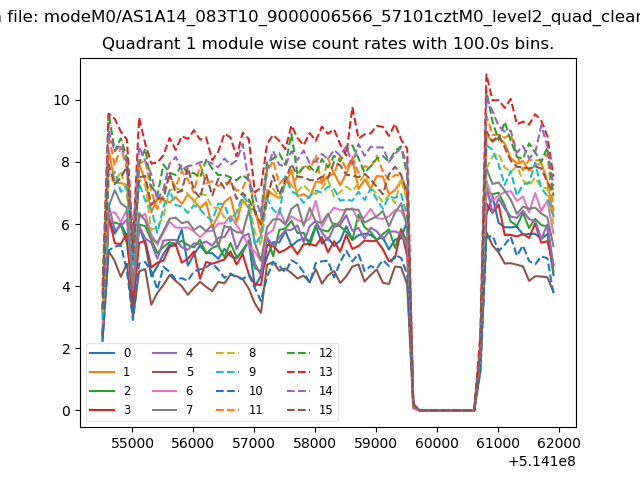
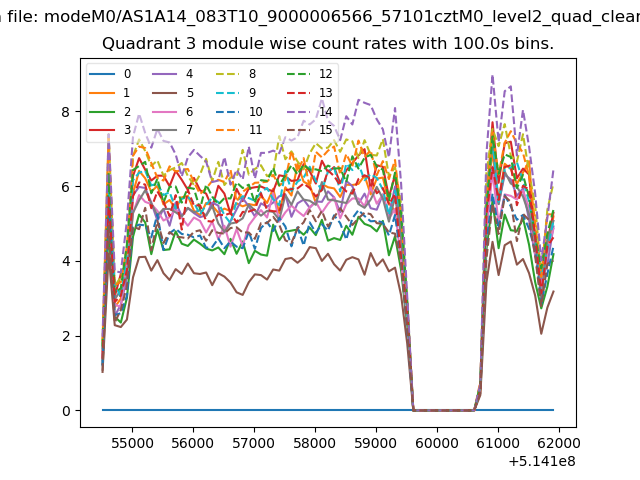
| Module-wise count rates for Quadrant A Data is divided into 100 sec bins |
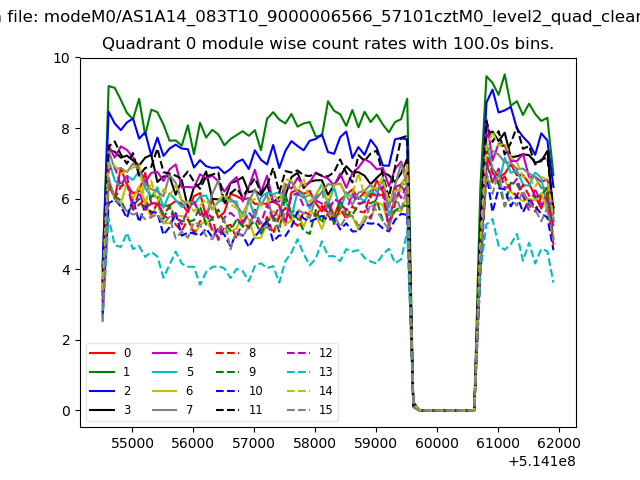 |
 |
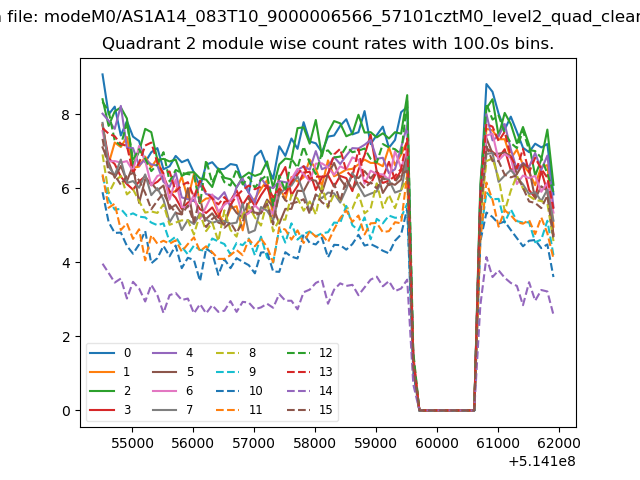
| Module-wise count rates for Quadrant B Data is divided into 100 sec bins |
 |
 |
| Module-wise count rates for Quadrant C Data is divided into 100 sec bins |
 |
 |
| Module-wise count rates for Quadrant D Data is divided into 100 sec bins |
 |
 |
| Parameter | Plot |
|---|---|
| CZT HV Monitor | 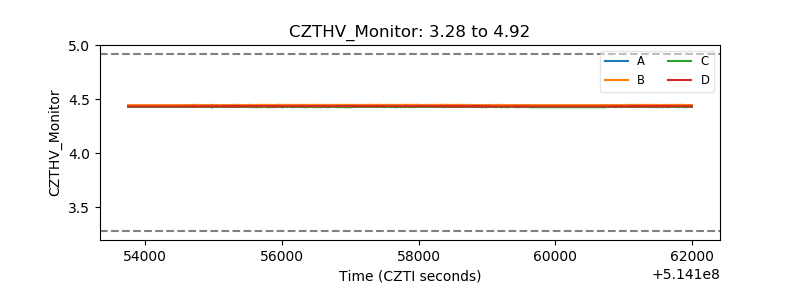 |
| D_VDD | 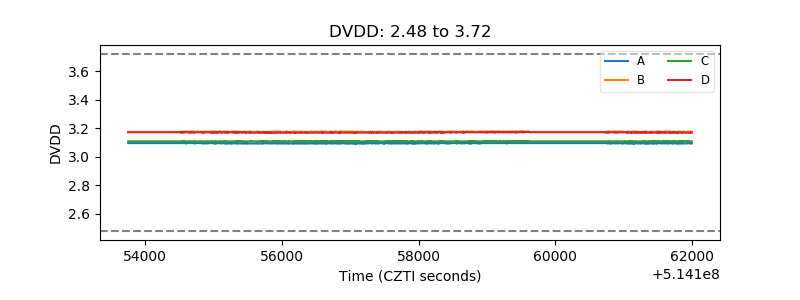 |
| Temperature 1 | 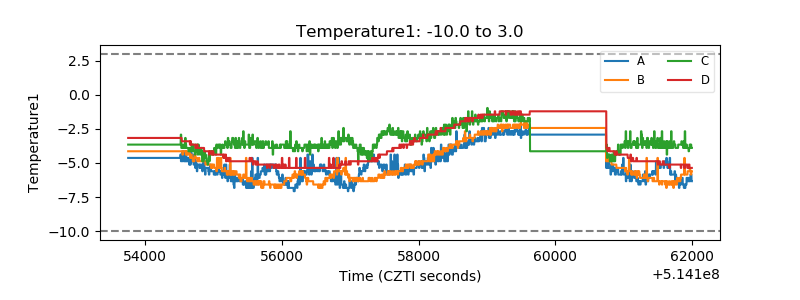 |
| Veto HV Monitor | 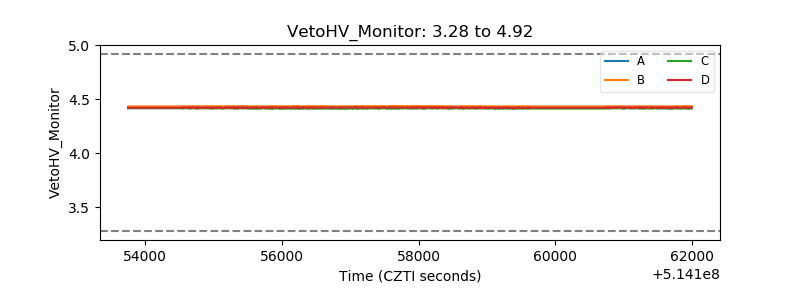 |
| Veto LLD | 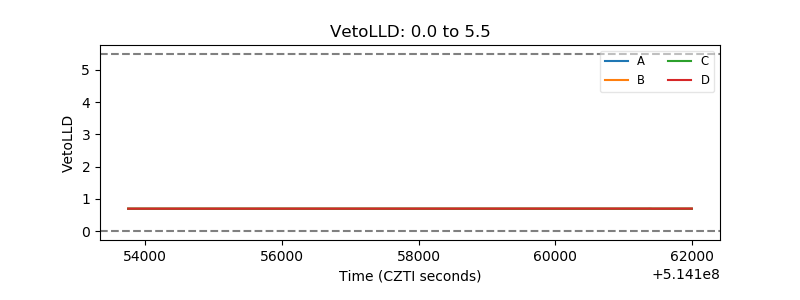 |
| Alpha Counter | 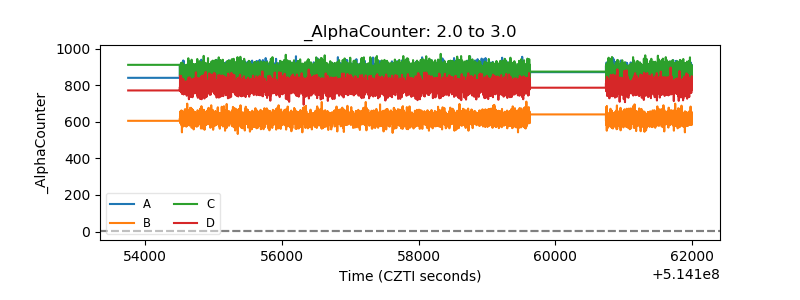 |
| _CPM_Rate | 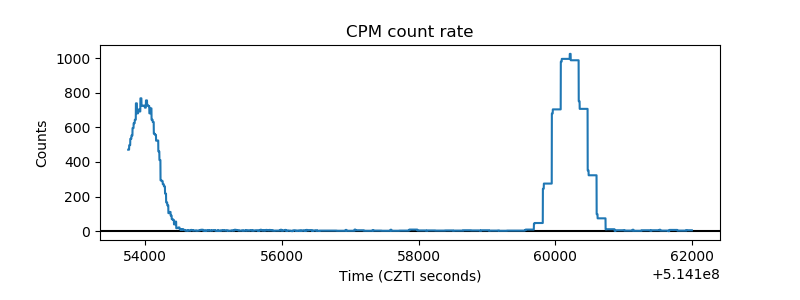 |
| CZT Counter | 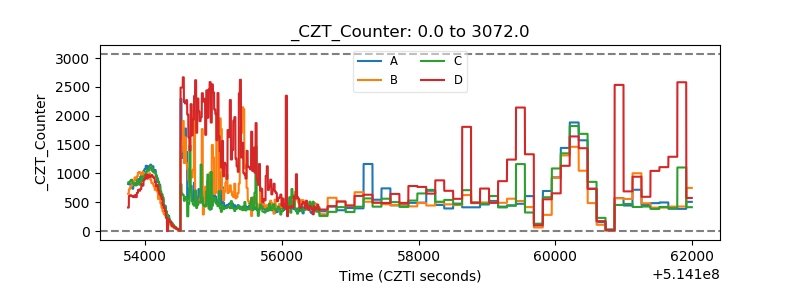 |
| +2.5 Volts monitor | 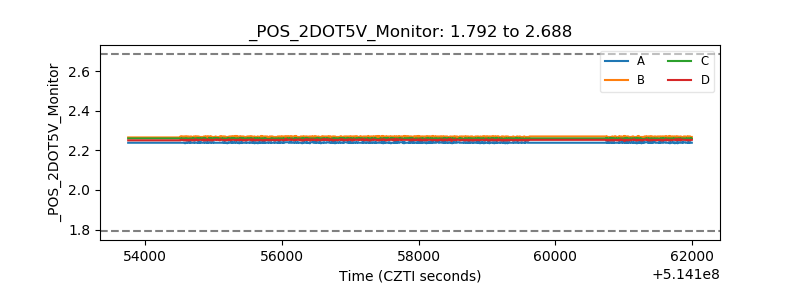 |
| +5 Volts monitor | 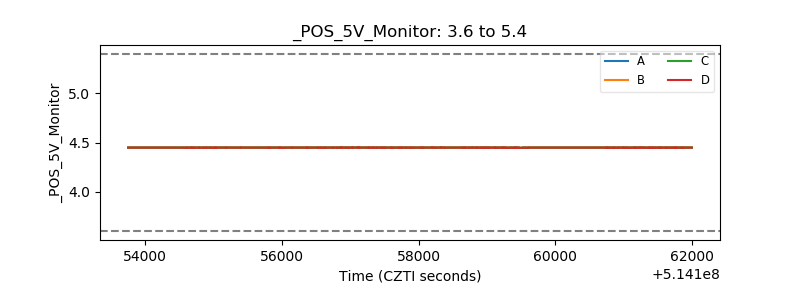 |
| _ROLL_ROT | 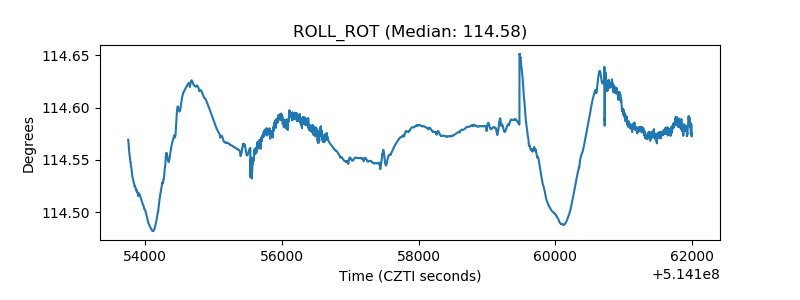 |
| _Roll_DEC | 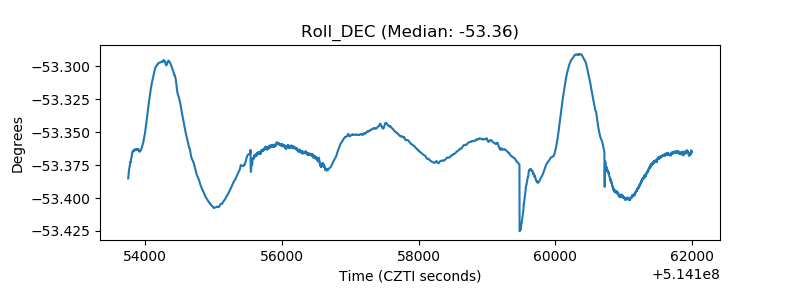 |
| _Roll_RA | 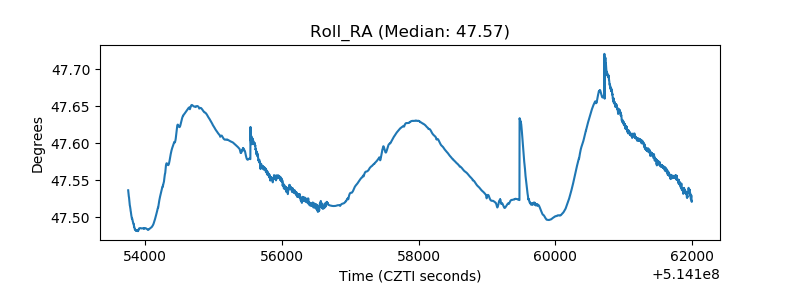 |
| Veto Counter | 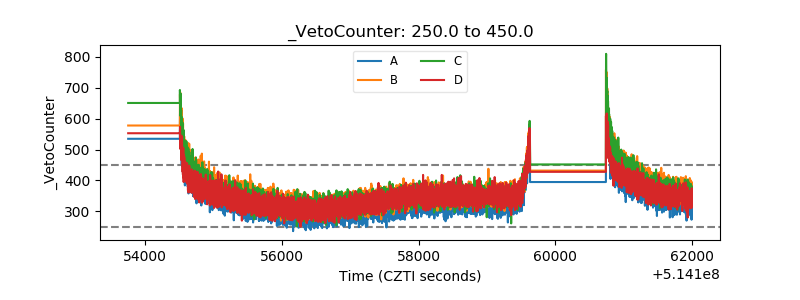 |