| Param | Original file | Final file |
|---|---|---|
| Filename | modeM0/AS1A14_083T10_9000006566_57102cztM0_level2.fits | modeM0/AS1A14_083T10_9000006566_57102cztM0_level2_quad_clean.evt |
| Size (bytes) | 444,507,840 | 96,932,160 |
| Size | 423.9 MB | 92.4 MB |
| Events in quadrant A | 3,096,780 | 650,994 |
| Events in quadrant B | 3,634,832 | 681,395 |
| Events in quadrant C | 3,061,875 | 617,301 |
| Events in quadrant D | 6,163,829 | 539,388 |
| Mode M9 | |||
|---|---|---|---|
| Quadrant | BADHDUFLAG | Total packets | Discarded packets |
| A | 0 | 20 | 0 |
| B | 0 | 21 | 0 |
| C | 0 | 21 | 0 |
| D | 0 | 21 | 0 |
| Mode M0 | |||
|---|---|---|---|
| Quadrant | BADHDUFLAG | Total packets | Discarded packets |
| A | 0 | 13640 | 2 |
| B | 0 | 15307 | 2 |
| C | 0 | 13724 | 2 |
| D | 0 | 22751 | 2 |
| Mode SS | |||
|---|---|---|---|
| Quadrant | BADHDUFLAG | Total packets | Discarded packets |
| A | 0 | 130 | 0 |
| B | 0 | 130 | 0 |
| C | 0 | 130 | 0 |
| D | 0 | 130 | 0 |
| Quadrant | Total seconds | Saturated seconds | Saturation percentage |
|---|---|---|---|
| A | 6393 | 64 | 1.001095% |
| B | 6393 | 272 | 4.254654% |
| C | 6393 | 58 | 0.907242% |
| D | 6393 | 560 | 8.759581% |
Noise dominated data is calculated using 1-second bins in cleaned event files. If a bin has >2000 counts, and if more than 50% of those come from <1% of pixels, then it is considered to be noise-dominated and hence unusable.
| Quadrant | # 1 sec bins | Bins with >0 counts | Bins with >2000 counts | High rate bins dominated by noise | Noise dominated (total time) | Noise dominated (detector-on time) | Marked lightcurve |
|---|---|---|---|---|---|---|---|
| A | 7573 | 6394 | 12 | 12 | 0.16% | 0.19% | 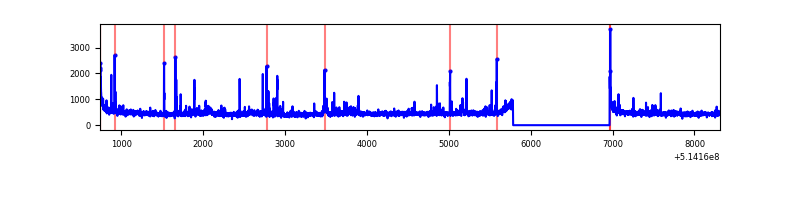 |
| B | 7573 | 6394 | 128 | 128 | 1.69% | 2.00% | 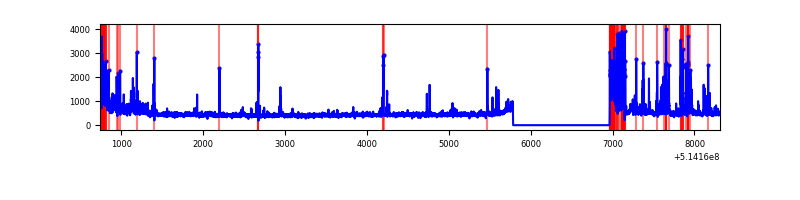 |
| C | 7573 | 6394 | 23 | 23 | 0.30% | 0.36% | 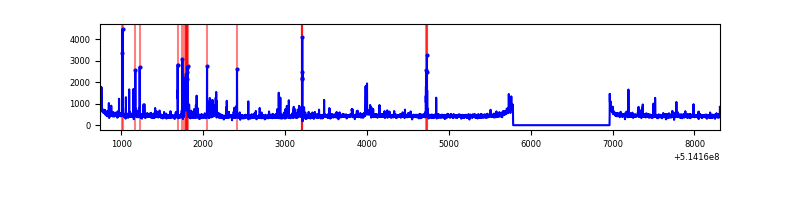 |
| D | 7573 | 6394 | 585 | 585 | 7.72% | 9.15% | 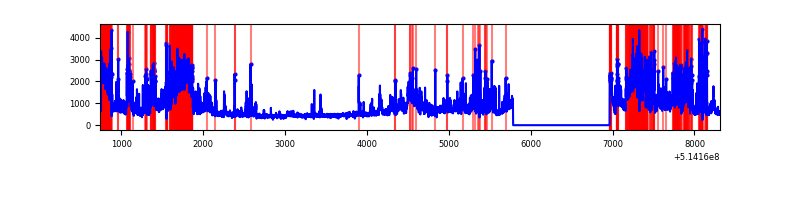 |
Top three noisy pixels from each quadrant. If the there are fewer than three noisy pixels in the level2.evt file, extra rows are filled as -1
| Pixel properties | Quadrant properties | ||||||
|---|---|---|---|---|---|---|---|
| Quadrant | DetID | PixID | Counts | Sigma | Mean | Median | Sigma |
| A | 3 | 14 | 131018 | 746.9 | 715 | 696 | 174.5 |
| A | 10 | 251 | 78111 | 443.68 | 715 | 696 | 174.5 |
| A | 5 | 113 | 45279 | 255.51 | 715 | 696 | 174.5 |
| B | 10 | 16 | 631378 | 4313.01 | 691 | 665 | 146.2 |
| B | 0 | 213 | 63448 | 429.33 | 691 | 665 | 146.2 |
| B | 0 | 63 | 48061 | 324.11 | 691 | 665 | 146.2 |
| C | 6 | 223 | 141874 | 754.97 | 694 | 689 | 187.0 |
| C | 12 | 252 | 66457 | 351.69 | 694 | 689 | 187.0 |
| C | 14 | 254 | 37156 | 195.0 | 694 | 689 | 187.0 |
| D | 12 | 33 | 1444996 | 7578.76 | 670 | 637 | 190.6 |
| D | 15 | 142 | 1326008 | 6954.42 | 670 | 637 | 190.6 |
| D | 7 | 96 | 217009 | 1135.34 | 670 | 637 | 190.6 |
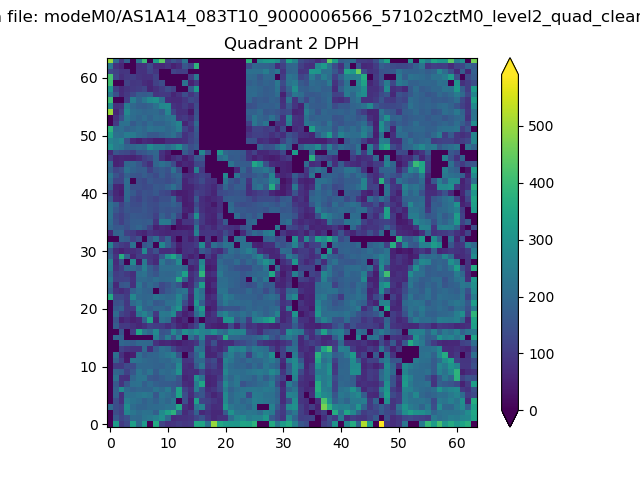
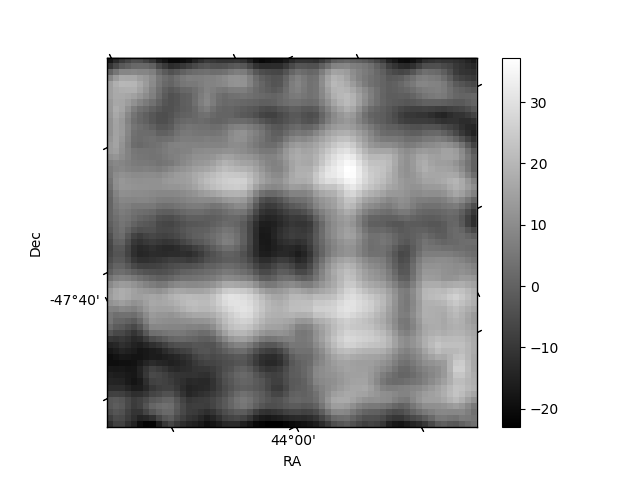
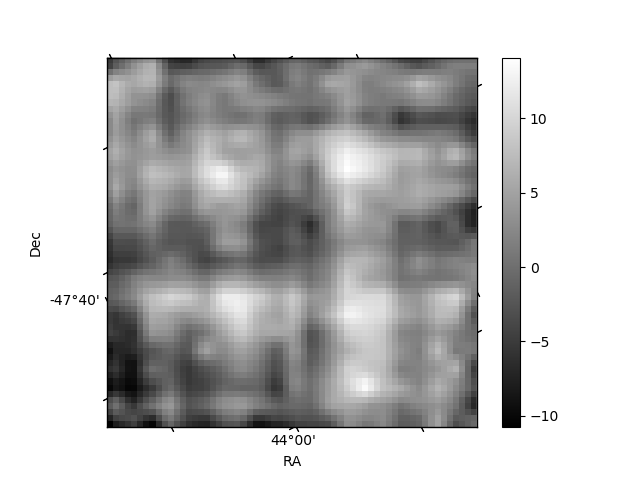
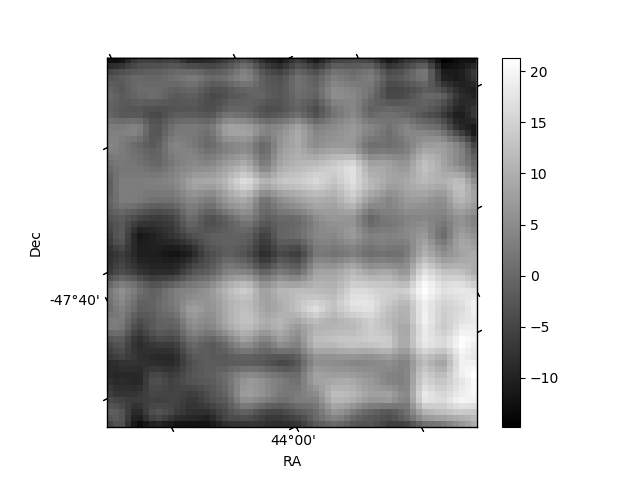
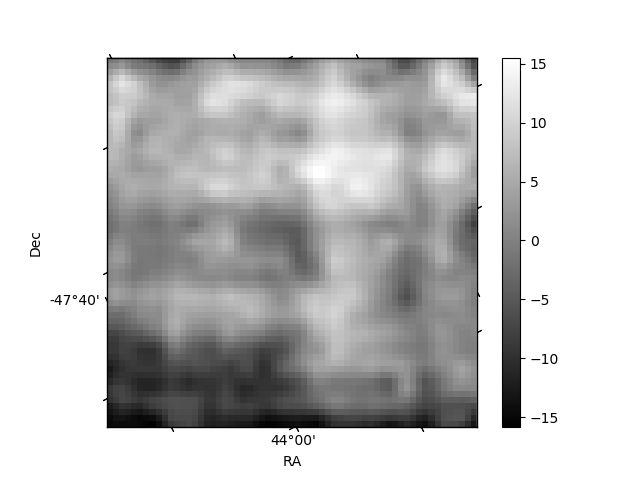
Histogram calculated using DETX and DETY for each event in the final _common_clean file
| Quadrant A | 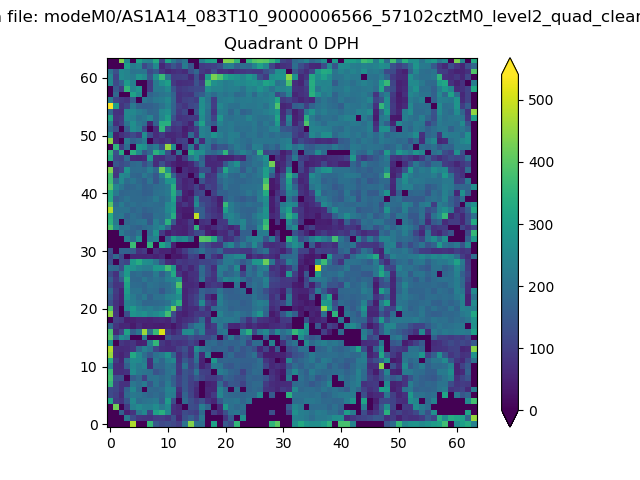 |
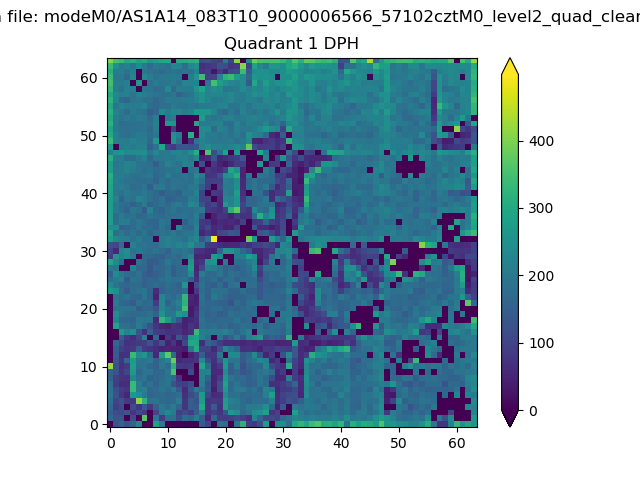 |
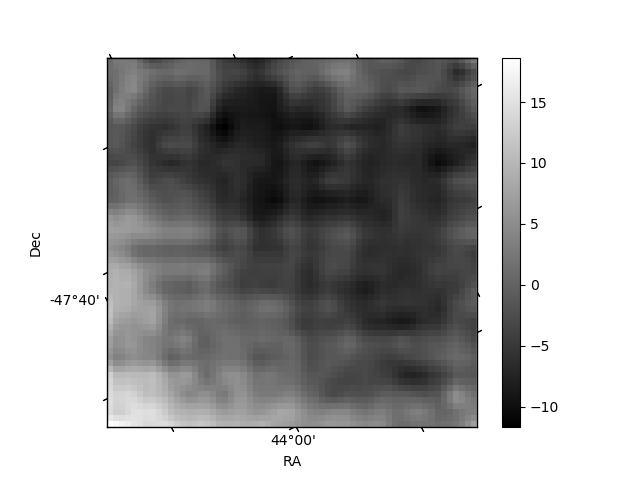
Quadrant B |
|---|---|---|---|
| Quadrant D | 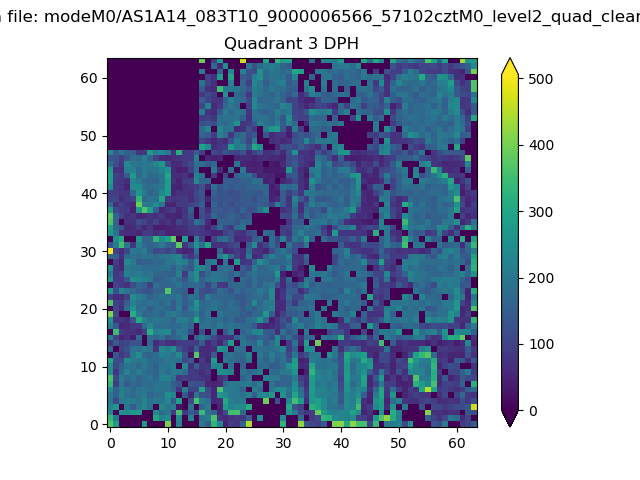 |
 |
Quadrant C |
| Plot type | Count rate plots | Images |
|---|---|---|
| Comparison with Poisson distribution Blue bars denote a histogram of data divided into 1 sec bins. Red curve is a Poisson curve with rate = median count rate of data. |
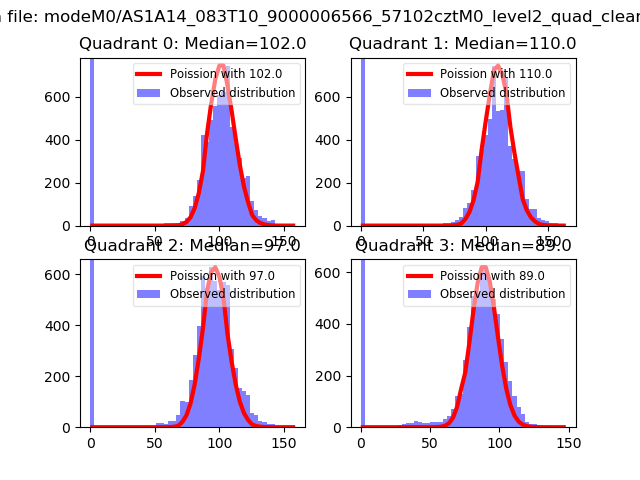 |
 |
| Quadrant-wise count rates Data is divided into 100 sec bins |
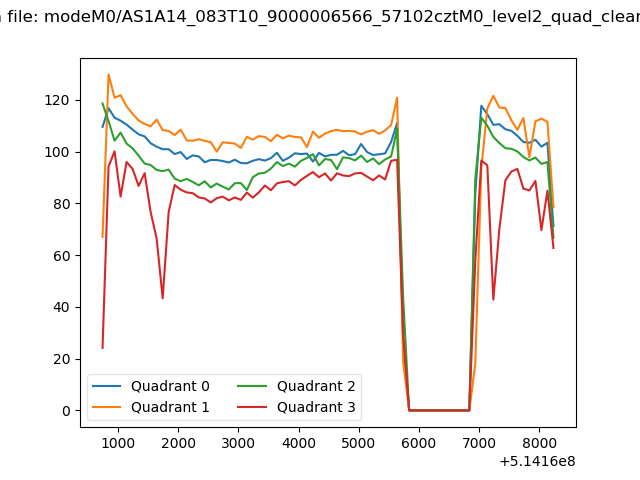 |
|
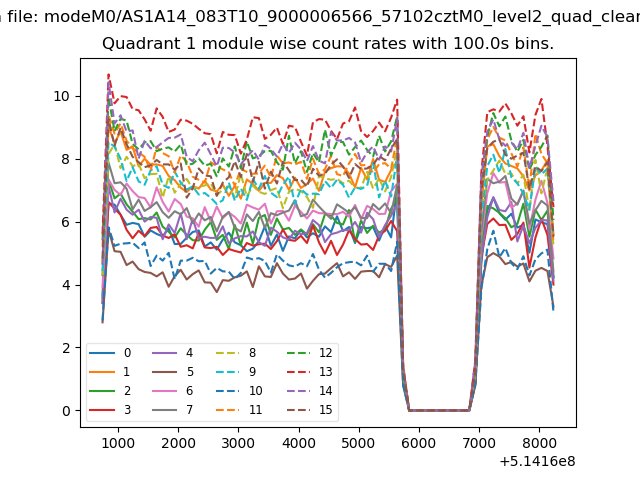
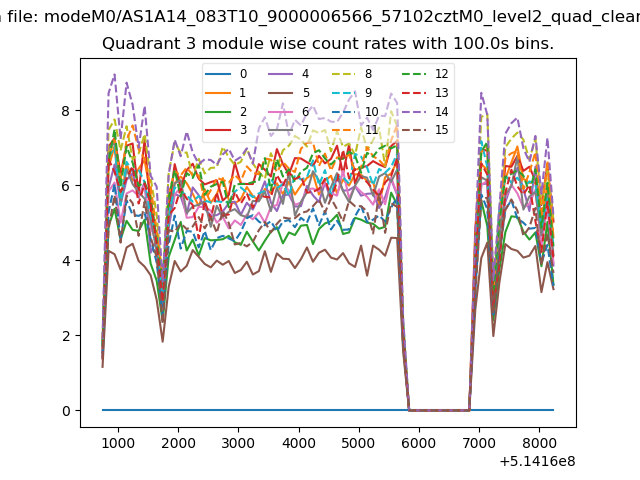
| Module-wise count rates for Quadrant A Data is divided into 100 sec bins |
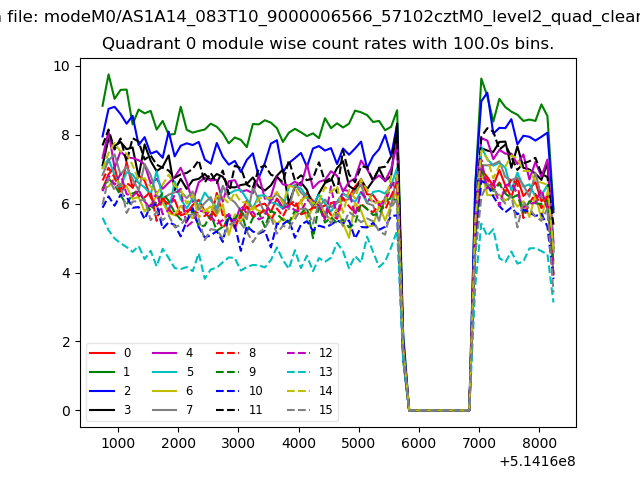 |
 |
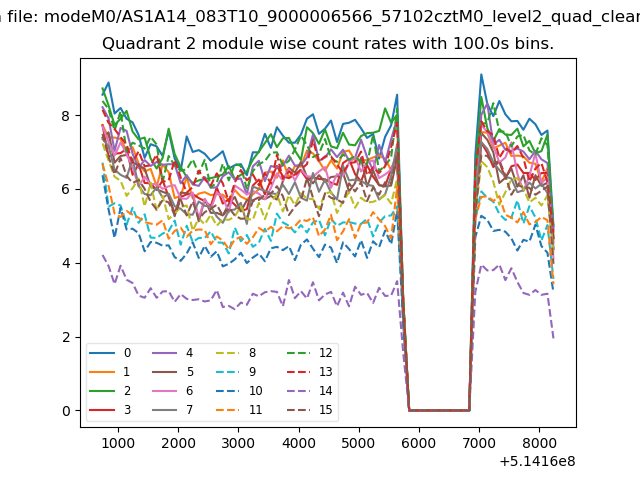
| Module-wise count rates for Quadrant B Data is divided into 100 sec bins |
 |
 |
| Module-wise count rates for Quadrant C Data is divided into 100 sec bins |
 |
 |
| Module-wise count rates for Quadrant D Data is divided into 100 sec bins |
 |
 |
| Parameter | Plot |
|---|---|
| CZT HV Monitor | 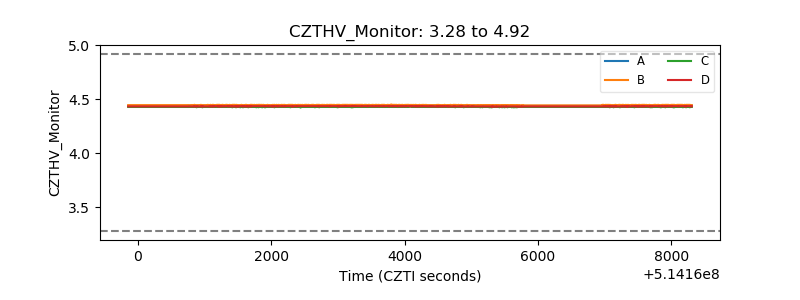 |
| D_VDD | 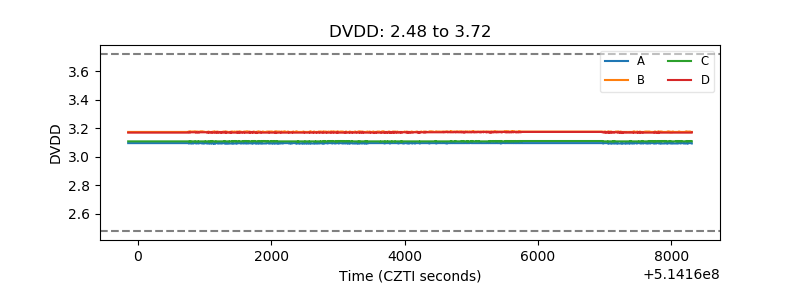 |
| Temperature 1 | 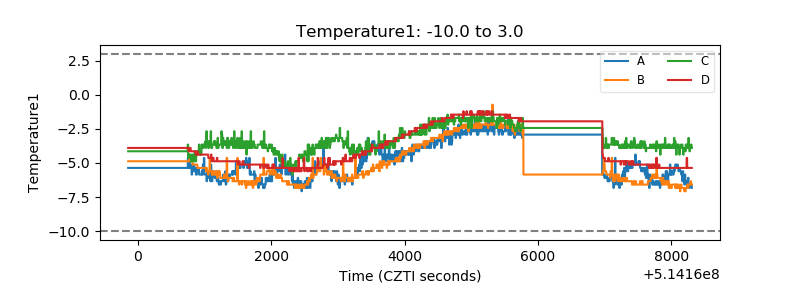 |
| Veto HV Monitor | 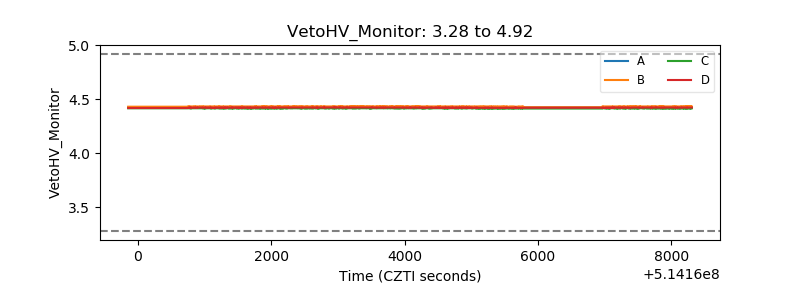 |
| Veto LLD | 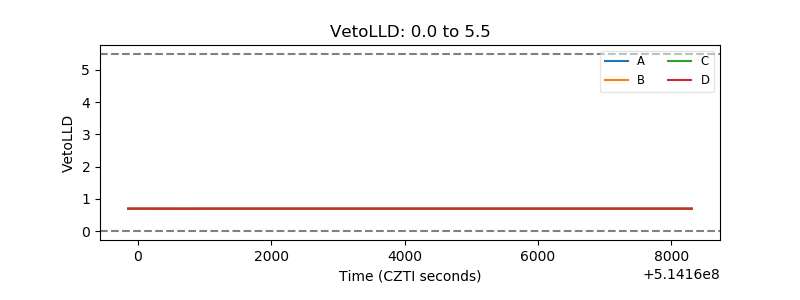 |
| Alpha Counter | 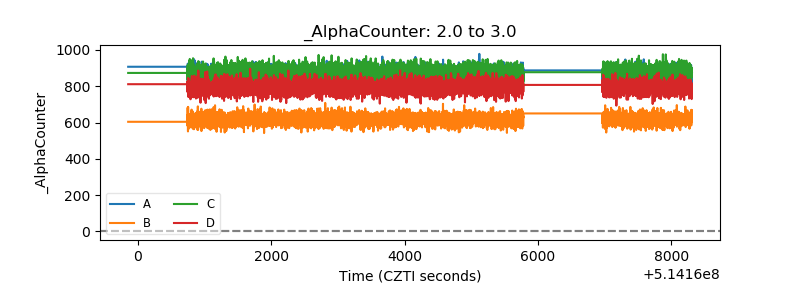 |
| _CPM_Rate | 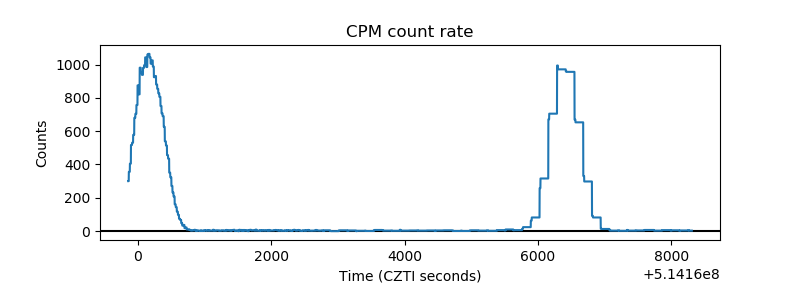 |
| CZT Counter | 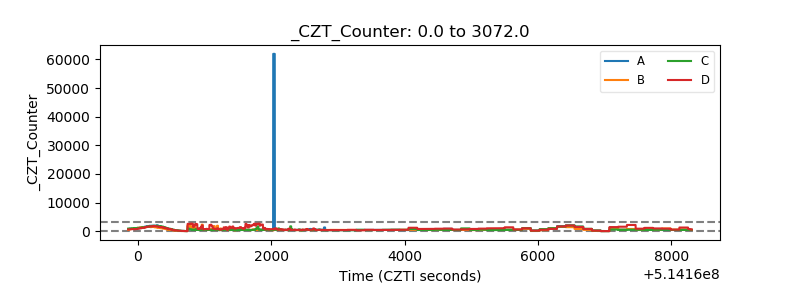 |
| +2.5 Volts monitor | 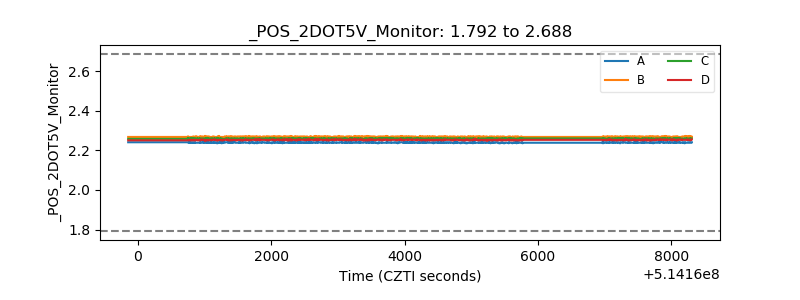 |
| +5 Volts monitor | 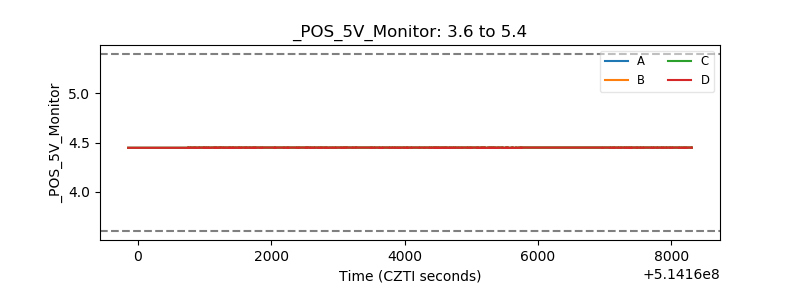 |
| _ROLL_ROT | 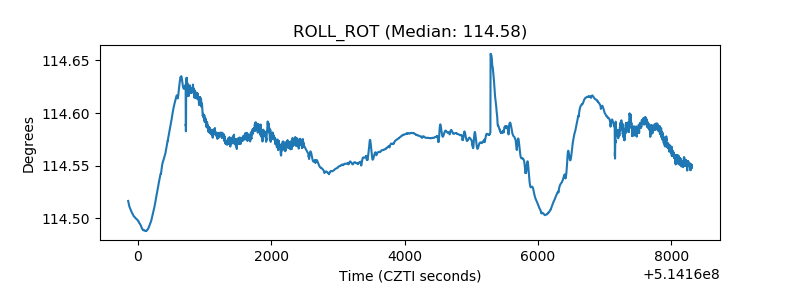 |
| _Roll_DEC | 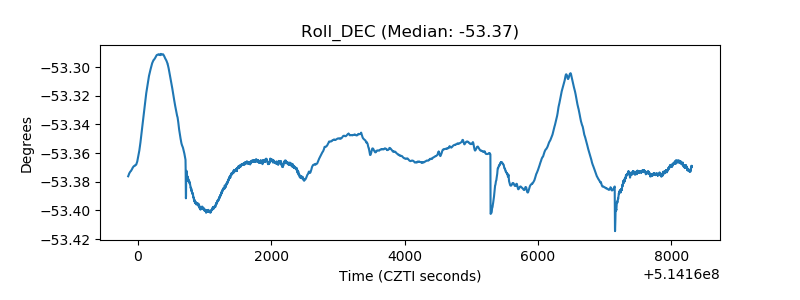 |
| _Roll_RA | 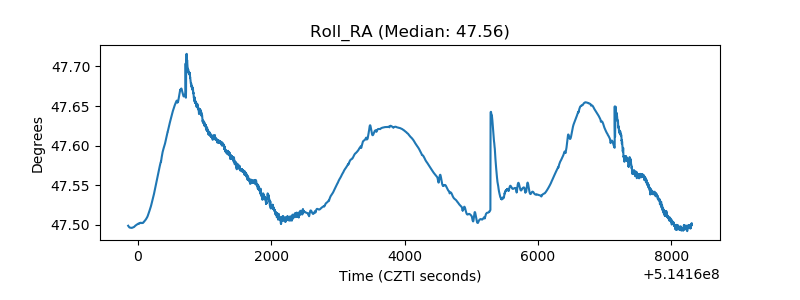 |
| Veto Counter | 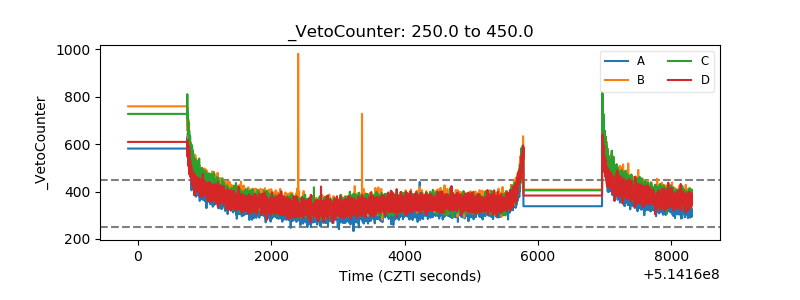 |