| Param | Original file | Final file |
|---|---|---|
| Filename | modeM0/AS1A14_083T10_9000006566_57105cztM0_level2.fits | modeM0/AS1A14_083T10_9000006566_57105cztM0_level2_quad_clean.evt |
| Size (bytes) | 324,126,720 | 56,085,120 |
| Size | 309.1 MB | 53.5 MB |
| Events in quadrant A | 2,020,313 | 379,240 |
| Events in quadrant B | 2,677,792 | 374,347 |
| Events in quadrant C | 2,002,568 | 366,471 |
| Events in quadrant D | 4,987,968 | 297,795 |
| Mode M9 | |||
|---|---|---|---|
| Quadrant | BADHDUFLAG | Total packets | Discarded packets |
| A | 0 | 7 | 0 |
| B | 0 | 7 | 0 |
| C | 0 | 7 | 0 |
| D | 0 | 7 | 0 |
| Mode M0 | |||
|---|---|---|---|
| Quadrant | BADHDUFLAG | Total packets | Discarded packets |
| A | 0 | 9173 | 349 |
| B | 0 | 11088 | 343 |
| C | 0 | 9133 | 420 |
| D | 0 | 18559 | 1086 |
| Mode SS | |||
|---|---|---|---|
| Quadrant | BADHDUFLAG | Total packets | Discarded packets |
| A | 0 | 87 | 3 |
| B | 0 | 87 | 5 |
| C | 0 | 86 | 4 |
| D | 0 | 86 | 0 |
| Quadrant | Total seconds | Saturated seconds | Saturation percentage |
|---|---|---|---|
| A | 3976 | 141 | 3.546278% |
| B | 3975 | 465 | 11.698113% |
| C | 3981 | 108 | 2.712886% |
| D | 3928 | 611 | 15.554990% |
Noise dominated data is calculated using 1-second bins in cleaned event files. If a bin has >2000 counts, and if more than 50% of those come from <1% of pixels, then it is considered to be noise-dominated and hence unusable.
| Quadrant | # 1 sec bins | Bins with >0 counts | Bins with >2000 counts | High rate bins dominated by noise | Noise dominated (total time) | Noise dominated (detector-on time) | Marked lightcurve |
|---|---|---|---|---|---|---|---|
| A | 5702 | 4003 | 38 | 38 | 0.67% | 0.95% | 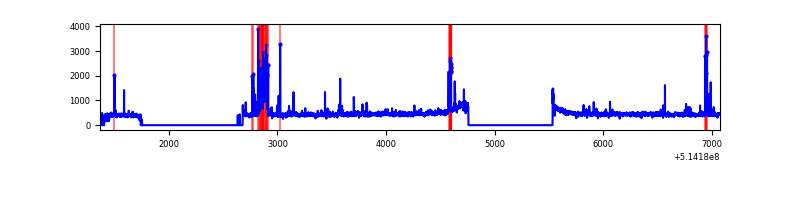 |
| B | 5703 | 4006 | 231 | 231 | 4.05% | 5.77% | 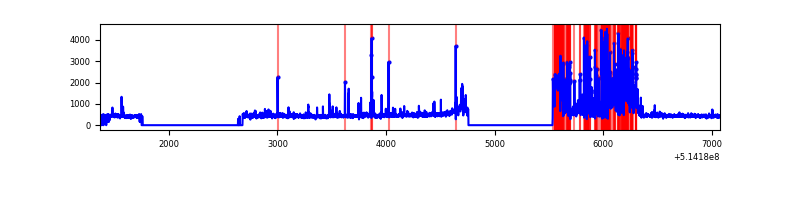 |
| C | 5708 | 4004 | 4 | 4 | 0.07% | 0.10% | 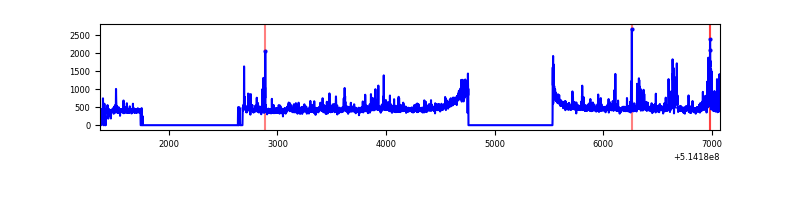 |
| D | 5686 | 3950 | 543 | 543 | 9.55% | 13.75% | 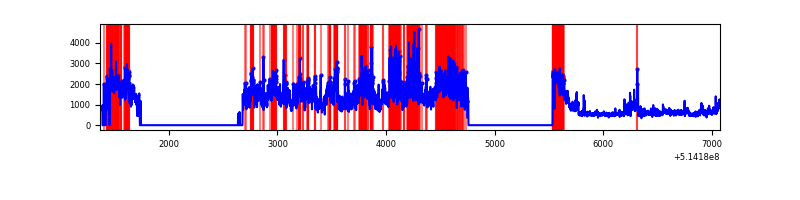 |
Top three noisy pixels from each quadrant. If the there are fewer than three noisy pixels in the level2.evt file, extra rows are filled as -1
| Pixel properties | Quadrant properties | ||||||
|---|---|---|---|---|---|---|---|
| Quadrant | DetID | PixID | Counts | Sigma | Mean | Median | Sigma |
| A | 10 | 251 | 154731 | 1384.16 | 448 | 436 | 111.5 |
| A | 13 | 248 | 50381 | 448.05 | 448 | 436 | 111.5 |
| A | 8 | 9 | 26188 | 231.02 | 448 | 436 | 111.5 |
| B | 10 | 16 | 819484 | 9202.27 | 417 | 402 | 89.0 |
| B | 4 | 171 | 90664 | 1014.08 | 417 | 402 | 89.0 |
| B | 7 | 252 | 27035 | 299.22 | 417 | 402 | 89.0 |
| C | 12 | 252 | 131075 | 1106.9 | 437 | 433 | 118.0 |
| C | 12 | 254 | 43502 | 364.91 | 437 | 433 | 118.0 |
| C | 6 | 223 | 26123 | 217.67 | 437 | 433 | 118.0 |
| D | 15 | 142 | 2546267 | 22417.02 | 402 | 383 | 113.6 |
| D | 12 | 33 | 648312 | 5705.15 | 402 | 383 | 113.6 |
| D | 8 | 240 | 39149 | 341.34 | 402 | 383 | 113.6 |
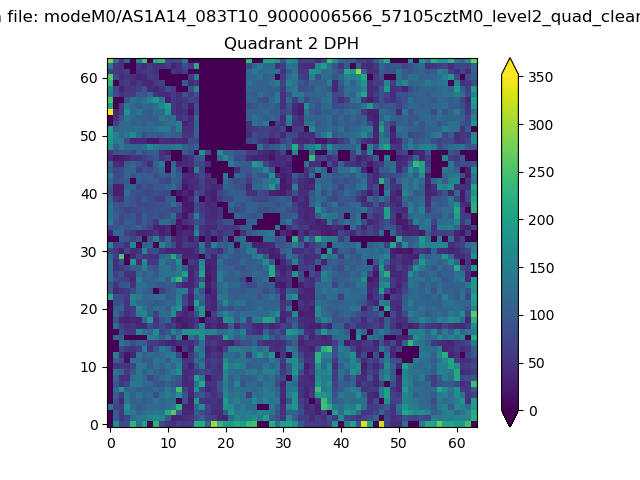
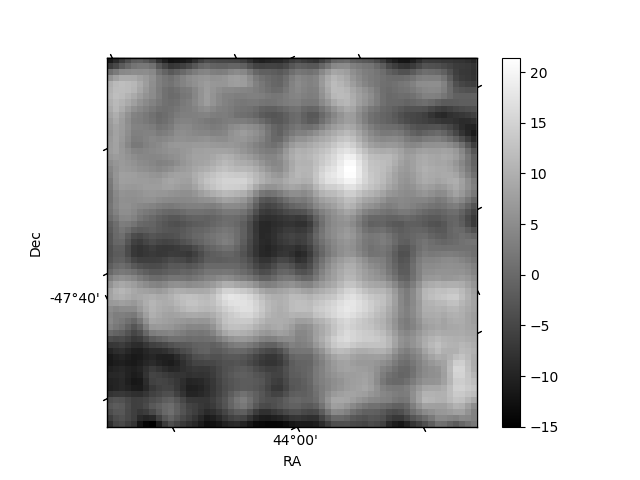
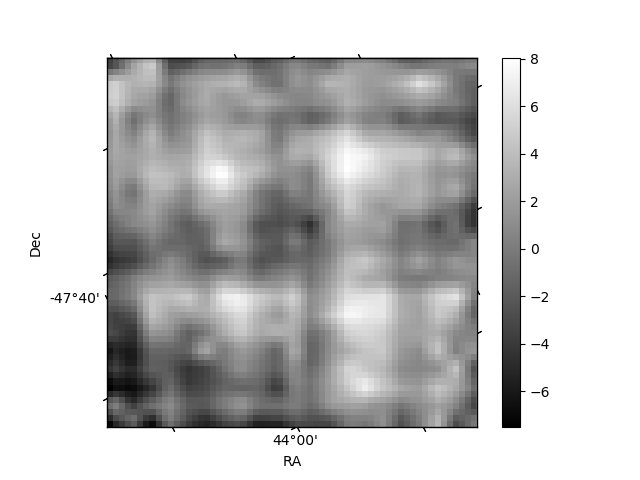
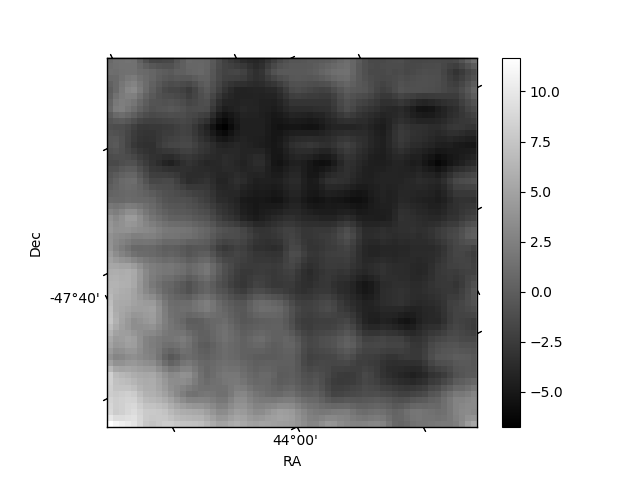
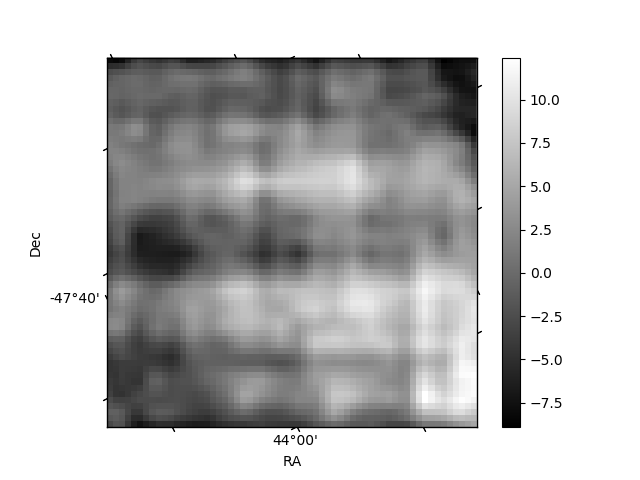
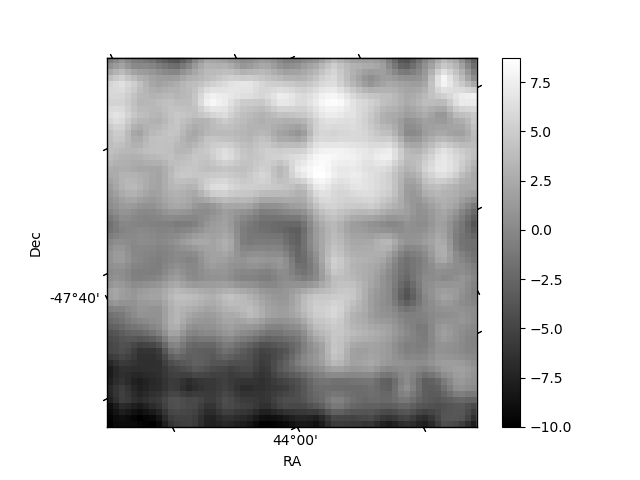
Histogram calculated using DETX and DETY for each event in the final _common_clean file
| Quadrant A | 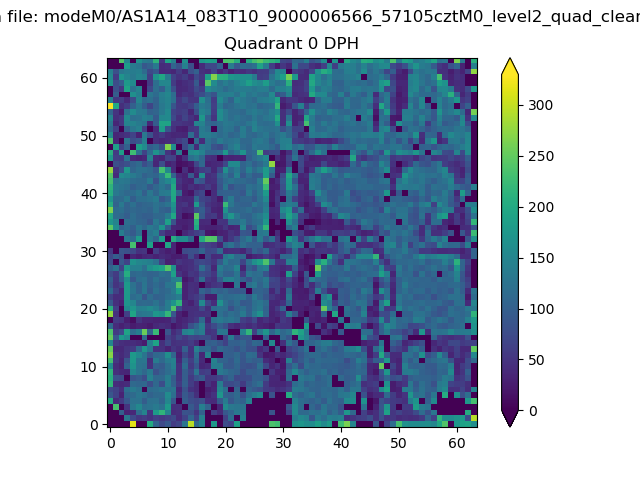 |
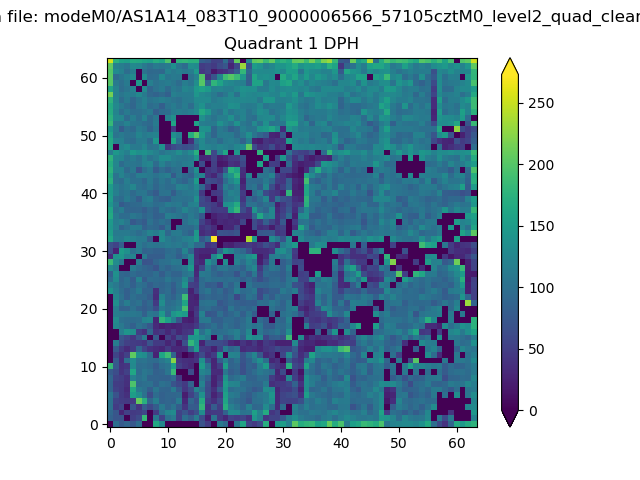 |
Quadrant B |
|---|---|---|---|
| Quadrant D | 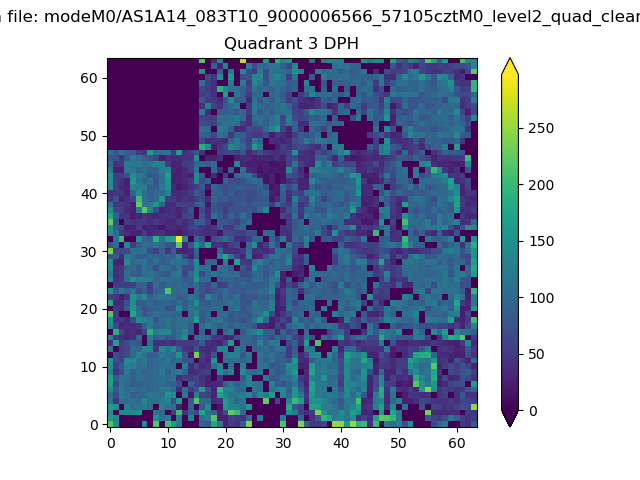 |
 |
Quadrant C |
| Plot type | Count rate plots | Images |
|---|---|---|
| Comparison with Poisson distribution Blue bars denote a histogram of data divided into 1 sec bins. Red curve is a Poisson curve with rate = median count rate of data. |
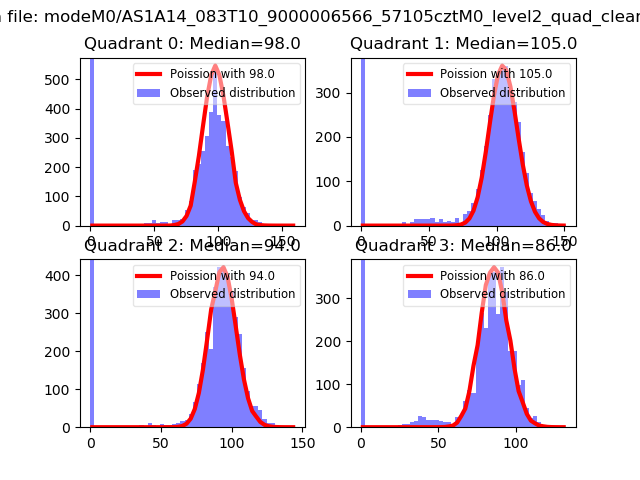 |
 |
| Quadrant-wise count rates Data is divided into 100 sec bins |
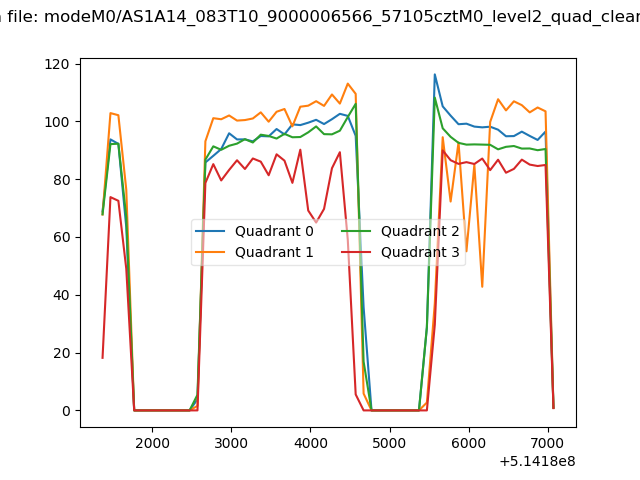 |
|
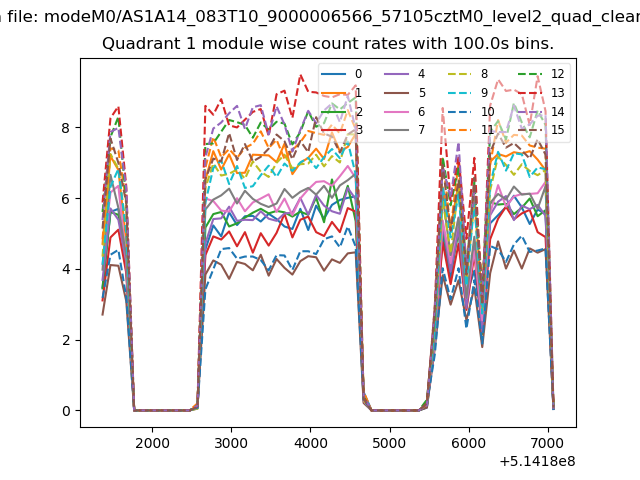
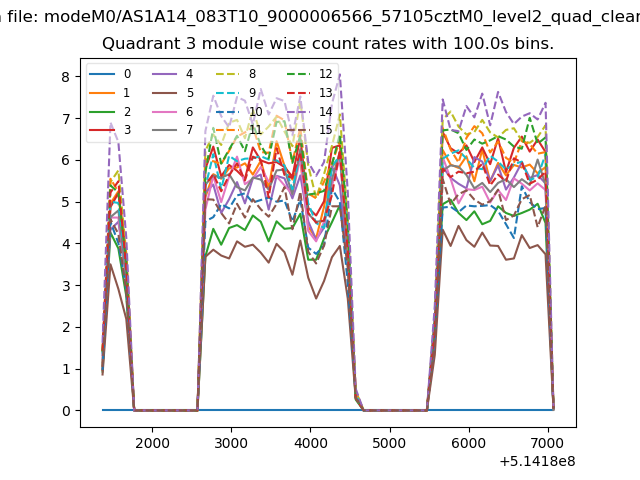
| Module-wise count rates for Quadrant A Data is divided into 100 sec bins |
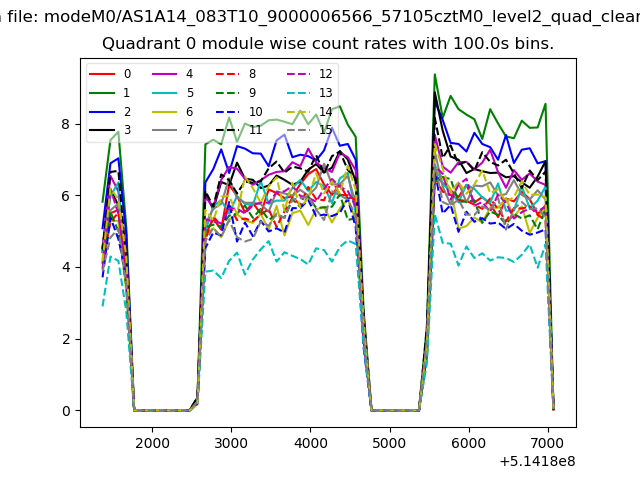 |
 |
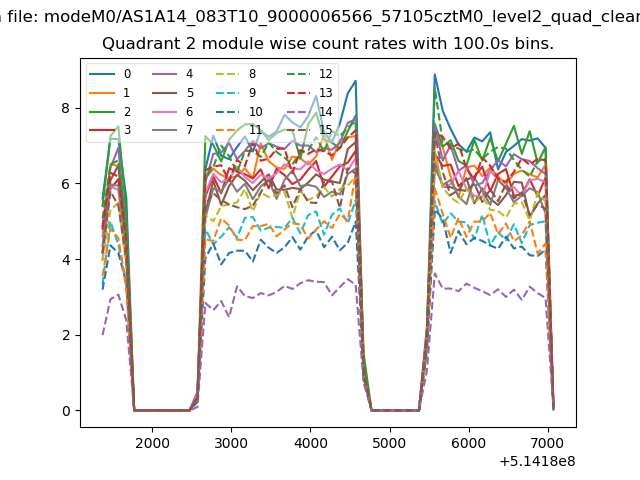
| Module-wise count rates for Quadrant B Data is divided into 100 sec bins |
 |
 |
| Module-wise count rates for Quadrant C Data is divided into 100 sec bins |
 |
 |
| Module-wise count rates for Quadrant D Data is divided into 100 sec bins |
 |
 |
| Parameter | Plot |
|---|---|
| CZT HV Monitor | 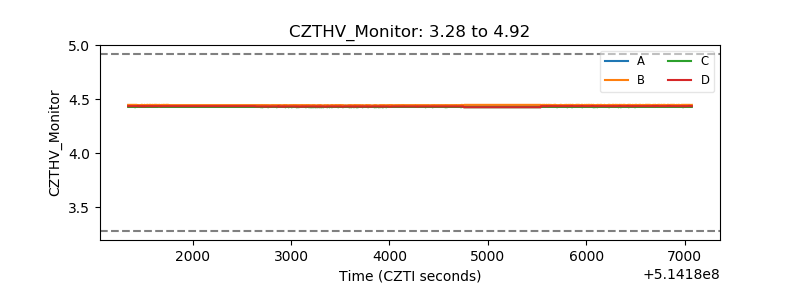 |
| D_VDD | 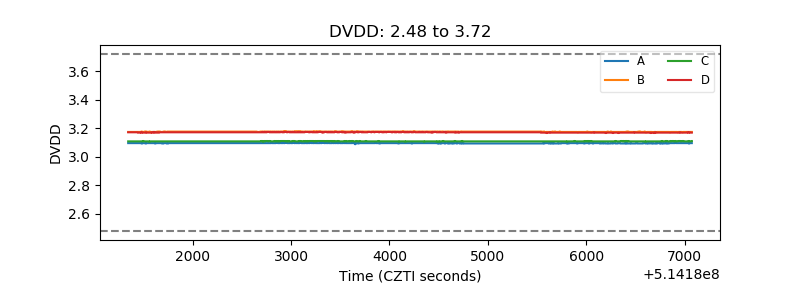 |
| Temperature 1 | 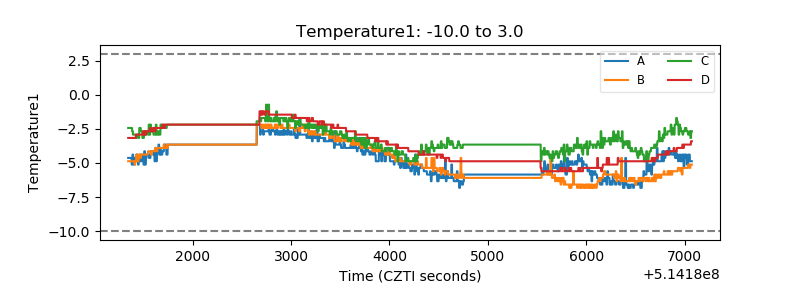 |
| Veto HV Monitor | 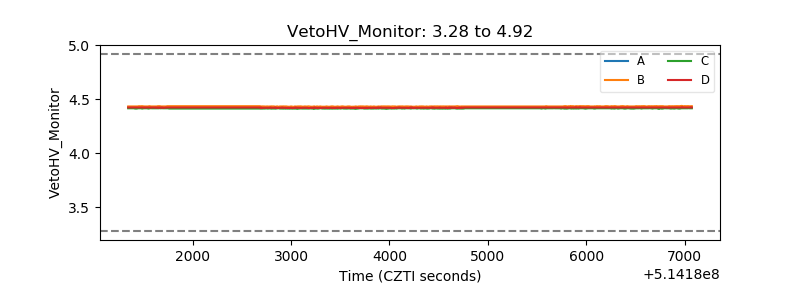 |
| Veto LLD | 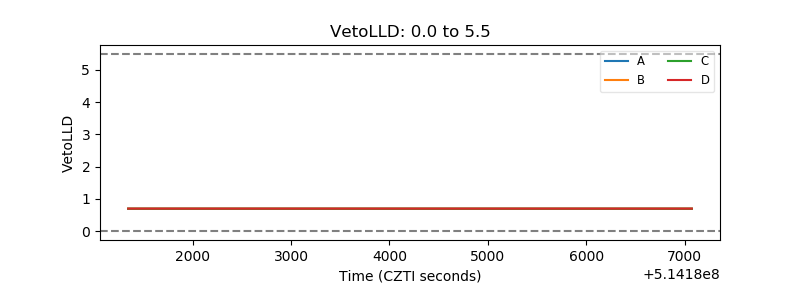 |
| Alpha Counter | 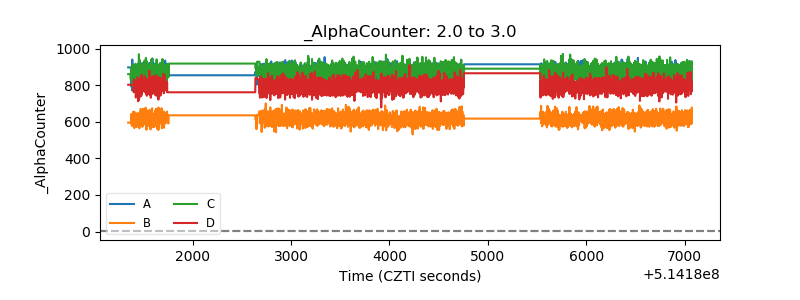 |
| _CPM_Rate | 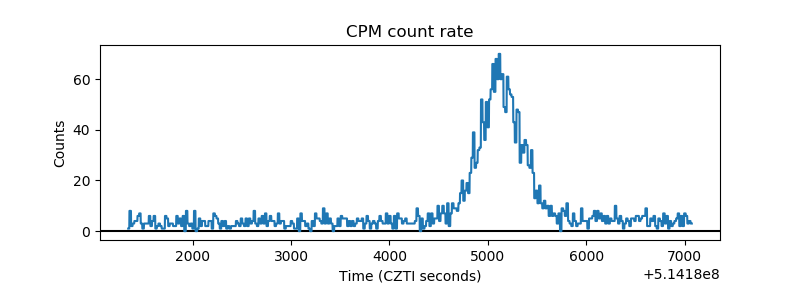 |
| CZT Counter | 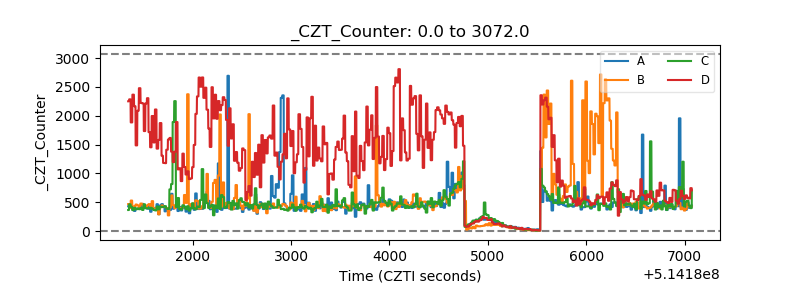 |
| +2.5 Volts monitor |  |
| +5 Volts monitor |  |
| _ROLL_ROT | 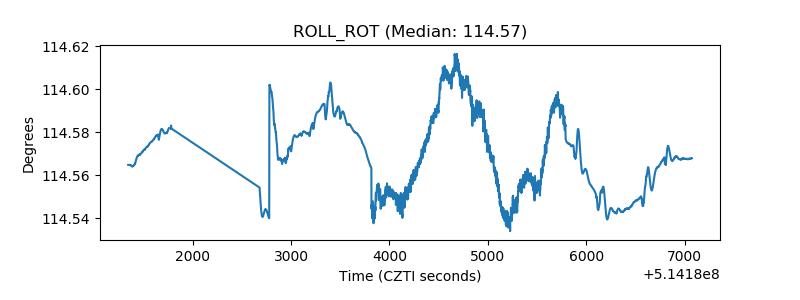 |
| _Roll_DEC | 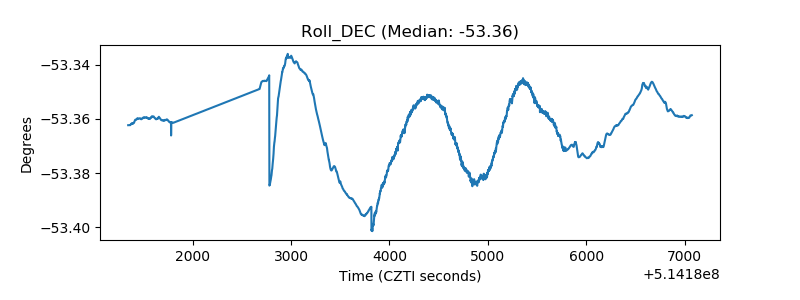 |
| _Roll_RA | 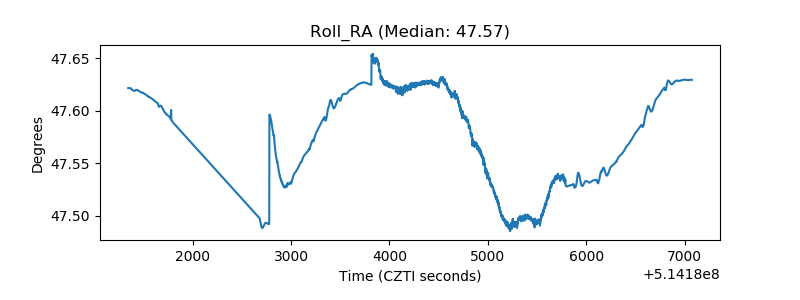 |
| Veto Counter | 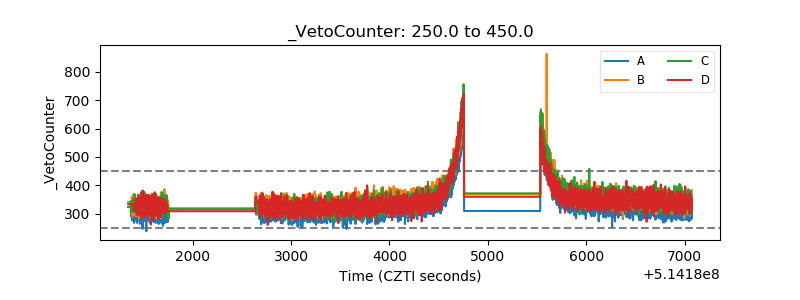 |