| Param | Original file | Final file |
|---|---|---|
| Filename | modeM0/AS1A14_083T10_9000006566_57106cztM0_level2.fits | modeM0/AS1A14_083T10_9000006566_57106cztM0_level2_quad_clean.evt |
| Size (bytes) | 504,149,760 | 108,861,120 |
| Size | 480.8 MB | 103.8 MB |
| Events in quadrant A | 3,872,379 | 706,668 |
| Events in quadrant B | 5,085,113 | 721,406 |
| Events in quadrant C | 3,827,437 | 699,144 |
| Events in quadrant D | 5,282,045 | 636,867 |
| Mode M9 | |||
|---|---|---|---|
| Quadrant | BADHDUFLAG | Total packets | Discarded packets |
| A | 0 | 1 | 0 |
| B | 0 | 1 | 0 |
| C | 0 | 1 | 0 |
| D | 0 | 1 | 0 |
| Mode M0 | |||
|---|---|---|---|
| Quadrant | BADHDUFLAG | Total packets | Discarded packets |
| A | 0 | 17035 | 2 |
| B | 0 | 20526 | 2 |
| C | 0 | 16804 | 2 |
| D | 0 | 20773 | 2 |
| Mode SS | |||
|---|---|---|---|
| Quadrant | BADHDUFLAG | Total packets | Discarded packets |
| A | 0 | 154 | 0 |
| B | 0 | 154 | 0 |
| C | 0 | 154 | 0 |
| D | 0 | 154 | 0 |
| Quadrant | Total seconds | Saturated seconds | Saturation percentage |
|---|---|---|---|
| A | 7650 | 352 | 4.601307% |
| B | 7651 | 771 | 10.077114% |
| C | 7651 | 197 | 2.574827% |
| D | 7651 | 408 | 5.332636% |
Noise dominated data is calculated using 1-second bins in cleaned event files. If a bin has >2000 counts, and if more than 50% of those come from <1% of pixels, then it is considered to be noise-dominated and hence unusable.
| Quadrant | # 1 sec bins | Bins with >0 counts | Bins with >2000 counts | High rate bins dominated by noise | Noise dominated (total time) | Noise dominated (detector-on time) | Marked lightcurve |
|---|---|---|---|---|---|---|---|
| A | 7770 | 7652 | 112 | 112 | 1.44% | 1.46% | 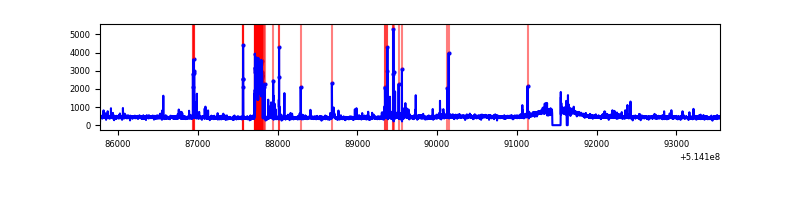 |
| B | 7771 | 7652 | 352 | 352 | 4.53% | 4.60% | 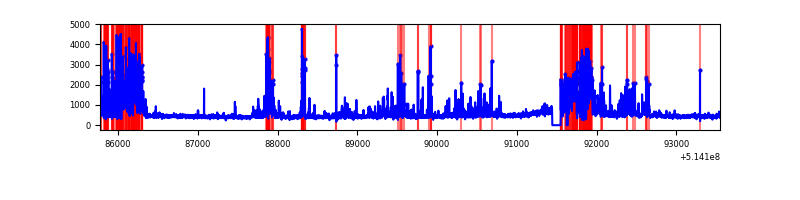 |
| C | 7771 | 7653 | 26 | 26 | 0.33% | 0.34% | 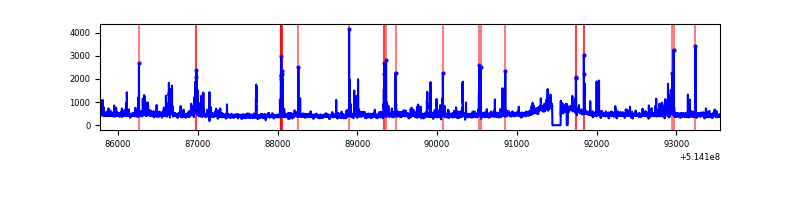 |
| D | 7771 | 7653 | 192 | 192 | 2.47% | 2.51% | 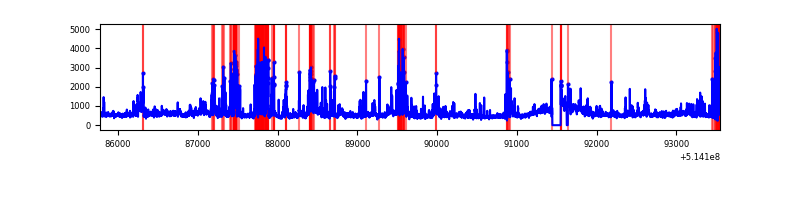 |
Top three noisy pixels from each quadrant. If the there are fewer than three noisy pixels in the level2.evt file, extra rows are filled as -1
| Pixel properties | Quadrant properties | ||||||
|---|---|---|---|---|---|---|---|
| Quadrant | DetID | PixID | Counts | Sigma | Mean | Median | Sigma |
| A | 8 | 9 | 261295 | 1246.71 | 849 | 825 | 208.9 |
| A | 10 | 251 | 88992 | 422.0 | 849 | 825 | 208.9 |
| A | 3 | 14 | 64791 | 306.16 | 849 | 825 | 208.9 |
| B | 10 | 16 | 1310650 | 7716.89 | 796 | 767 | 169.7 |
| B | 4 | 171 | 253160 | 1486.92 | 796 | 767 | 169.7 |
| B | 8 | 128 | 136641 | 800.47 | 796 | 767 | 169.7 |
| C | 12 | 252 | 130860 | 572.32 | 836 | 826 | 227.2 |
| C | 14 | 254 | 104996 | 458.49 | 836 | 826 | 227.2 |
| C | 6 | 223 | 76380 | 332.54 | 836 | 826 | 227.2 |
| D | 15 | 142 | 746296 | 3241.11 | 822 | 784 | 230.0 |
| D | 12 | 33 | 567711 | 2464.72 | 822 | 784 | 230.0 |
| D | 2 | 249 | 204738 | 886.69 | 822 | 784 | 230.0 |
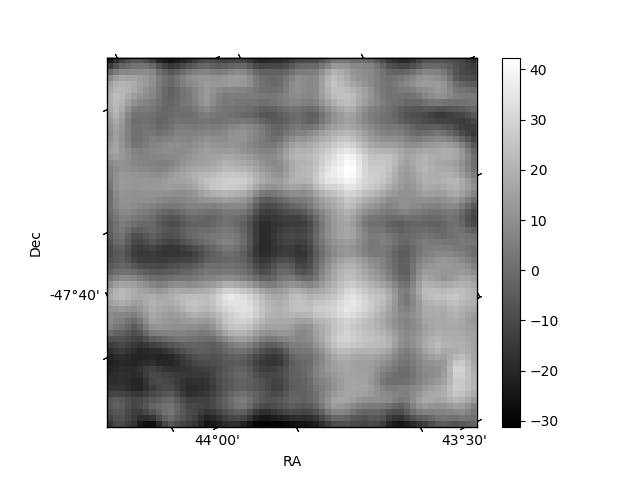
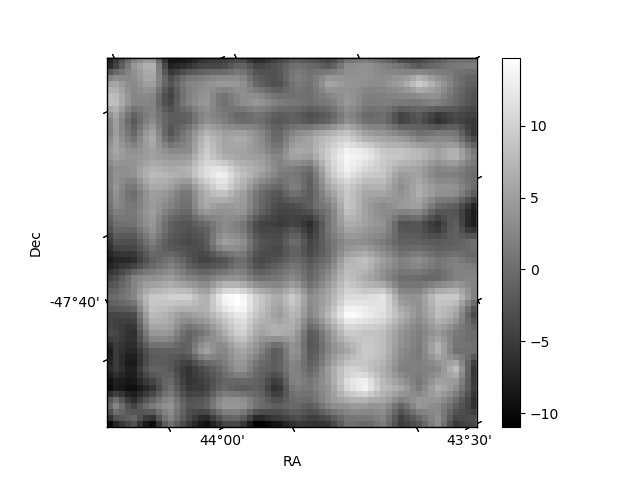
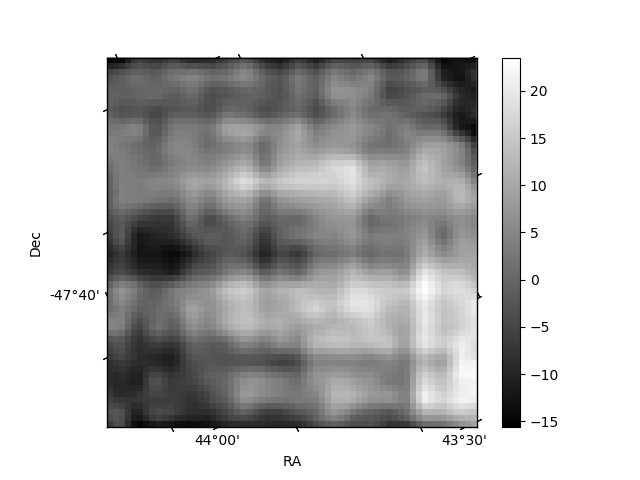
Histogram calculated using DETX and DETY for each event in the final _common_clean file
| Quadrant A | 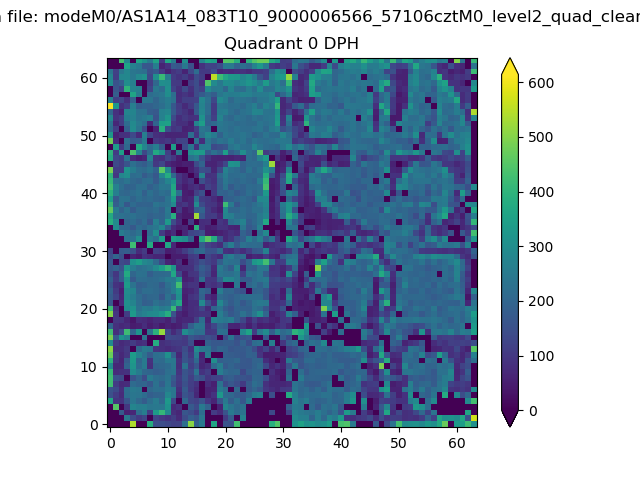 |
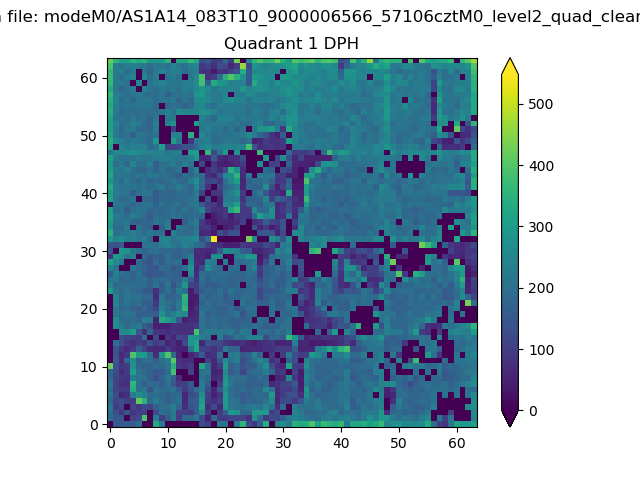 |
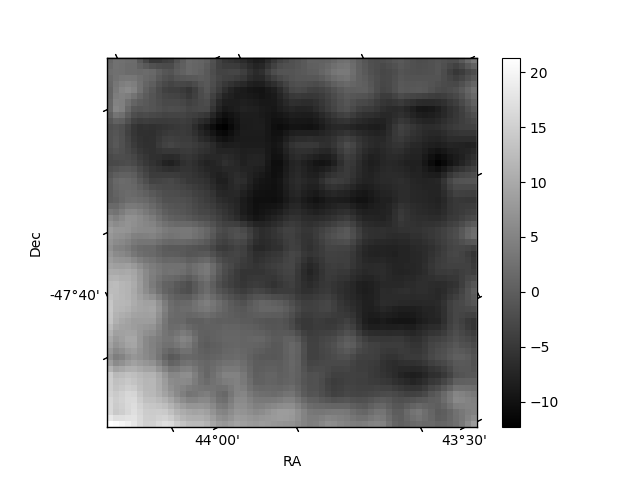
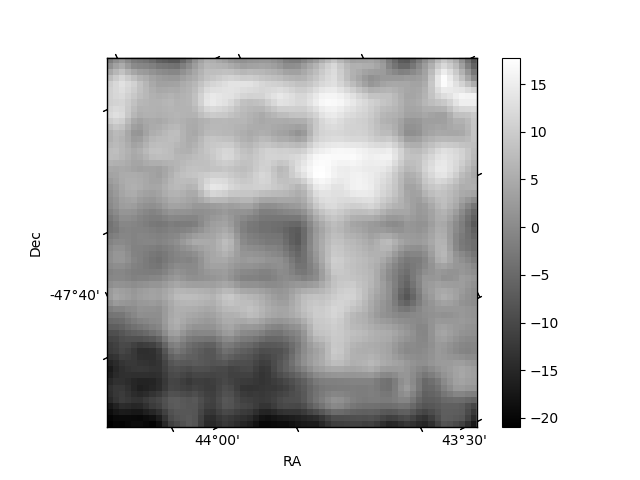
Quadrant B |
|---|---|---|---|
| Quadrant D | 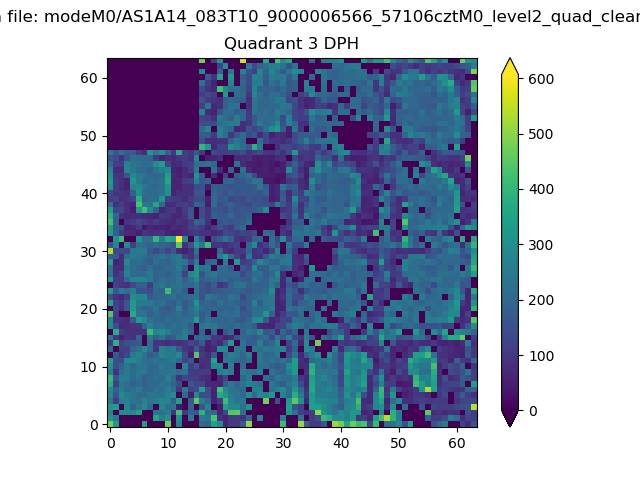 |
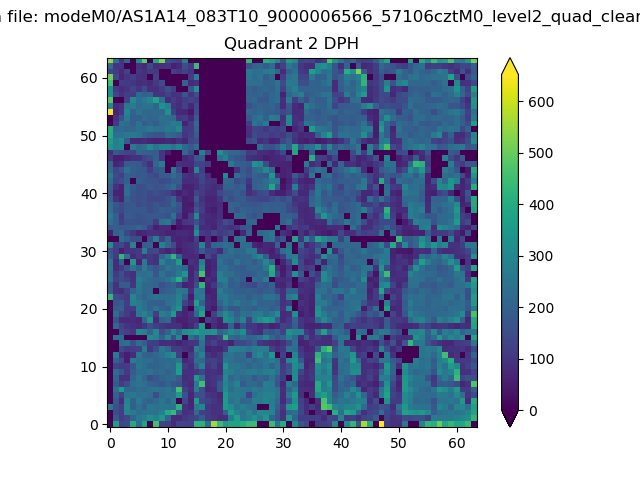 |
Quadrant C |
| Plot type | Count rate plots | Images |
|---|---|---|
| Comparison with Poisson distribution Blue bars denote a histogram of data divided into 1 sec bins. Red curve is a Poisson curve with rate = median count rate of data. |
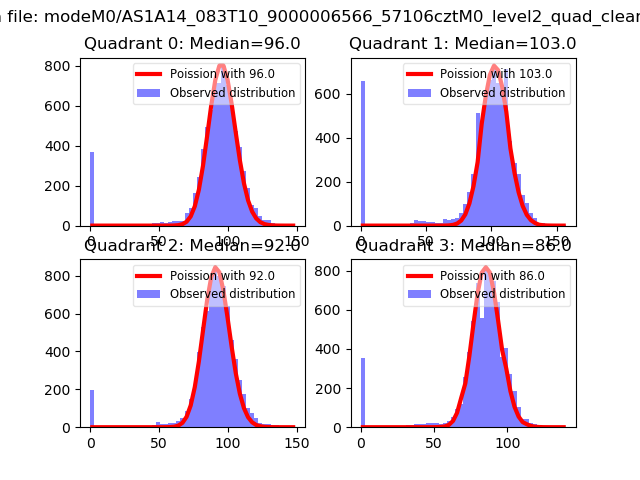 |
 |
| Quadrant-wise count rates Data is divided into 100 sec bins |
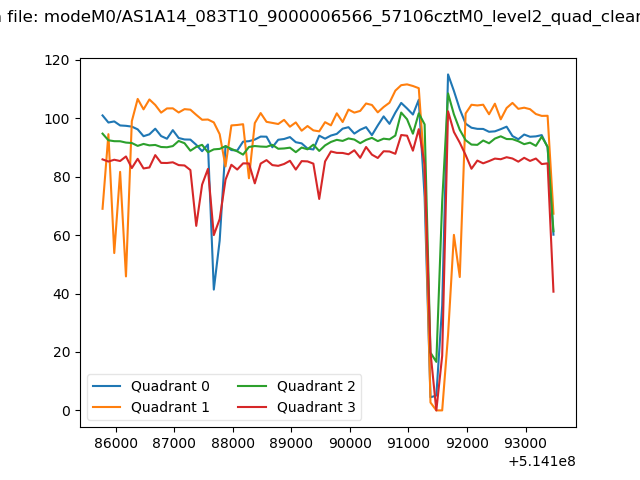 |
|
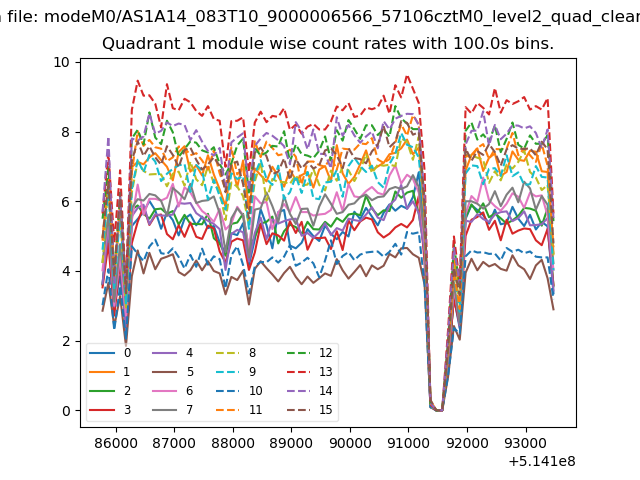
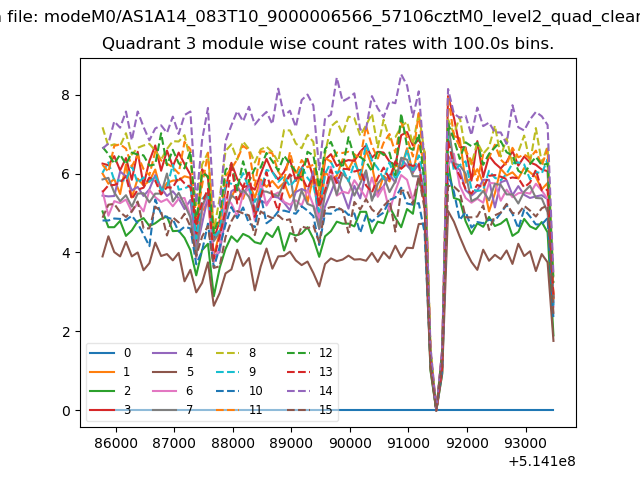
| Module-wise count rates for Quadrant A Data is divided into 100 sec bins |
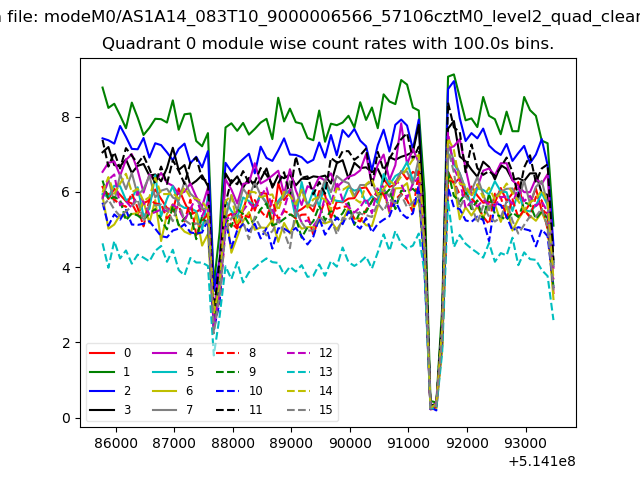 |
 |
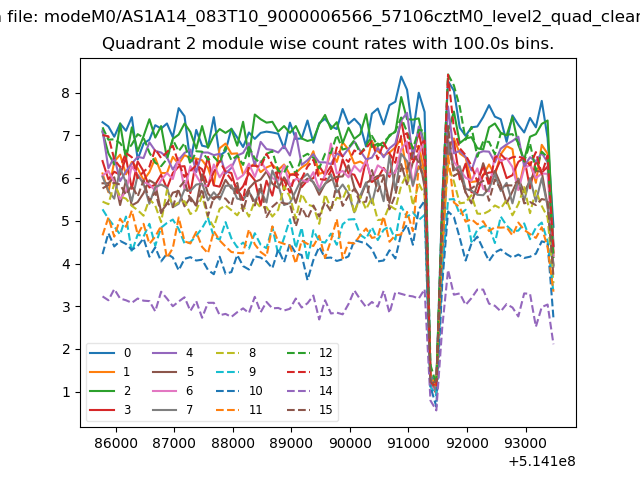
| Module-wise count rates for Quadrant B Data is divided into 100 sec bins |
 |
 |
| Module-wise count rates for Quadrant C Data is divided into 100 sec bins |
 |
 |
| Module-wise count rates for Quadrant D Data is divided into 100 sec bins |
 |
 |
| Parameter | Plot |
|---|---|
| CZT HV Monitor | 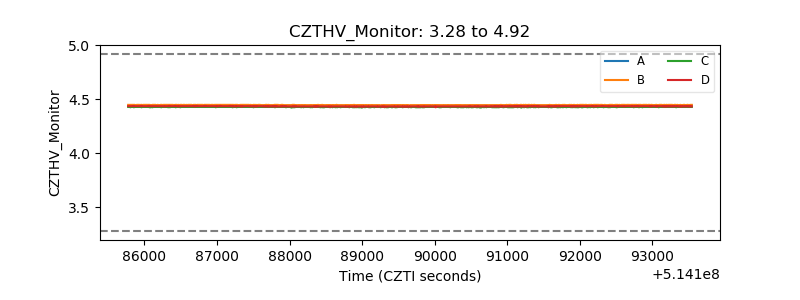 |
| D_VDD | 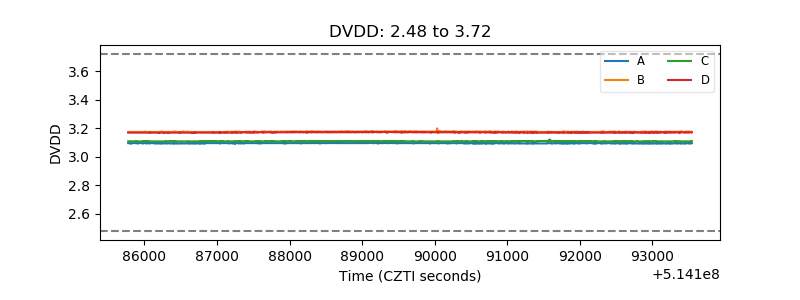 |
| Temperature 1 | 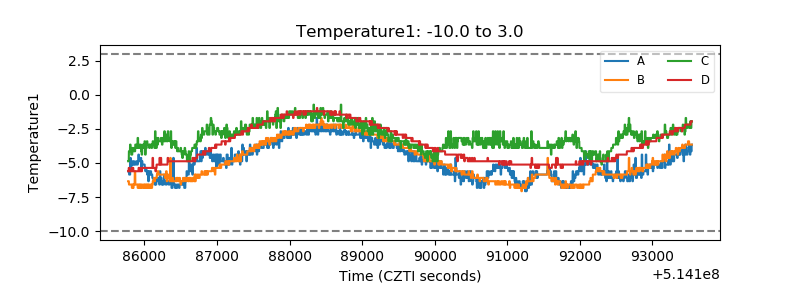 |
| Veto HV Monitor | 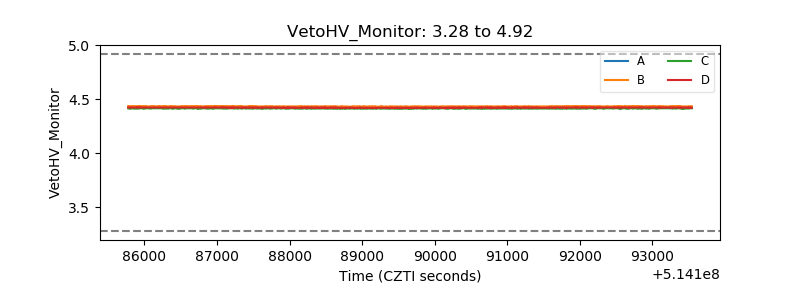 |
| Veto LLD | 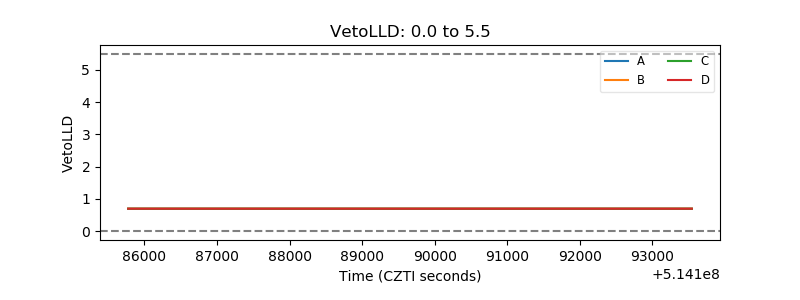 |
| Alpha Counter | 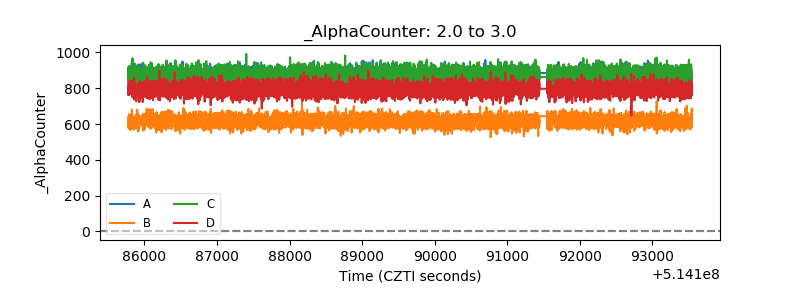 |
| _CPM_Rate | 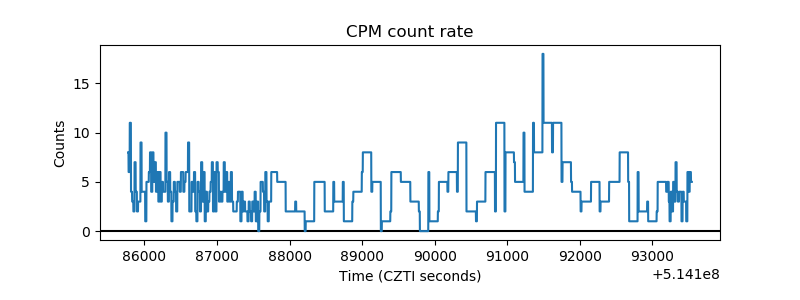 |
| CZT Counter | 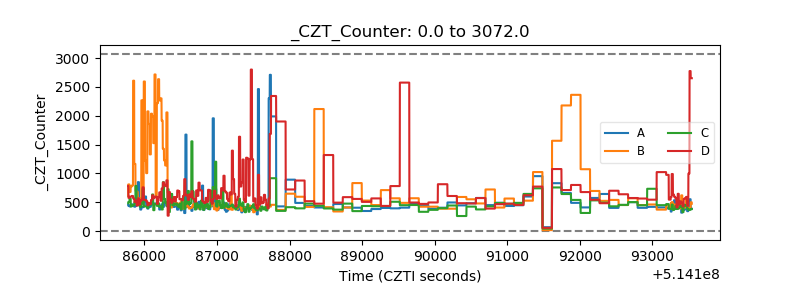 |
| +2.5 Volts monitor |  |
| +5 Volts monitor | 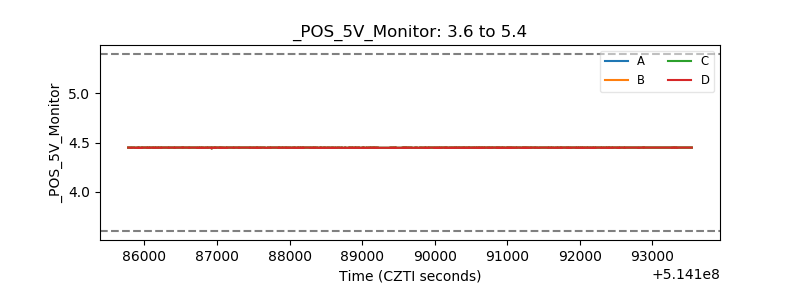 |
| _ROLL_ROT | 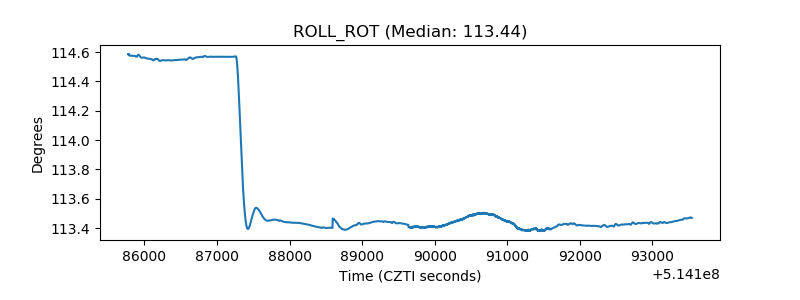 |
| _Roll_DEC | 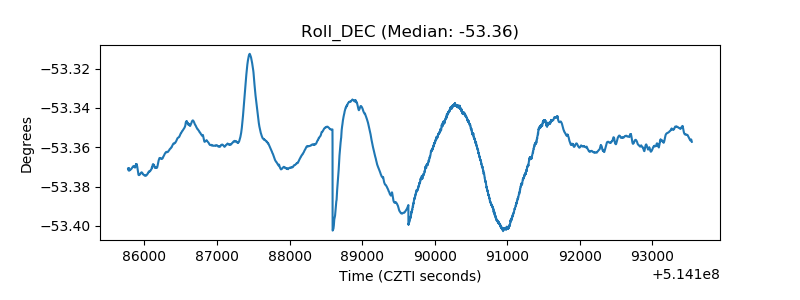 |
| _Roll_RA | 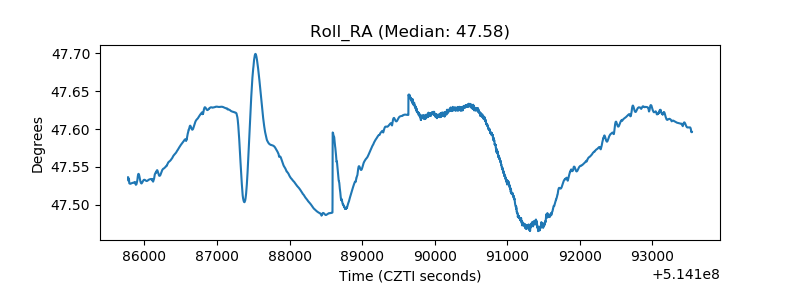 |
| Veto Counter | 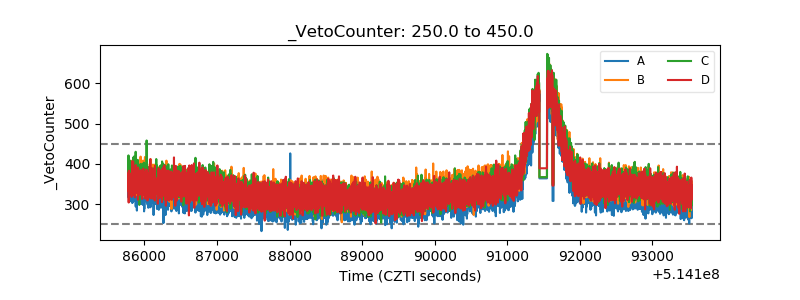 |