| Param | Original file | Final file |
|---|---|---|
| Filename | modeM0/AS1A14_083T10_9000006566_57107cztM0_level2.fits | modeM0/AS1A14_083T10_9000006566_57107cztM0_level2_quad_clean.evt |
| Size (bytes) | 488,773,440 | 103,858,560 |
| Size | 466.1 MB | 99.0 MB |
| Events in quadrant A | 3,190,067 | 684,485 |
| Events in quadrant B | 3,824,644 | 735,562 |
| Events in quadrant C | 3,587,540 | 657,301 |
| Events in quadrant D | 6,933,654 | 568,227 |
| Mode M0 | |||
|---|---|---|---|
| Quadrant | BADHDUFLAG | Total packets | Discarded packets |
| A | 0 | 14796 | 0 |
| B | 0 | 16289 | 0 |
| C | 0 | 15772 | 0 |
| D | 0 | 25494 | 0 |
| Mode SS | |||
|---|---|---|---|
| Quadrant | BADHDUFLAG | Total packets | Discarded packets |
| A | 0 | 144 | 0 |
| B | 0 | 144 | 0 |
| C | 0 | 144 | 0 |
| D | 0 | 144 | 0 |
| Quadrant | Total seconds | Saturated seconds | Saturation percentage |
|---|---|---|---|
| A | 7167 | 29 | 0.404632% |
| B | 7168 | 98 | 1.367188% |
| C | 7168 | 80 | 1.116071% |
| D | 7168 | 747 | 10.421317% |
Noise dominated data is calculated using 1-second bins in cleaned event files. If a bin has >2000 counts, and if more than 50% of those come from <1% of pixels, then it is considered to be noise-dominated and hence unusable.
| Quadrant | # 1 sec bins | Bins with >0 counts | Bins with >2000 counts | High rate bins dominated by noise | Noise dominated (total time) | Noise dominated (detector-on time) | Marked lightcurve |
|---|---|---|---|---|---|---|---|
| A | 7167 | 7167 | 15 | 15 | 0.21% | 0.21% | 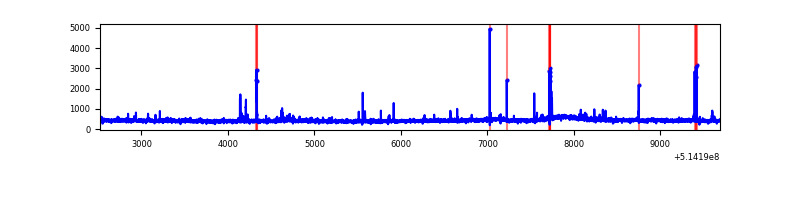 |
| B | 7168 | 7168 | 60 | 60 | 0.84% | 0.84% | 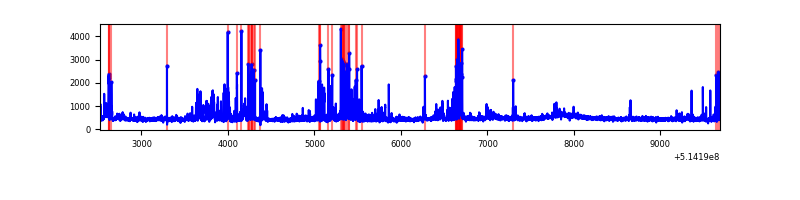 |
| C | 7168 | 7168 | 61 | 61 | 0.85% | 0.85% | 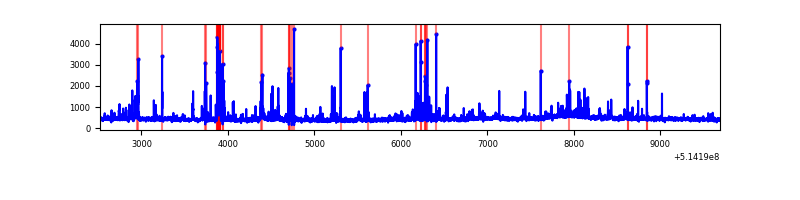 |
| D | 7168 | 7168 | 658 | 658 | 9.18% | 9.18% | 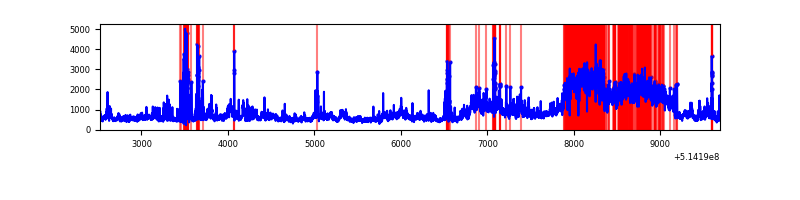 |
Top three noisy pixels from each quadrant. If the there are fewer than three noisy pixels in the level2.evt file, extra rows are filled as -1
| Pixel properties | Quadrant properties | ||||||
|---|---|---|---|---|---|---|---|
| Quadrant | DetID | PixID | Counts | Sigma | Mean | Median | Sigma |
| A | 10 | 251 | 94513 | 483.91 | 781 | 761 | 193.7 |
| A | 13 | 248 | 29777 | 149.77 | 781 | 761 | 193.7 |
| A | 3 | 14 | 27950 | 140.34 | 781 | 761 | 193.7 |
| B | 8 | 128 | 360246 | 2155.17 | 769 | 740 | 166.8 |
| B | 10 | 16 | 197856 | 1181.67 | 769 | 740 | 166.8 |
| B | 4 | 171 | 80556 | 478.48 | 769 | 740 | 166.8 |
| C | 14 | 245 | 210535 | 1017.3 | 759 | 751 | 206.2 |
| C | 12 | 252 | 194962 | 941.78 | 759 | 751 | 206.2 |
| C | 14 | 254 | 50510 | 241.29 | 759 | 751 | 206.2 |
| D | 15 | 142 | 3416521 | 16868.42 | 725 | 694 | 202.5 |
| D | 12 | 251 | 149065 | 732.7 | 725 | 694 | 202.5 |
| D | 12 | 33 | 140975 | 692.75 | 725 | 694 | 202.5 |
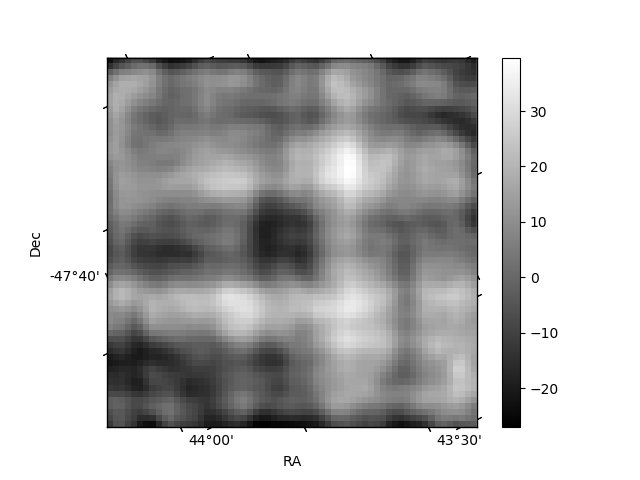
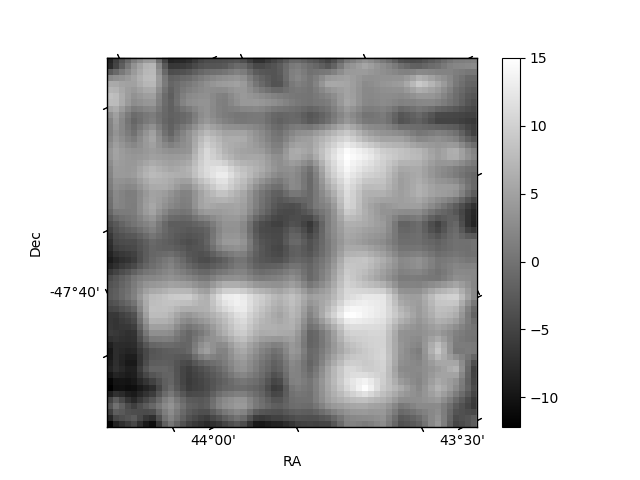
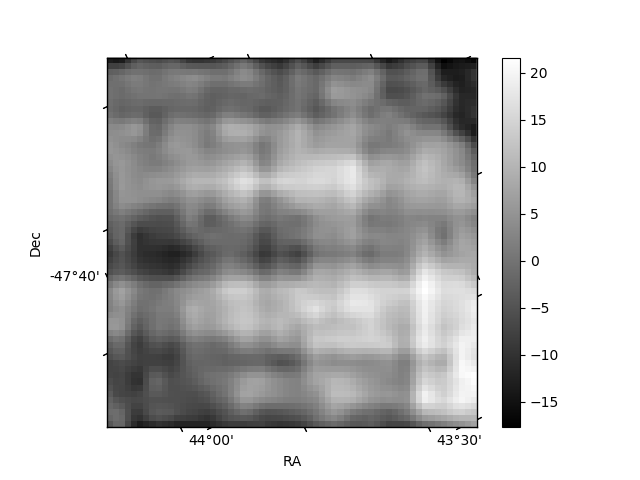
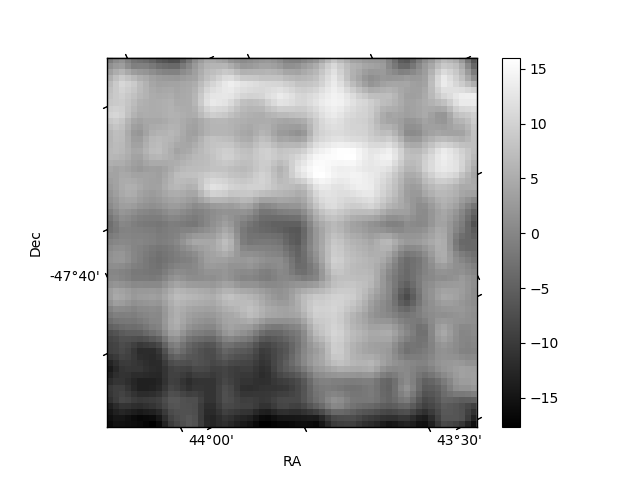
Histogram calculated using DETX and DETY for each event in the final _common_clean file
| Quadrant A | 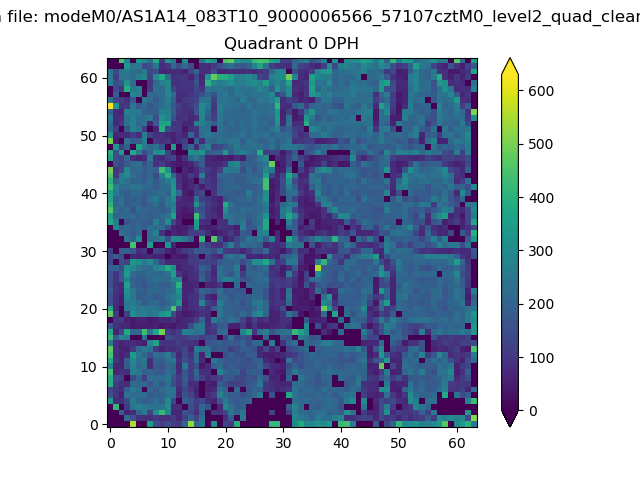 |
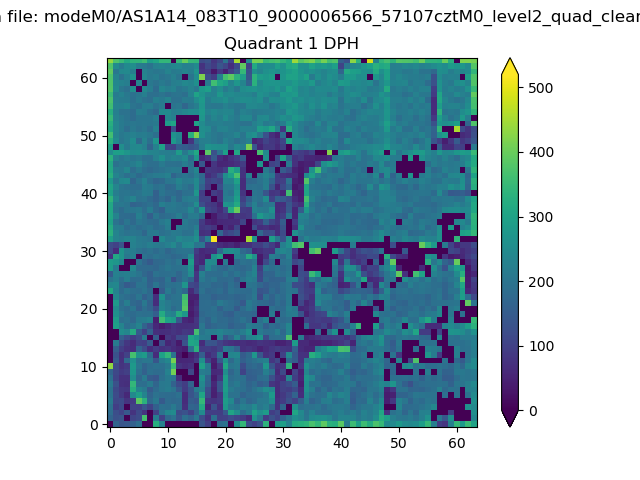 |
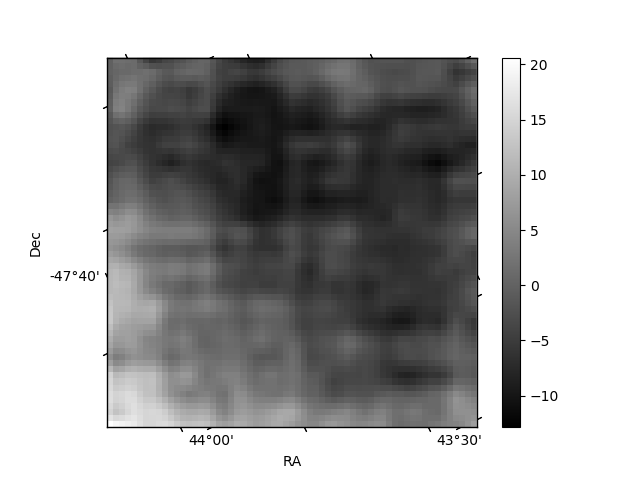
Quadrant B |
|---|---|---|---|
| Quadrant D | 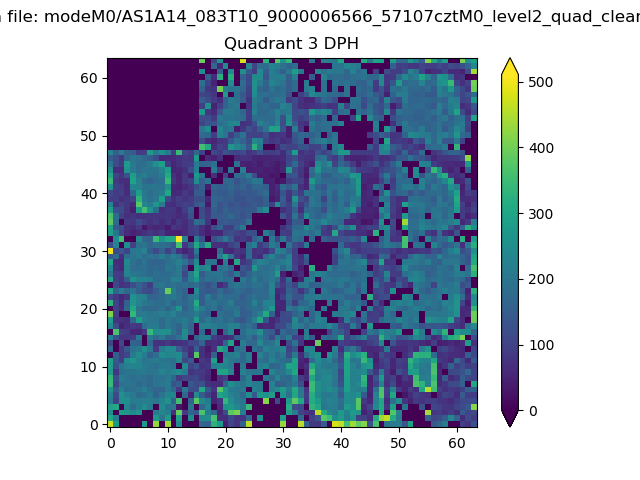 |
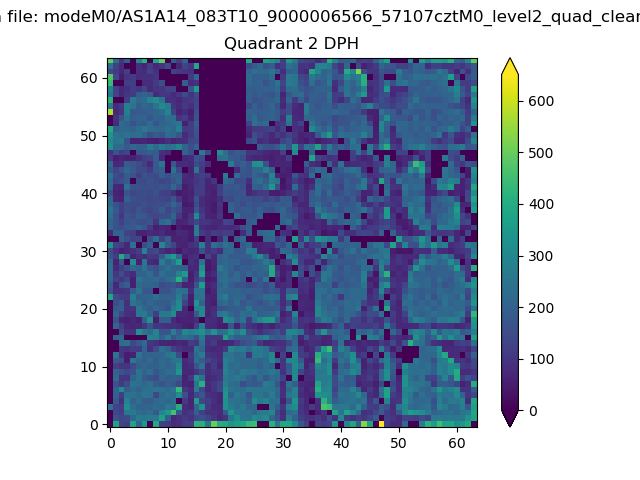 |
Quadrant C |
| Plot type | Count rate plots | Images |
|---|---|---|
| Comparison with Poisson distribution Blue bars denote a histogram of data divided into 1 sec bins. Red curve is a Poisson curve with rate = median count rate of data. |
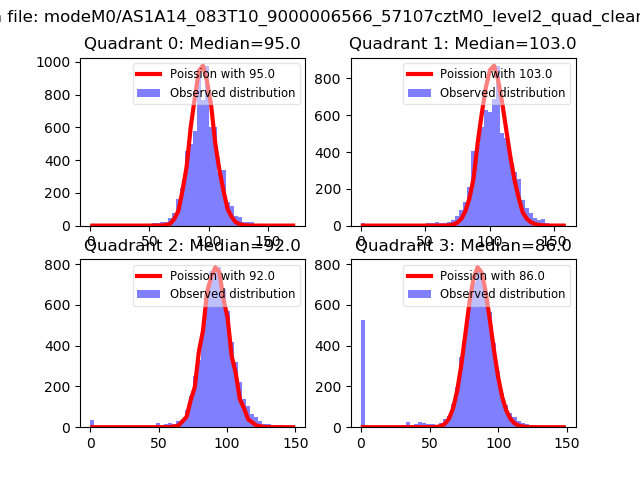 |
 |
| Quadrant-wise count rates Data is divided into 100 sec bins |
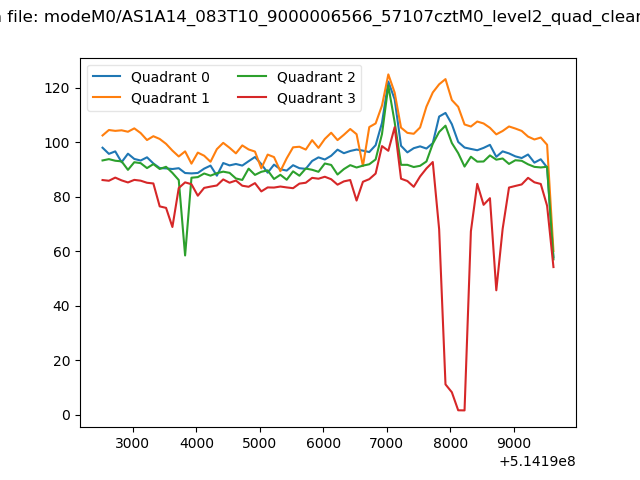 |
|
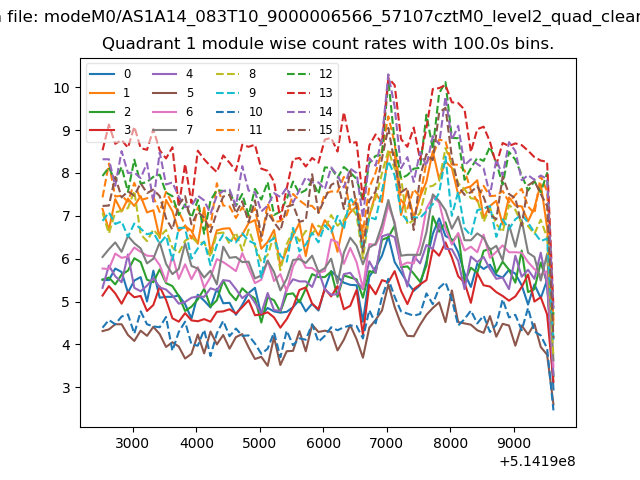
| Module-wise count rates for Quadrant A Data is divided into 100 sec bins |
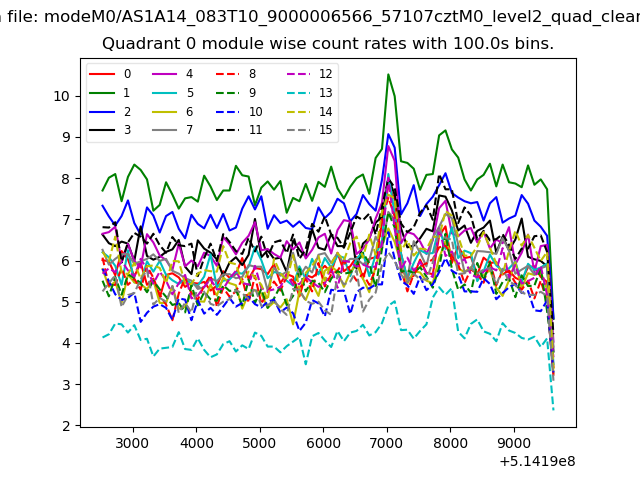 |
 |
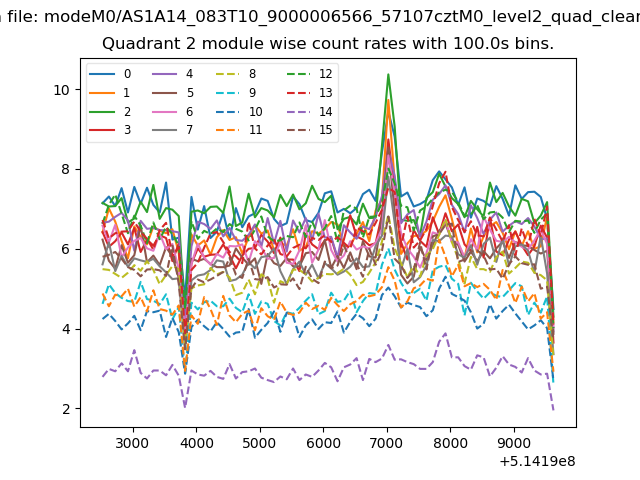
| Module-wise count rates for Quadrant B Data is divided into 100 sec bins |
 |
 |
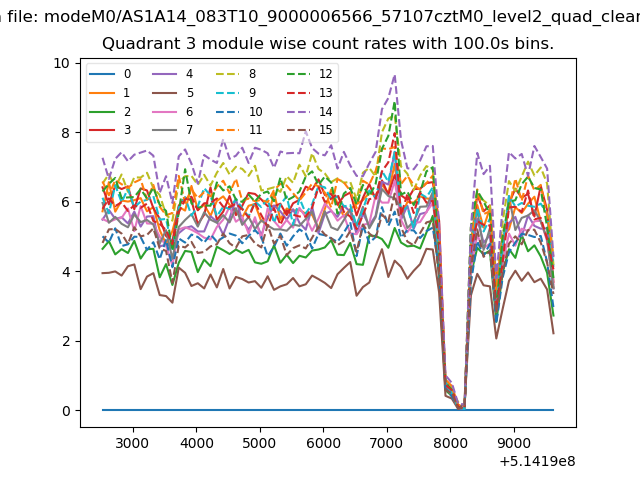
| Module-wise count rates for Quadrant C Data is divided into 100 sec bins |
 |
 |
| Module-wise count rates for Quadrant D Data is divided into 100 sec bins |
 |
 |
| Parameter | Plot |
|---|---|
| CZT HV Monitor | 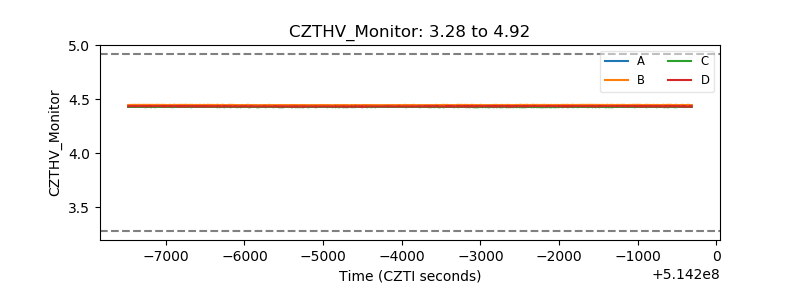 |
| D_VDD | 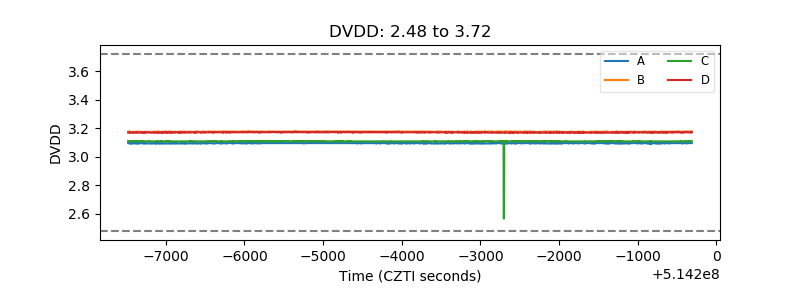 |
| Temperature 1 | 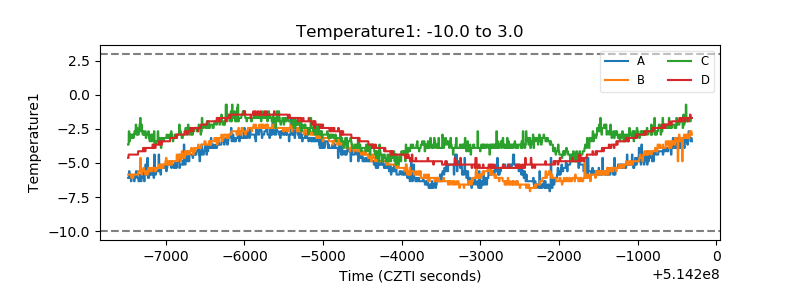 |
| Veto HV Monitor | 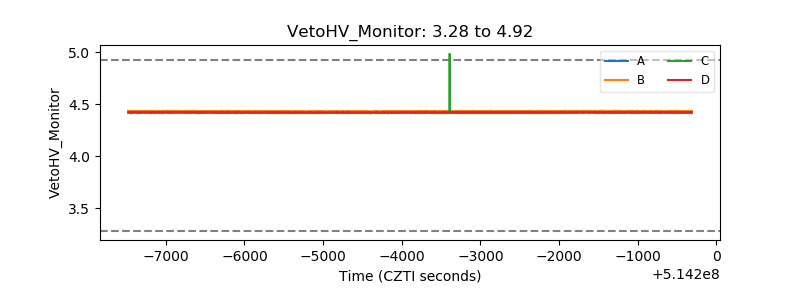 |
| Veto LLD | 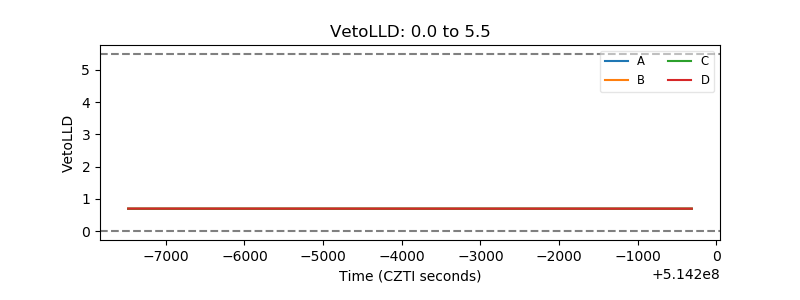 |
| Alpha Counter | 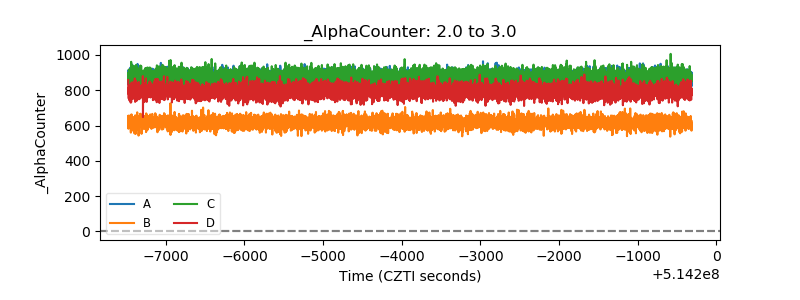 |
| _CPM_Rate | 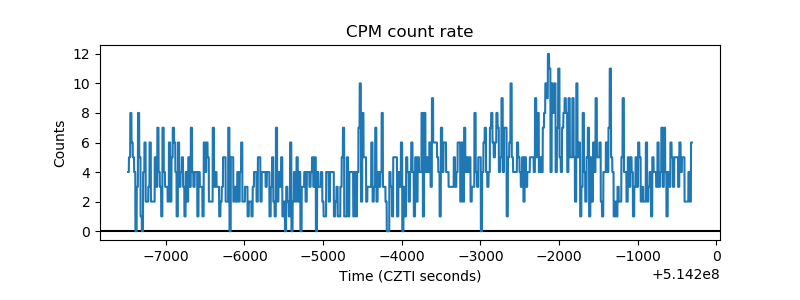 |
| CZT Counter | 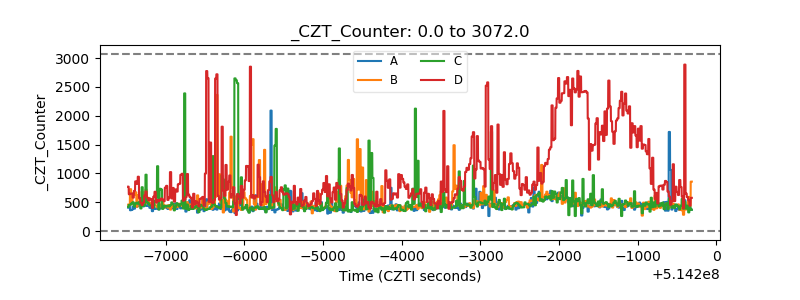 |
| +2.5 Volts monitor | 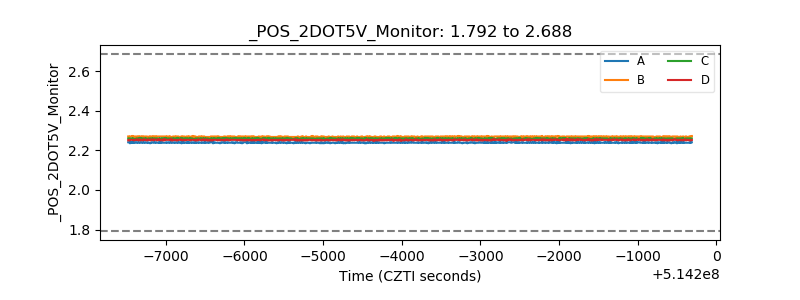 |
| +5 Volts monitor |  |
| _ROLL_ROT | 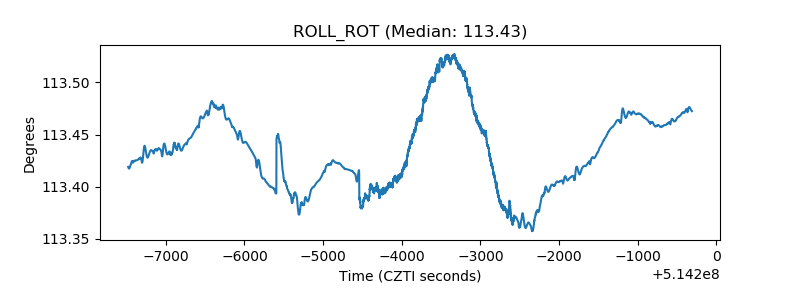 |
| _Roll_DEC | 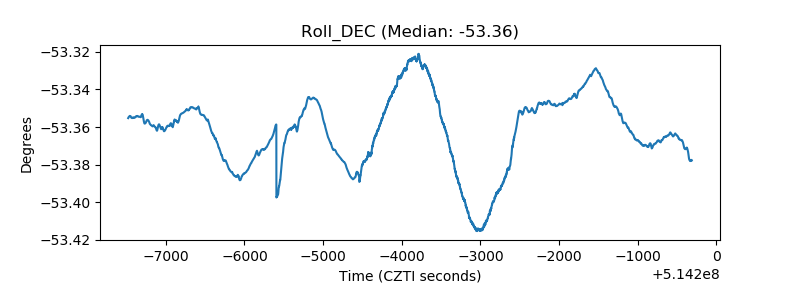 |
| _Roll_RA | 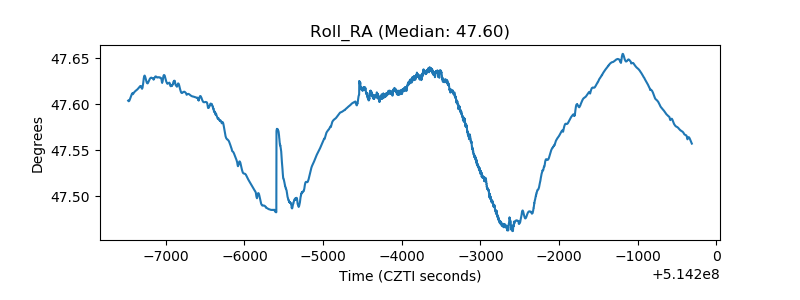 |
| Veto Counter | 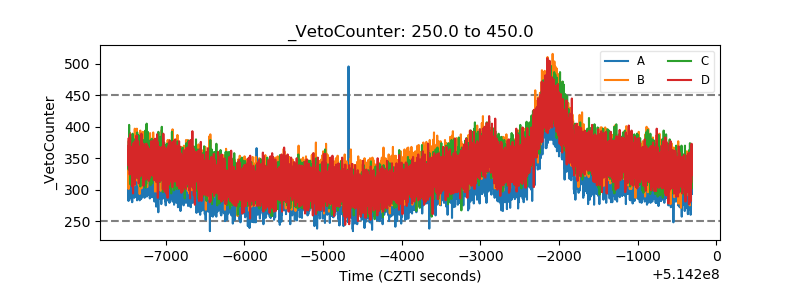 |