| Param | Original file | Final file |
|---|---|---|
| Filename | modeM0/AS1A14_083T10_9000006566_57108cztM0_level2.fits | modeM0/AS1A14_083T10_9000006566_57108cztM0_level2_quad_clean.evt |
| Size (bytes) | 639,365,760 | 100,857,600 |
| Size | 609.7 MB | 96.2 MB |
| Events in quadrant A | 3,252,592 | 718,353 |
| Events in quadrant B | 7,672,052 | 581,347 |
| Events in quadrant C | 5,363,339 | 594,663 |
| Events in quadrant D | 6,796,161 | 637,058 |
| Mode M0 | |||
|---|---|---|---|
| Quadrant | BADHDUFLAG | Total packets | Discarded packets |
| A | 0 | 15286 | 0 |
| B | 0 | 28182 | 0 |
| C | 0 | 21405 | 0 |
| D | 0 | 25347 | 0 |
| Mode SS | |||
|---|---|---|---|
| Quadrant | BADHDUFLAG | Total packets | Discarded packets |
| A | 0 | 150 | 0 |
| B | 0 | 150 | 0 |
| C | 0 | 150 | 0 |
| D | 0 | 150 | 0 |
| Quadrant | Total seconds | Saturated seconds | Saturation percentage |
|---|---|---|---|
| A | 7507 | 13 | 0.173172% |
| B | 7508 | 1912 | 25.466169% |
| C | 7508 | 1109 | 14.770911% |
| D | 7508 | 290 | 3.862547% |
Noise dominated data is calculated using 1-second bins in cleaned event files. If a bin has >2000 counts, and if more than 50% of those come from <1% of pixels, then it is considered to be noise-dominated and hence unusable.
| Quadrant | # 1 sec bins | Bins with >0 counts | Bins with >2000 counts | High rate bins dominated by noise | Noise dominated (total time) | Noise dominated (detector-on time) | Marked lightcurve |
|---|---|---|---|---|---|---|---|
| A | 7507 | 7507 | 6 | 6 | 0.08% | 0.08% | 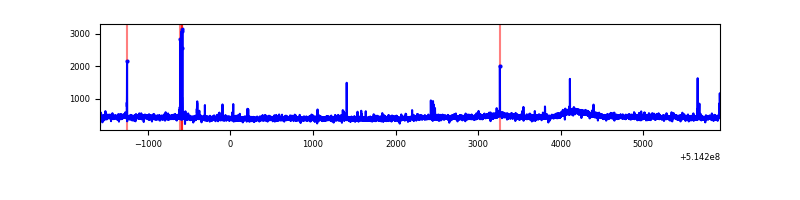 |
| B | 7508 | 7508 | 1563 | 1563 | 20.82% | 20.82% | 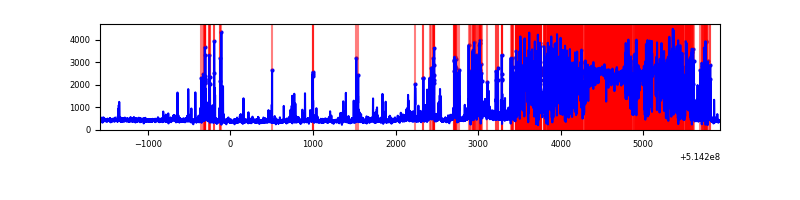 |
| C | 7508 | 7508 | 616 | 616 | 8.20% | 8.20% | 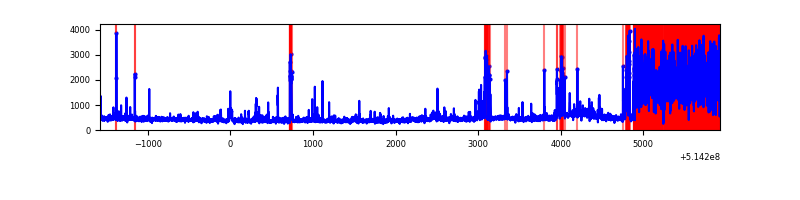 |
| D | 7508 | 7508 | 292 | 292 | 3.89% | 3.89% | 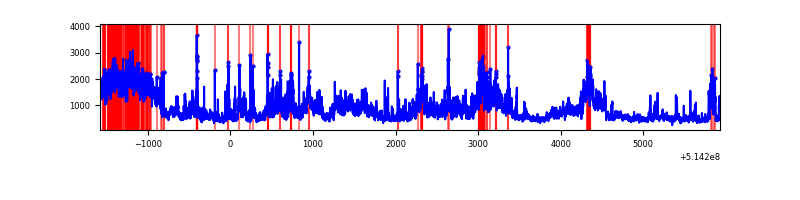 |
Top three noisy pixels from each quadrant. If the there are fewer than three noisy pixels in the level2.evt file, extra rows are filled as -1
| Pixel properties | Quadrant properties | ||||||
|---|---|---|---|---|---|---|---|
| Quadrant | DetID | PixID | Counts | Sigma | Mean | Median | Sigma |
| A | 10 | 251 | 55219 | 269.9 | 819 | 796 | 201.6 |
| A | 13 | 254 | 13344 | 62.23 | 819 | 796 | 201.6 |
| A | 3 | 137 | 10218 | 46.73 | 819 | 796 | 201.6 |
| B | 8 | 128 | 4822188 | 33706.21 | 664 | 641 | 143.0 |
| B | 10 | 16 | 94791 | 658.18 | 664 | 641 | 143.0 |
| B | 4 | 171 | 30974 | 212.05 | 664 | 641 | 143.0 |
| C | 15 | 198 | 1765795 | 8852.82 | 735 | 727 | 199.4 |
| C | 15 | 182 | 191531 | 956.99 | 735 | 727 | 199.4 |
| C | 14 | 254 | 134539 | 671.14 | 735 | 727 | 199.4 |
| D | 15 | 142 | 3218743 | 14374.22 | 791 | 754 | 223.9 |
| D | 2 | 249 | 95860 | 424.82 | 791 | 754 | 223.9 |
| D | 12 | 33 | 67878 | 299.83 | 791 | 754 | 223.9 |
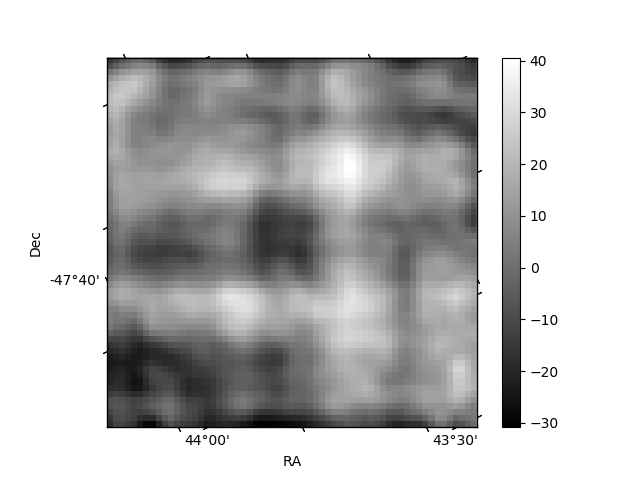
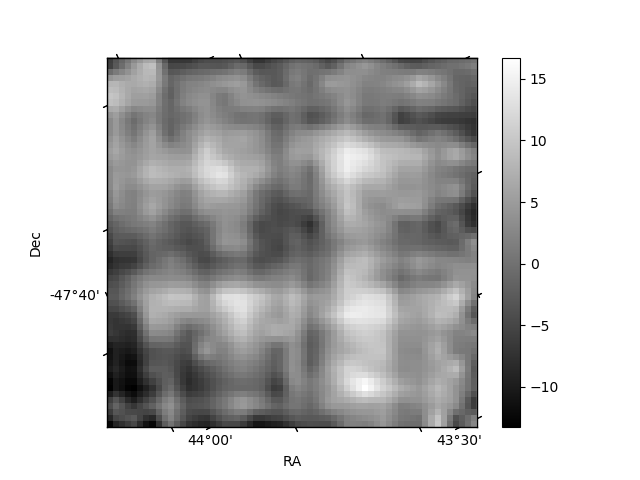
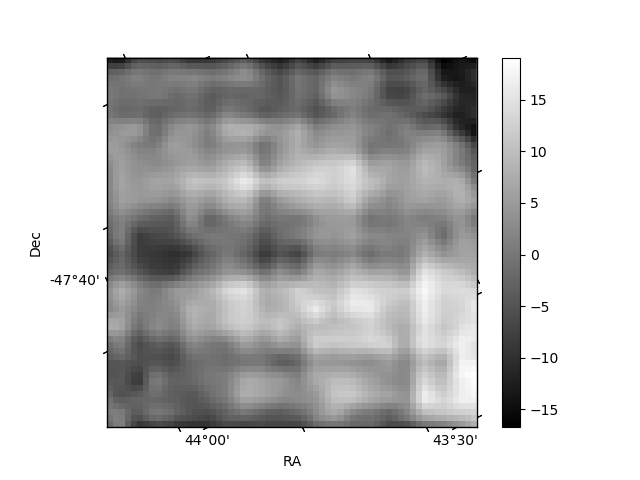
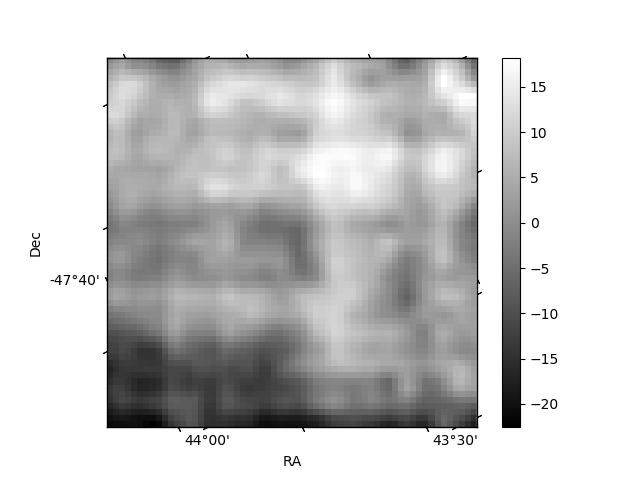
Histogram calculated using DETX and DETY for each event in the final _common_clean file
| Quadrant A | 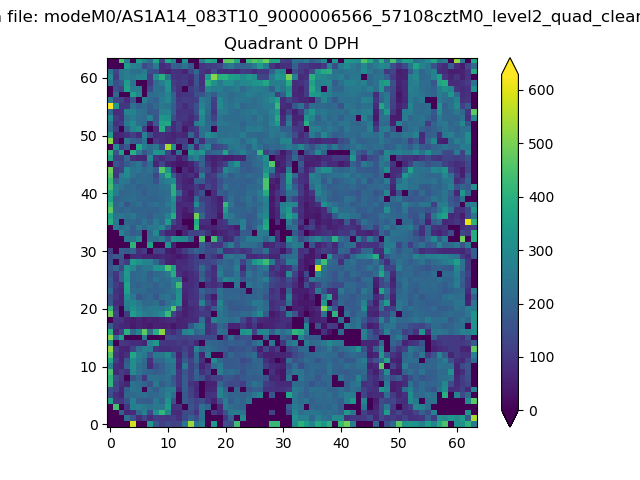 |
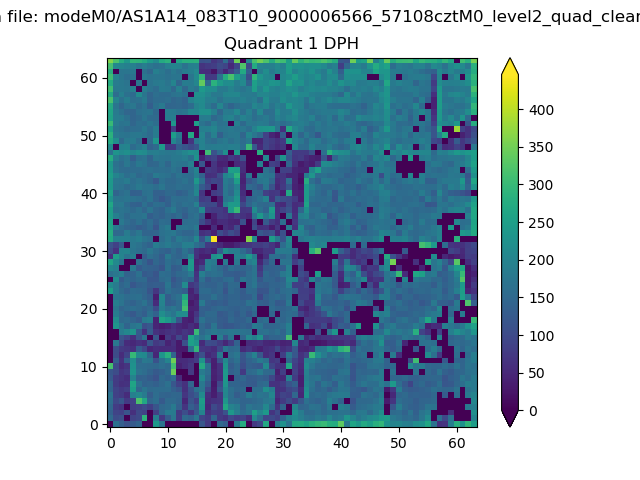 |
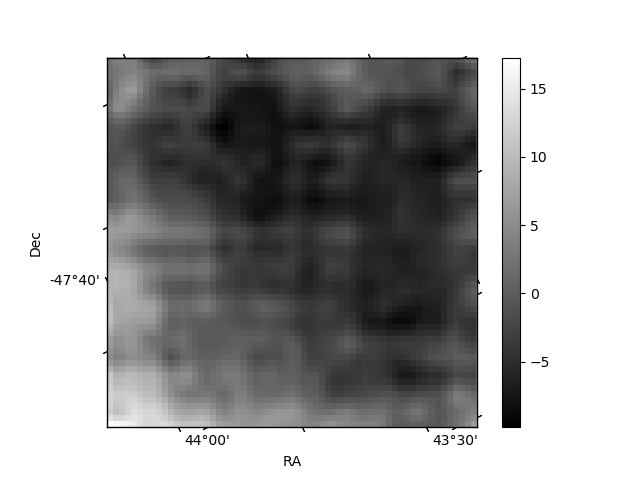
Quadrant B |
|---|---|---|---|
| Quadrant D | 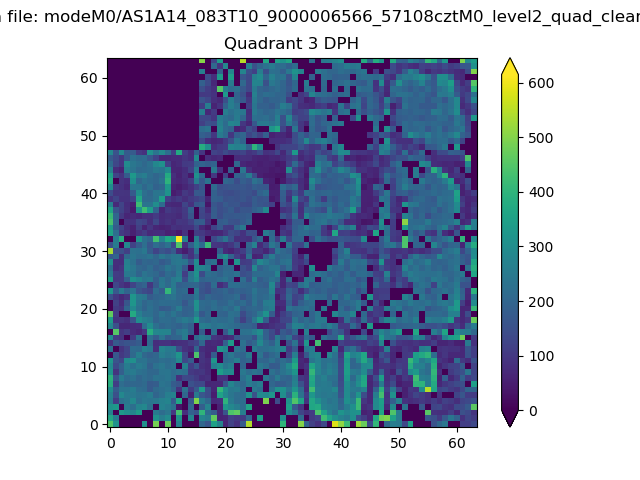 |
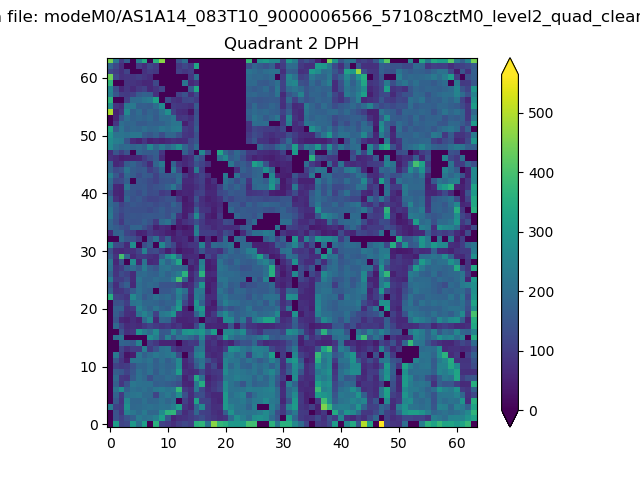 |
Quadrant C |
| Plot type | Count rate plots | Images |
|---|---|---|
| Comparison with Poisson distribution Blue bars denote a histogram of data divided into 1 sec bins. Red curve is a Poisson curve with rate = median count rate of data. |
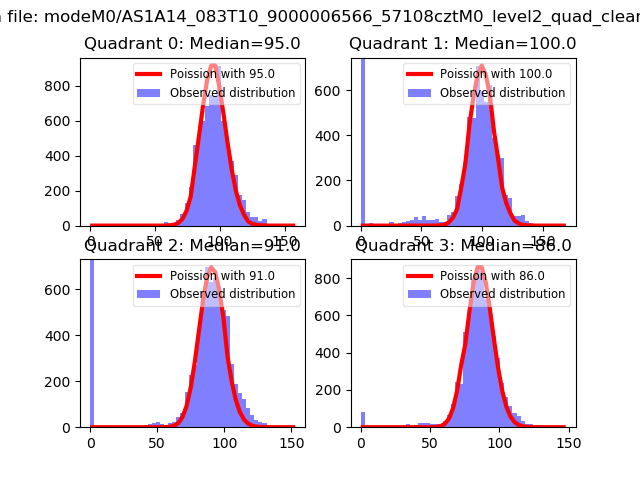 |
 |
| Quadrant-wise count rates Data is divided into 100 sec bins |
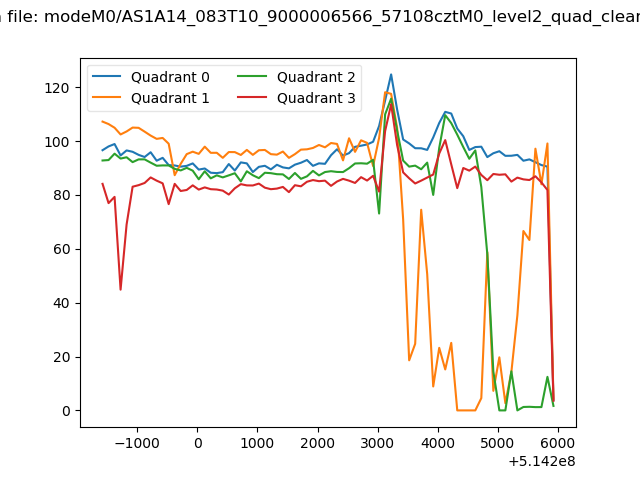 |
|
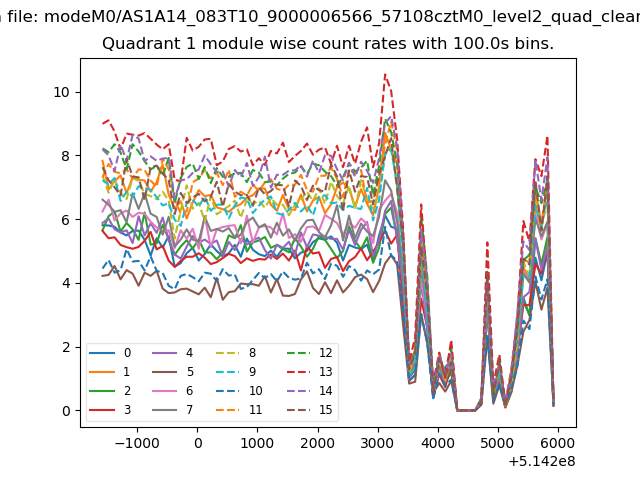
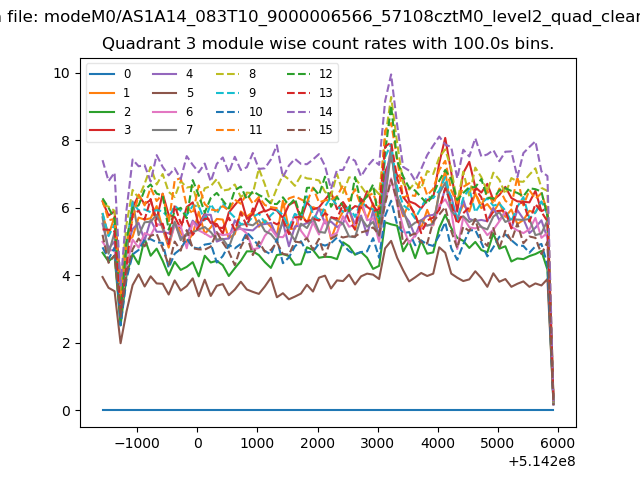
| Module-wise count rates for Quadrant A Data is divided into 100 sec bins |
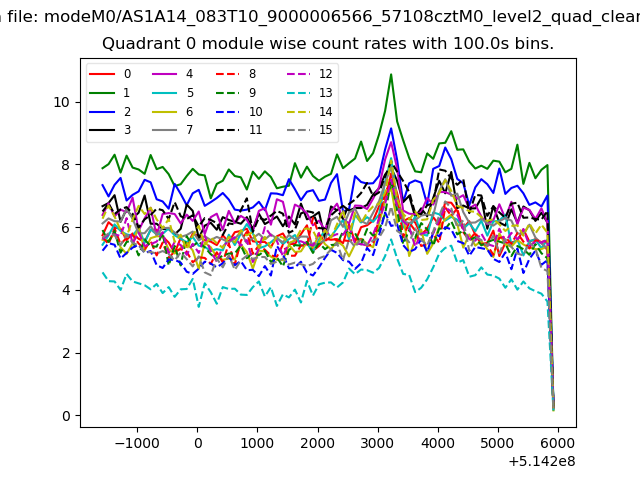 |
 |
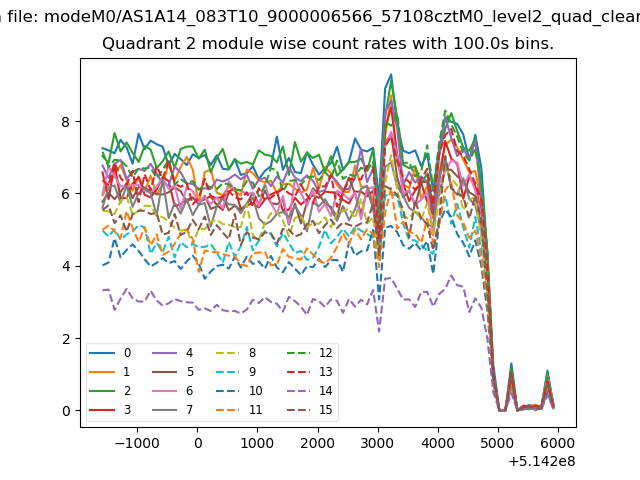
| Module-wise count rates for Quadrant B Data is divided into 100 sec bins |
 |
 |
| Module-wise count rates for Quadrant C Data is divided into 100 sec bins |
 |
 |
| Module-wise count rates for Quadrant D Data is divided into 100 sec bins |
 |
 |
| Parameter | Plot |
|---|---|
| CZT HV Monitor | 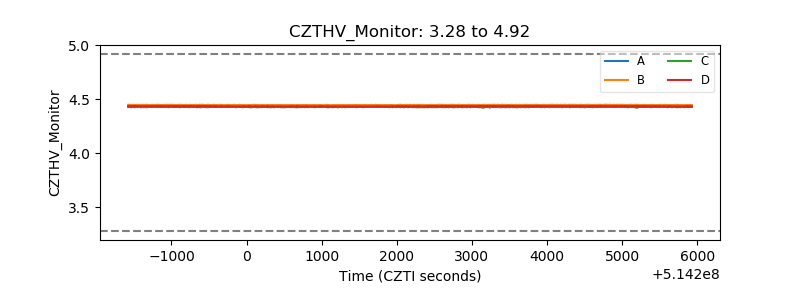 |
| D_VDD | 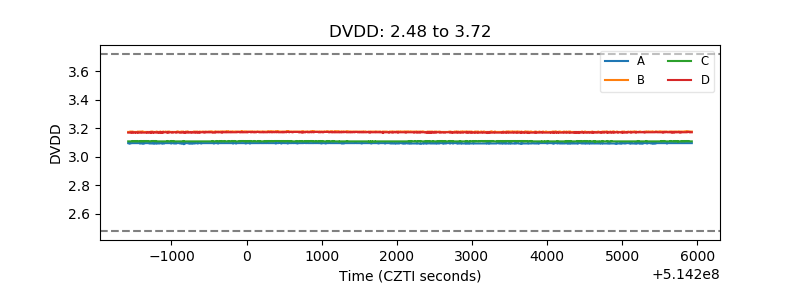 |
| Temperature 1 | 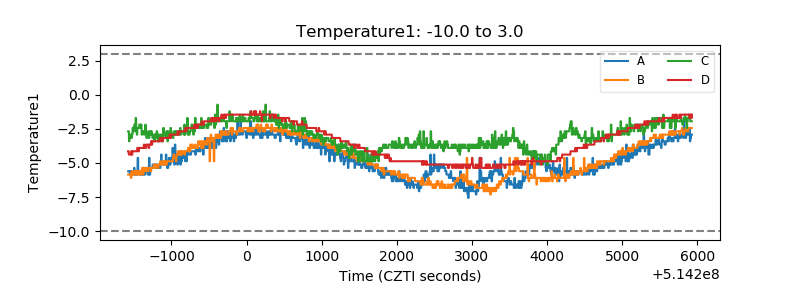 |
| Veto HV Monitor | 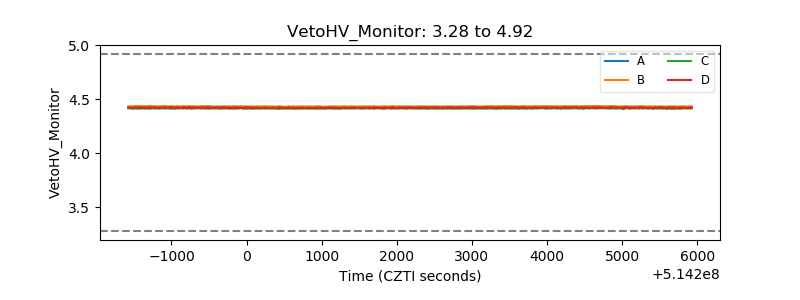 |
| Veto LLD | 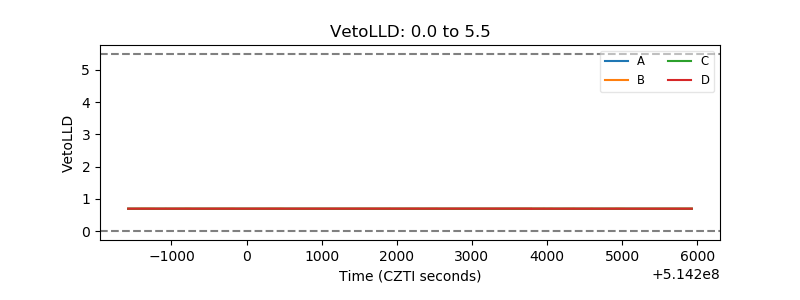 |
| Alpha Counter | 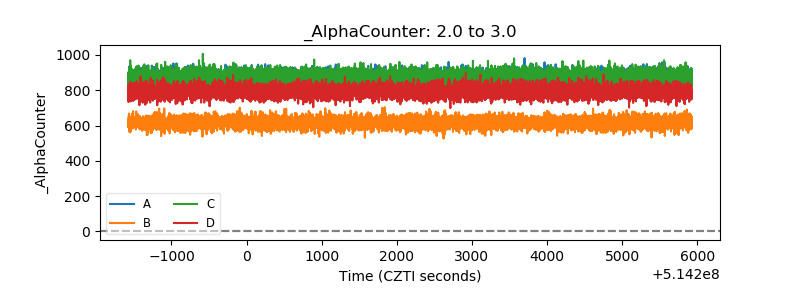 |
| _CPM_Rate | 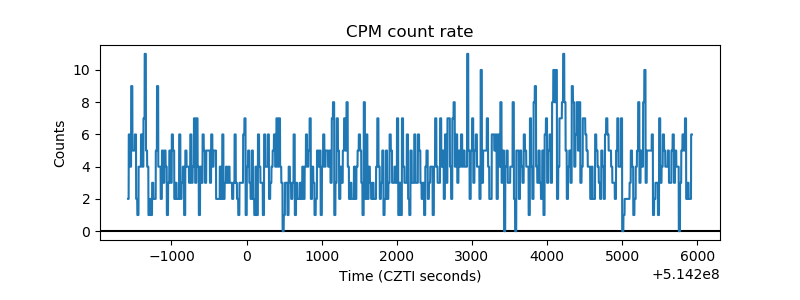 |
| CZT Counter | 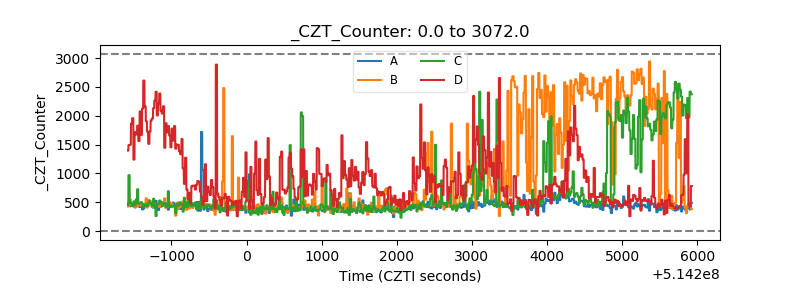 |
| +2.5 Volts monitor |  |
| +5 Volts monitor | 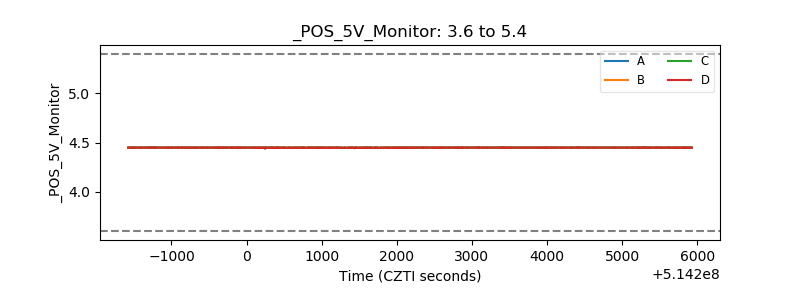 |
| _ROLL_ROT | 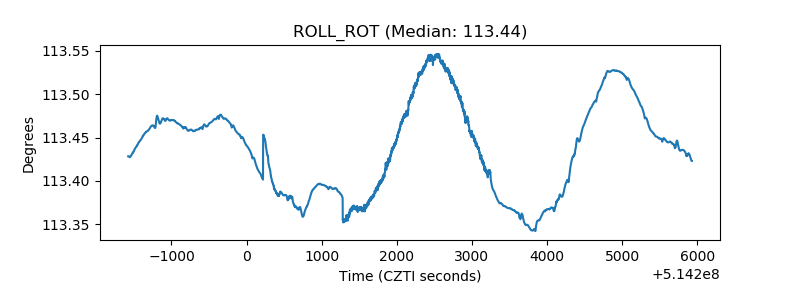 |
| _Roll_DEC | 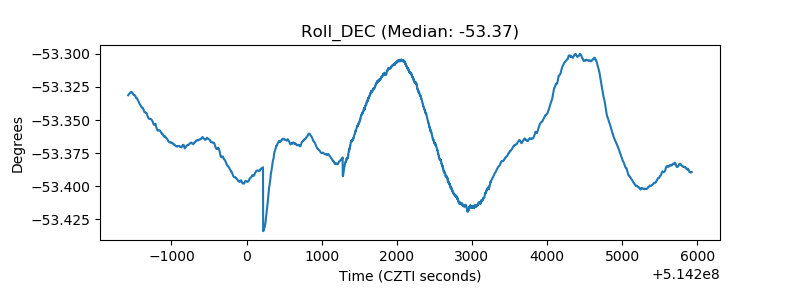 |
| _Roll_RA | 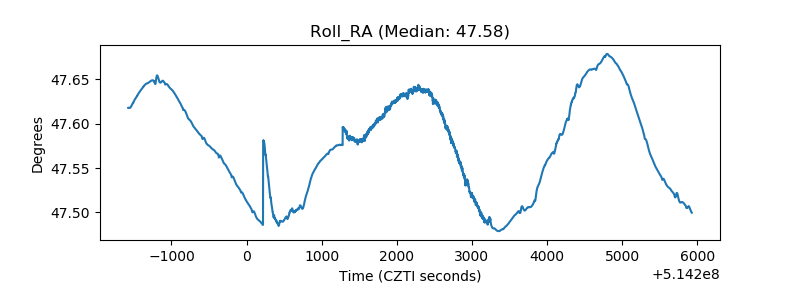 |
| Veto Counter | 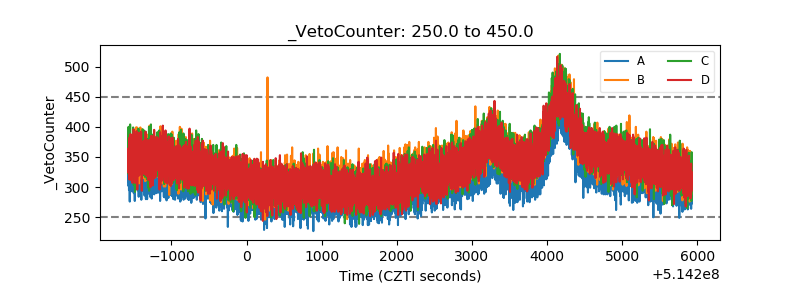 |