| Param | Original file | Final file |
|---|---|---|
| Filename | modeM0/AS1A14_083T10_9000006566_57111cztM0_level2.fits | modeM0/AS1A14_083T10_9000006566_57111cztM0_level2_quad_clean.evt |
| Size (bytes) | 1,659,358,080 | 254,033,280 |
| Size | 1.5 GB | 242.3 MB |
| Events in quadrant A | 8,552,776 | 1,817,313 |
| Events in quadrant B | 12,712,168 | 1,747,530 |
| Events in quadrant C | 21,343,501 | 1,244,757 |
| Events in quadrant D | 17,360,515 | 1,584,053 |
| Mode M9 | |||
|---|---|---|---|
| Quadrant | BADHDUFLAG | Total packets | Discarded packets |
| A | 0 | 9 | 0 |
| B | 0 | 9 | 0 |
| C | 0 | 9 | 0 |
| D | 0 | 9 | 0 |
| Mode M0 | |||
|---|---|---|---|
| Quadrant | BADHDUFLAG | Total packets | Discarded packets |
| A | 0 | 39406 | 3 |
| B | 0 | 51163 | 3 |
| C | 0 | 76781 | 3 |
| D | 0 | 64547 | 3 |
| Mode SS | |||
|---|---|---|---|
| Quadrant | BADHDUFLAG | Total packets | Discarded packets |
| A | 0 | 382 | 0 |
| B | 0 | 382 | 0 |
| C | 0 | 382 | 0 |
| D | 0 | 382 | 0 |
| Quadrant | Total seconds | Saturated seconds | Saturation percentage |
|---|---|---|---|
| A | 18824 | 169 | 0.897790% |
| B | 18825 | 1749 | 9.290837% |
| C | 18825 | 5714 | 30.353254% |
| D | 18825 | 1007 | 5.349270% |
Noise dominated data is calculated using 1-second bins in cleaned event files. If a bin has >2000 counts, and if more than 50% of those come from <1% of pixels, then it is considered to be noise-dominated and hence unusable.
| Quadrant | # 1 sec bins | Bins with >0 counts | Bins with >2000 counts | High rate bins dominated by noise | Noise dominated (total time) | Noise dominated (detector-on time) | Marked lightcurve |
|---|---|---|---|---|---|---|---|
| A | 19784 | 18827 | 30 | 30 | 0.15% | 0.16% | 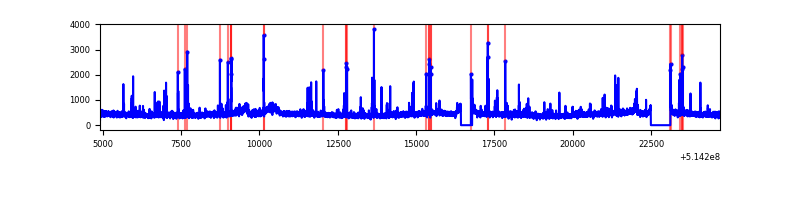 |
| B | 19785 | 18826 | 1164 | 1164 | 5.88% | 6.18% | 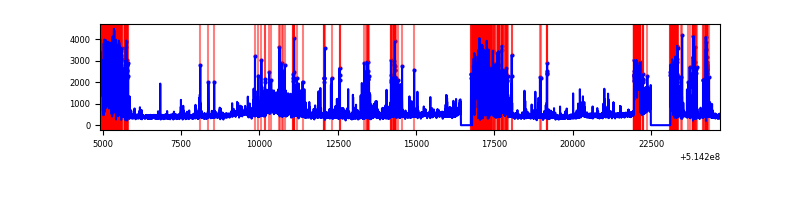 |
| C | 19785 | 18828 | 4200 | 4200 | 21.23% | 22.31% | 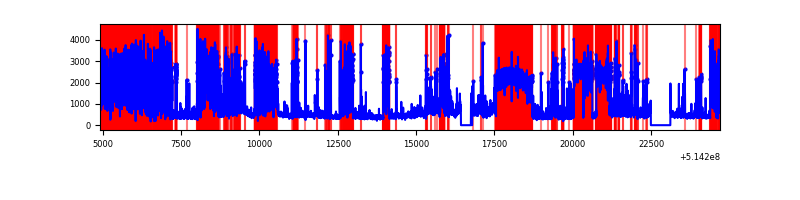 |
| D | 19785 | 18827 | 1145 | 1145 | 5.79% | 6.08% | 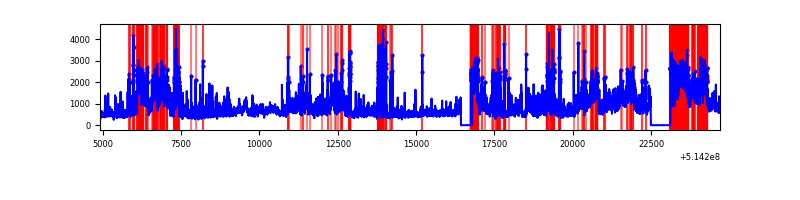 |
Top three noisy pixels from each quadrant. If the there are fewer than three noisy pixels in the level2.evt file, extra rows are filled as -1
| Pixel properties | Quadrant properties | ||||||
|---|---|---|---|---|---|---|---|
| Quadrant | DetID | PixID | Counts | Sigma | Mean | Median | Sigma |
| A | 10 | 251 | 249173 | 482.37 | 2070 | 2018 | 512.4 |
| A | 13 | 248 | 69569 | 131.84 | 2070 | 2018 | 512.4 |
| A | 4 | 159 | 62694 | 118.42 | 2070 | 2018 | 512.4 |
| B | 8 | 128 | 1911353 | 4620.77 | 1925 | 1852 | 413.2 |
| B | 10 | 16 | 1771495 | 4282.33 | 1925 | 1852 | 413.2 |
| B | 5 | 185 | 678659 | 1637.79 | 1925 | 1852 | 413.2 |
| C | 15 | 198 | 12101455 | 26689.33 | 1666 | 1651 | 453.4 |
| C | 12 | 252 | 1085319 | 2390.32 | 1666 | 1651 | 453.4 |
| C | 13 | 3 | 374172 | 821.69 | 1666 | 1651 | 453.4 |
| D | 15 | 142 | 6227770 | 11222.75 | 1961 | 1870 | 554.8 |
| D | 8 | 160 | 1060494 | 1908.27 | 1961 | 1870 | 554.8 |
| D | 12 | 33 | 955237 | 1718.53 | 1961 | 1870 | 554.8 |
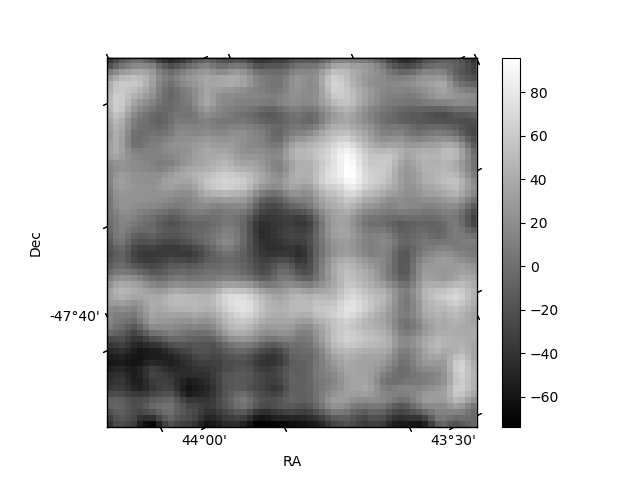
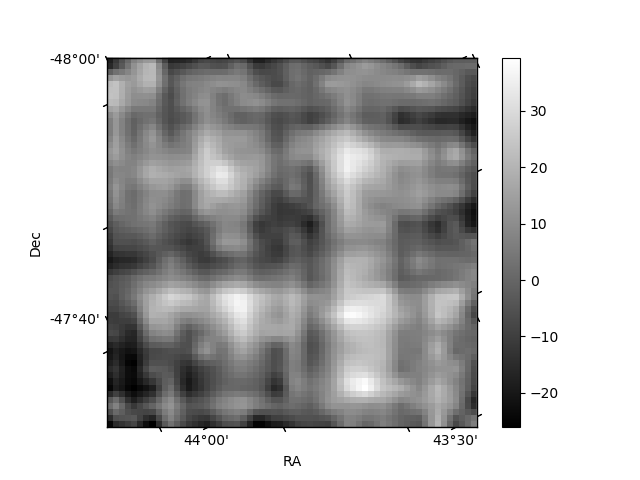
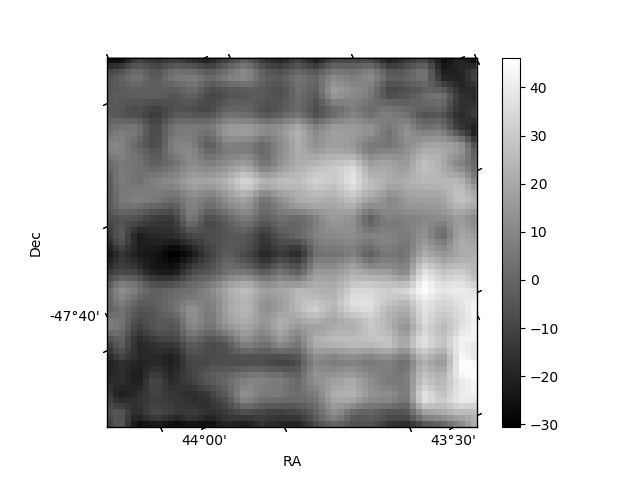
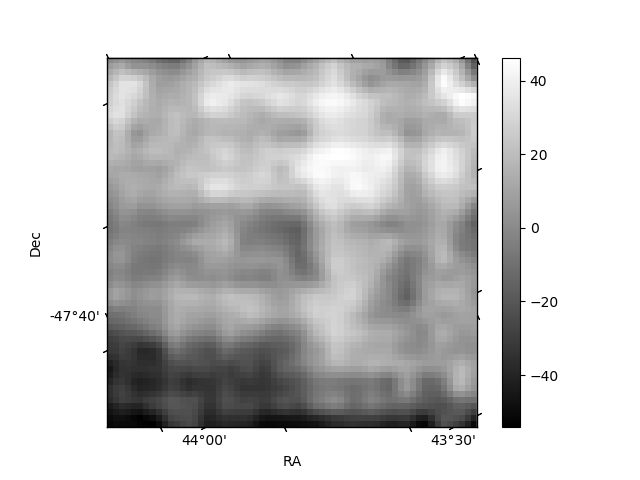
Histogram calculated using DETX and DETY for each event in the final _common_clean file
| Quadrant A | 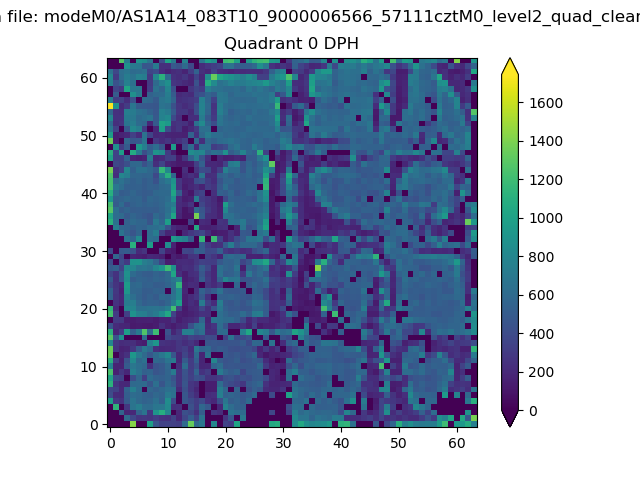 |
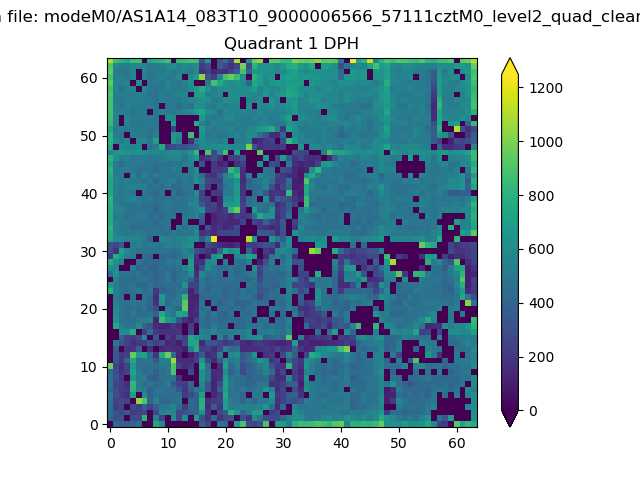 |
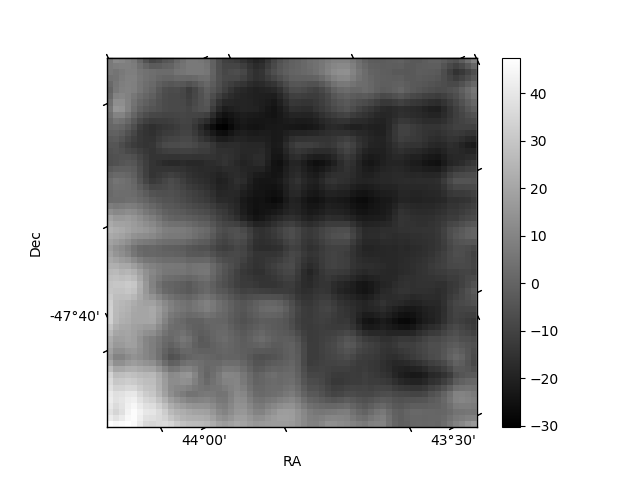
Quadrant B |
|---|---|---|---|
| Quadrant D | 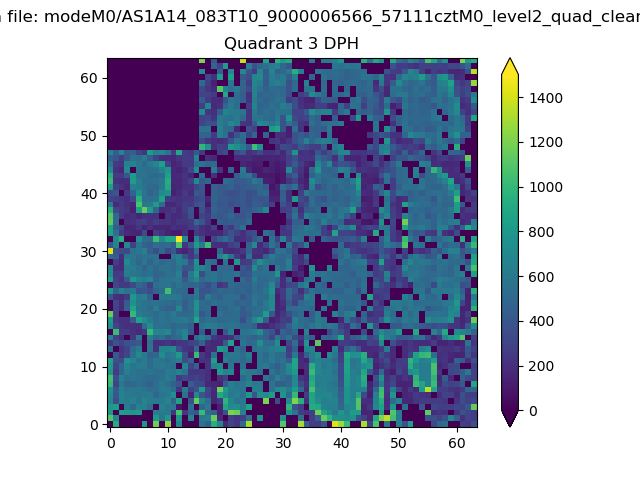 |
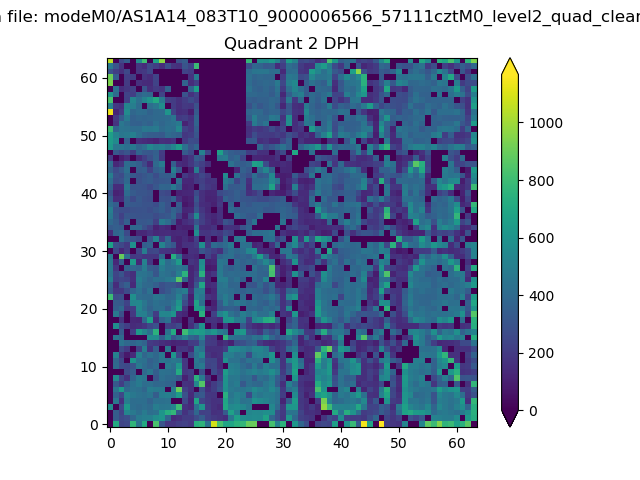 |
Quadrant C |
| Plot type | Count rate plots | Images |
|---|---|---|
| Comparison with Poisson distribution Blue bars denote a histogram of data divided into 1 sec bins. Red curve is a Poisson curve with rate = median count rate of data. |
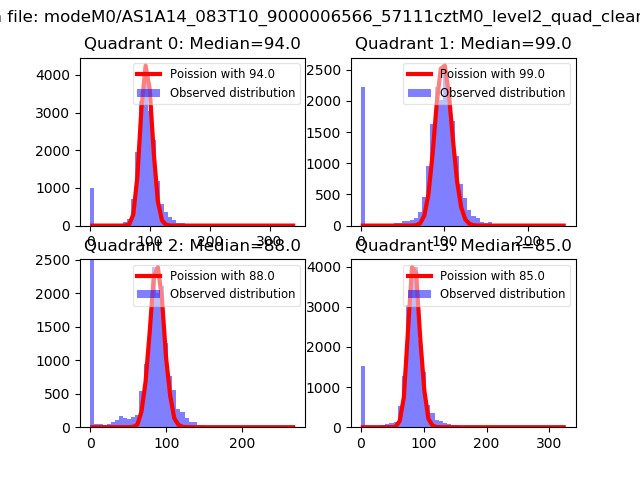 |
 |
| Quadrant-wise count rates Data is divided into 100 sec bins |
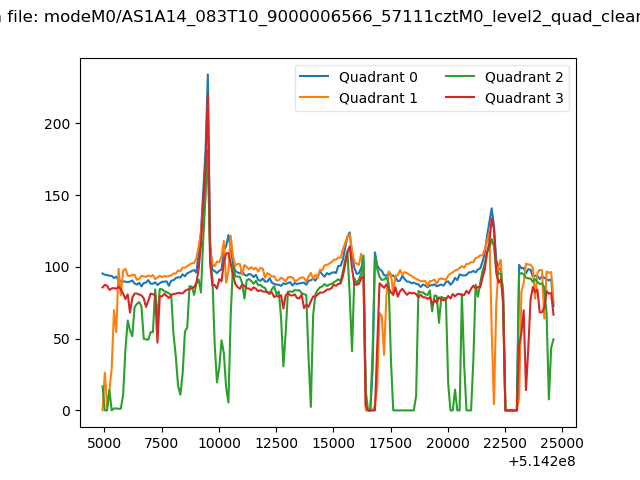 |
|
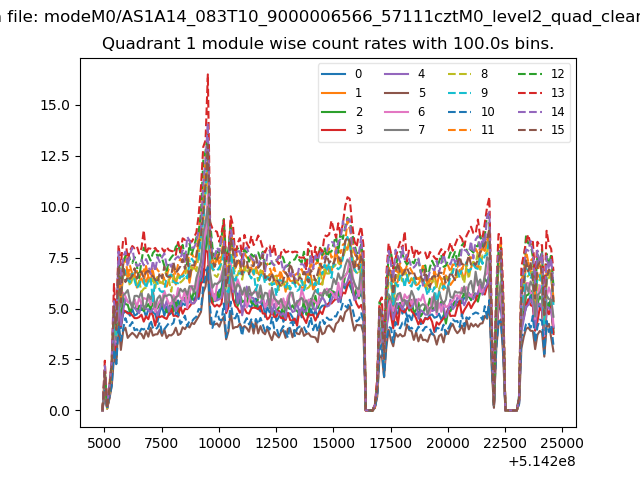
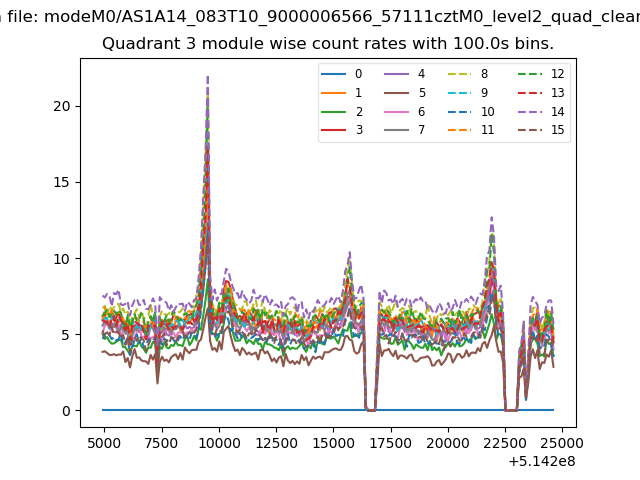
| Module-wise count rates for Quadrant A Data is divided into 100 sec bins |
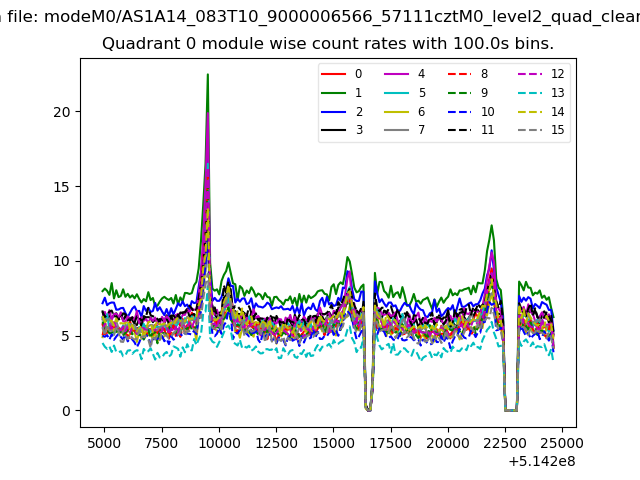 |
 |
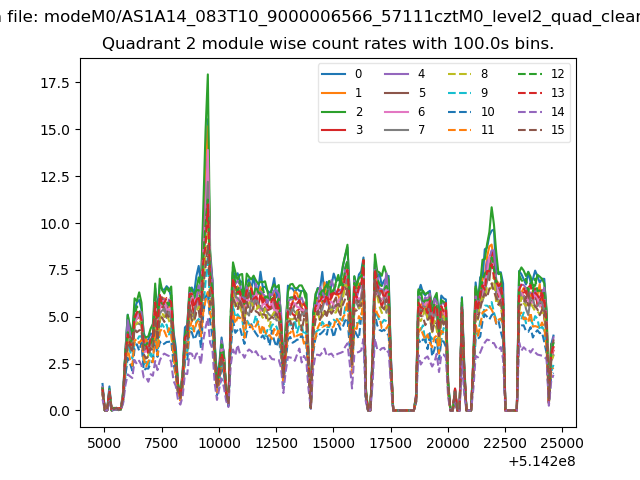
| Module-wise count rates for Quadrant B Data is divided into 100 sec bins |
 |
 |
| Module-wise count rates for Quadrant C Data is divided into 100 sec bins |
 |
 |
| Module-wise count rates for Quadrant D Data is divided into 100 sec bins |
 |
 |
| Parameter | Plot |
|---|---|
| CZT HV Monitor |  |
| D_VDD | 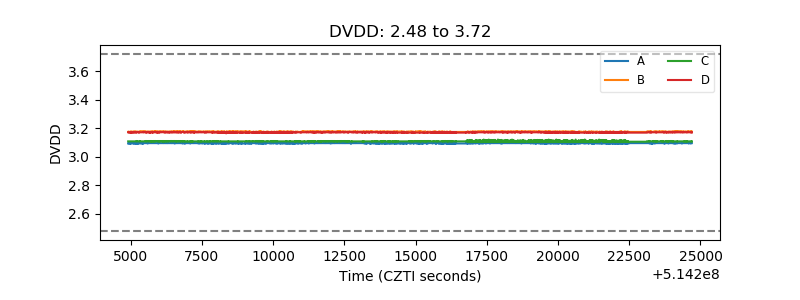 |
| Temperature 1 | 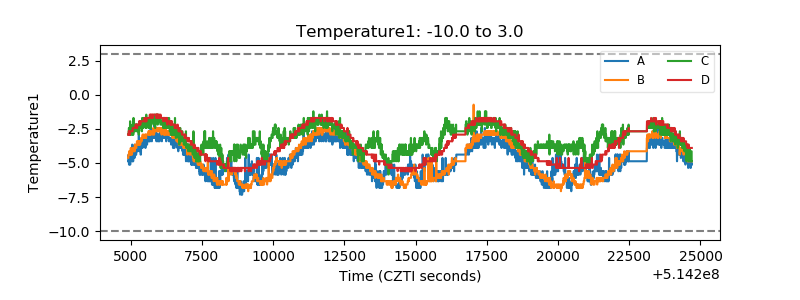 |
| Veto HV Monitor | 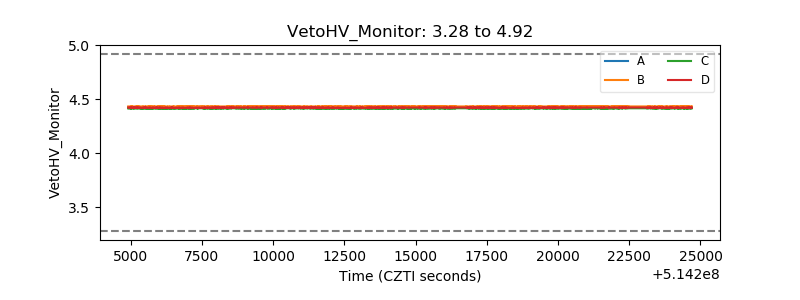 |
| Veto LLD | 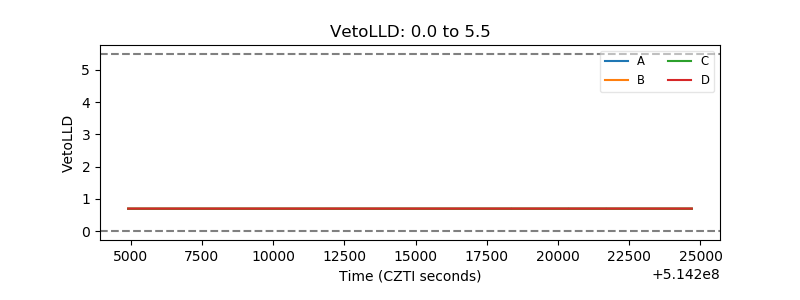 |
| Alpha Counter | 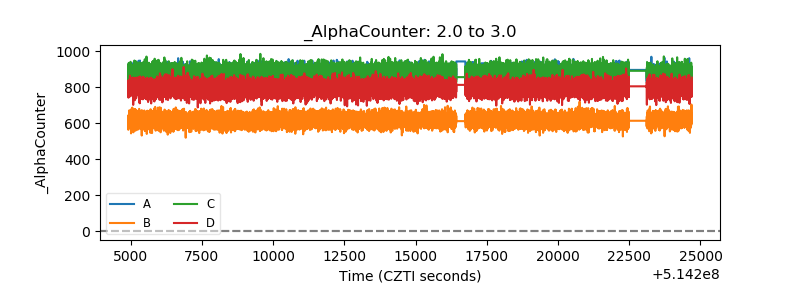 |
| _CPM_Rate | 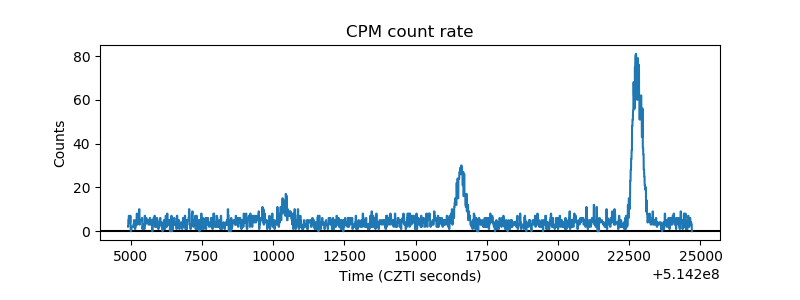 |
| CZT Counter | 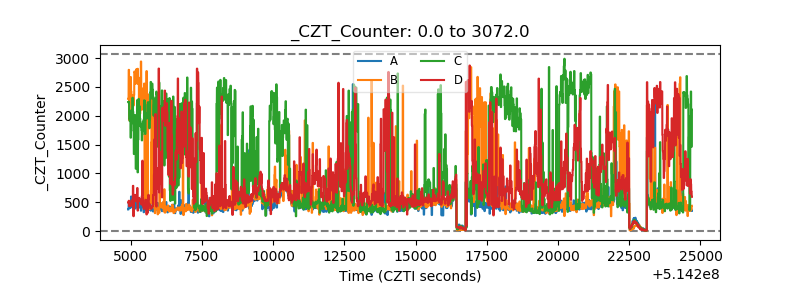 |
| +2.5 Volts monitor |  |
| +5 Volts monitor | 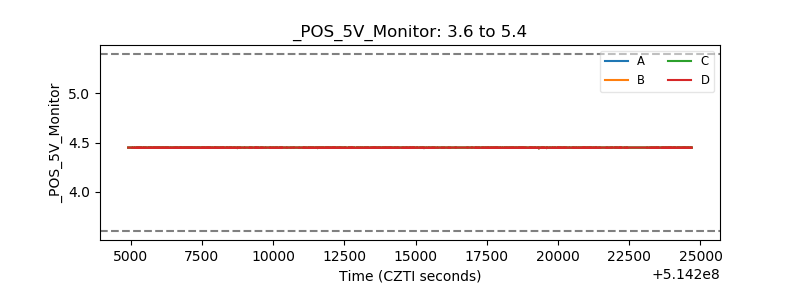 |
| _ROLL_ROT | 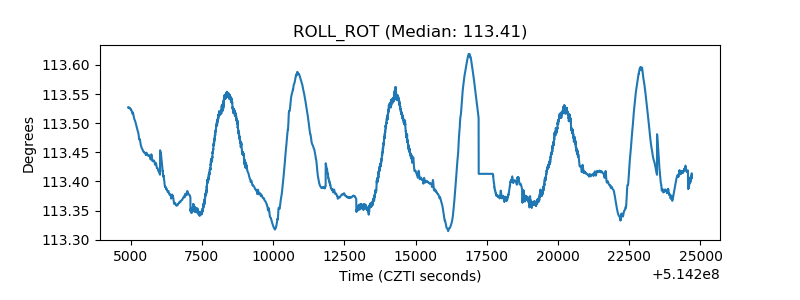 |
| _Roll_DEC | 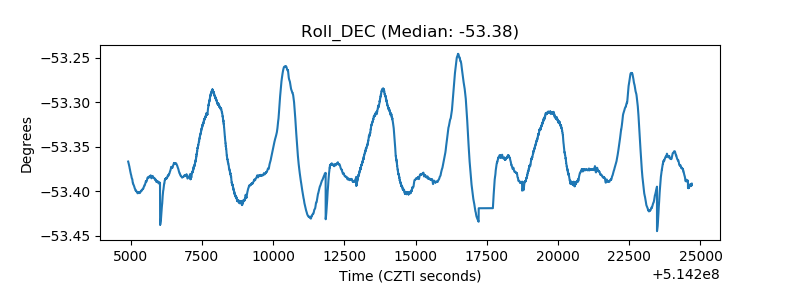 |
| _Roll_RA | 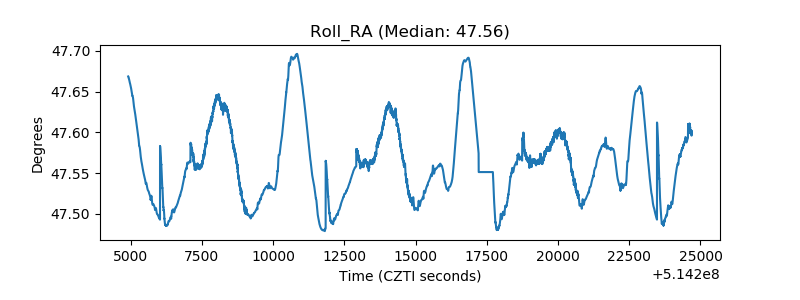 |
| Veto Counter | 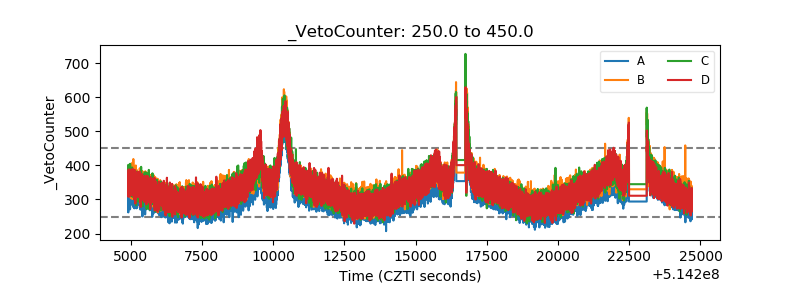 |