| Param | Original file | Final file |
|---|---|---|
| Filename | modeM0/AS1A14_083T10_9000006566_57113cztM0_level2.fits | modeM0/AS1A14_083T10_9000006566_57113cztM0_level2_quad_clean.evt |
| Size (bytes) | 581,042,880 | 89,159,040 |
| Size | 554.1 MB | 85.0 MB |
| Events in quadrant A | 3,092,782 | 647,308 |
| Events in quadrant B | 4,224,707 | 637,455 |
| Events in quadrant C | 6,882,787 | 427,644 |
| Events in quadrant D | 6,799,609 | 530,953 |
| Mode M9 | |||
|---|---|---|---|
| Quadrant | BADHDUFLAG | Total packets | Discarded packets |
| A | 0 | 10 | 0 |
| B | 0 | 10 | 0 |
| C | 0 | 10 | 0 |
| D | 0 | 10 | 0 |
| Mode M0 | |||
|---|---|---|---|
| Quadrant | BADHDUFLAG | Total packets | Discarded packets |
| A | 0 | 13975 | 1 |
| B | 0 | 17115 | 1 |
| C | 0 | 25070 | 1 |
| D | 0 | 24767 | 1 |
| Mode SS | |||
|---|---|---|---|
| Quadrant | BADHDUFLAG | Total packets | Discarded packets |
| A | 0 | 132 | 0 |
| B | 0 | 132 | 0 |
| C | 0 | 132 | 0 |
| D | 0 | 132 | 0 |
| Quadrant | Total seconds | Saturated seconds | Saturation percentage |
|---|---|---|---|
| A | 6542 | 73 | 1.115867% |
| B | 6543 | 469 | 7.167966% |
| C | 6543 | 2185 | 33.394467% |
| D | 6542 | 648 | 9.905228% |
Noise dominated data is calculated using 1-second bins in cleaned event files. If a bin has >2000 counts, and if more than 50% of those come from <1% of pixels, then it is considered to be noise-dominated and hence unusable.
| Quadrant | # 1 sec bins | Bins with >0 counts | Bins with >2000 counts | High rate bins dominated by noise | Noise dominated (total time) | Noise dominated (detector-on time) | Marked lightcurve |
|---|---|---|---|---|---|---|---|
| A | 7472 | 6543 | 23 | 23 | 0.31% | 0.35% | 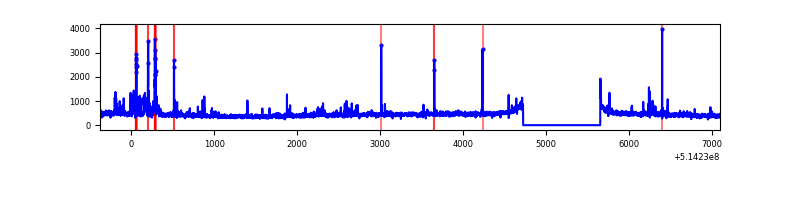 |
| B | 7473 | 6544 | 299 | 299 | 4.00% | 4.57% | 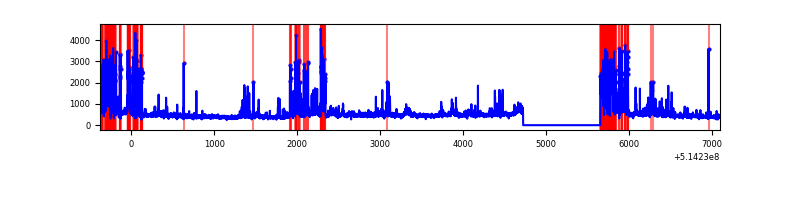 |
| C | 7472 | 6542 | 1553 | 1553 | 20.78% | 23.74% | 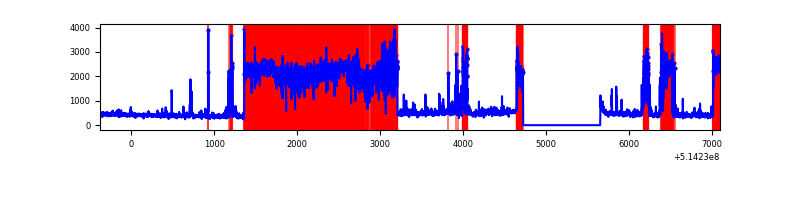 |
| D | 7472 | 6543 | 631 | 631 | 8.44% | 9.64% | 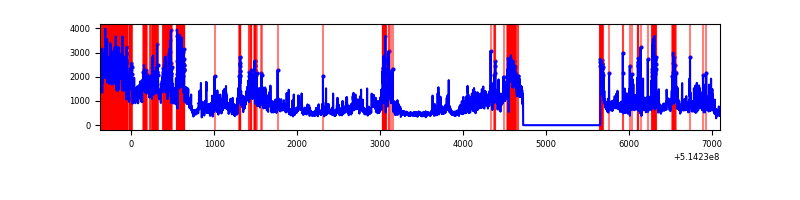 |
Top three noisy pixels from each quadrant. If the there are fewer than three noisy pixels in the level2.evt file, extra rows are filled as -1
| Pixel properties | Quadrant properties | ||||||
|---|---|---|---|---|---|---|---|
| Quadrant | DetID | PixID | Counts | Sigma | Mean | Median | Sigma |
| A | 10 | 251 | 114501 | 642.3 | 709 | 691 | 177.2 |
| A | 4 | 95 | 98052 | 549.47 | 709 | 691 | 177.2 |
| A | 0 | 12 | 34703 | 191.95 | 709 | 691 | 177.2 |
| B | 10 | 16 | 1222510 | 8508.02 | 673 | 649 | 143.6 |
| B | 4 | 171 | 84336 | 582.73 | 673 | 649 | 143.6 |
| B | 5 | 185 | 55501 | 381.94 | 673 | 649 | 143.6 |
| C | 15 | 198 | 4339277 | 29187.82 | 540 | 535 | 148.6 |
| C | 12 | 254 | 146332 | 980.81 | 540 | 535 | 148.6 |
| C | 12 | 252 | 105536 | 706.37 | 540 | 535 | 148.6 |
| D | 15 | 142 | 1879971 | 9928.42 | 659 | 626 | 189.3 |
| D | 12 | 33 | 1070917 | 5654.26 | 659 | 626 | 189.3 |
| D | 8 | 160 | 578158 | 3051.05 | 659 | 626 | 189.3 |
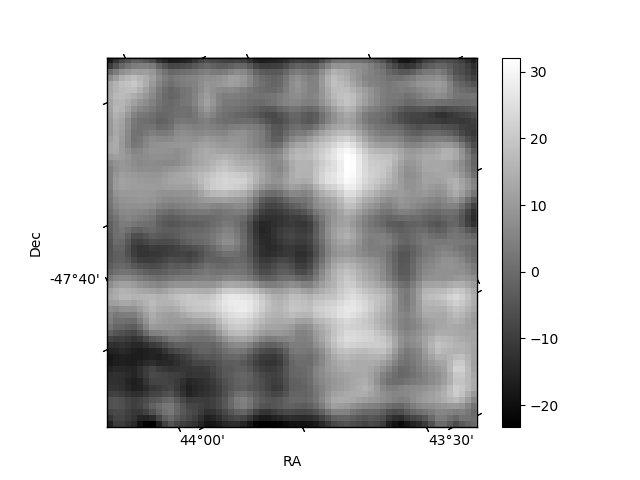
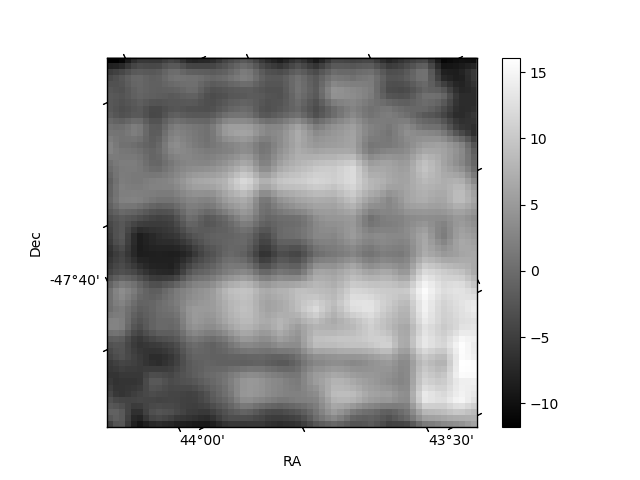
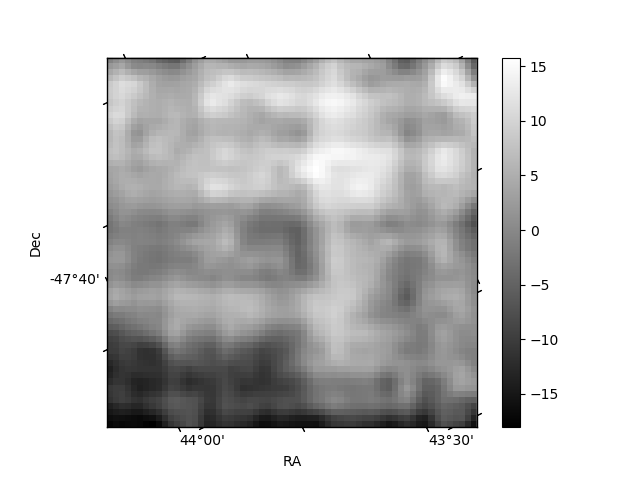
Histogram calculated using DETX and DETY for each event in the final _common_clean file
| Quadrant A | 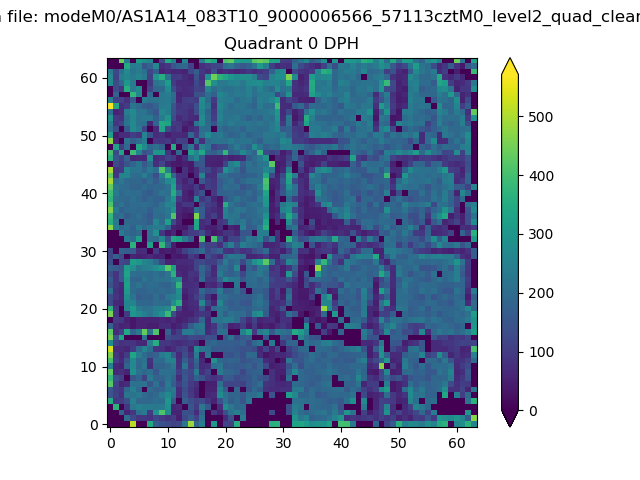 |
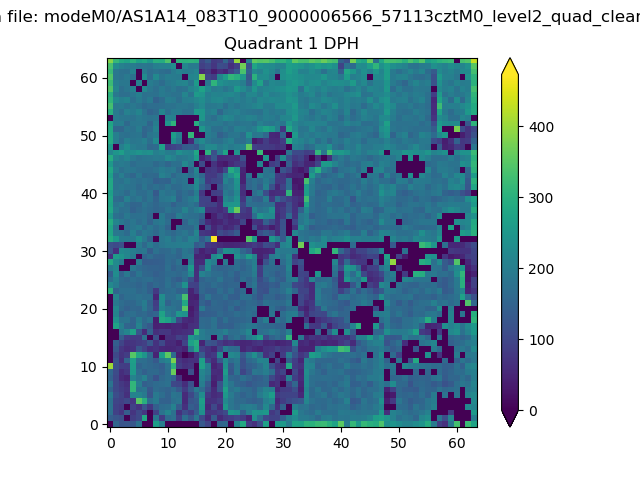 |
Quadrant B |
|---|---|---|---|
| Quadrant D | 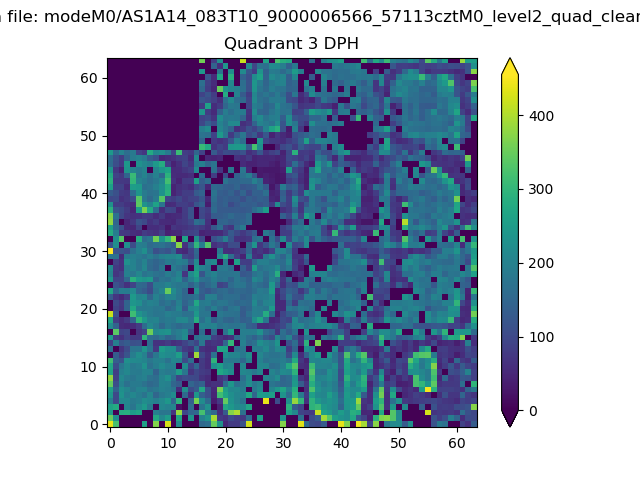 |
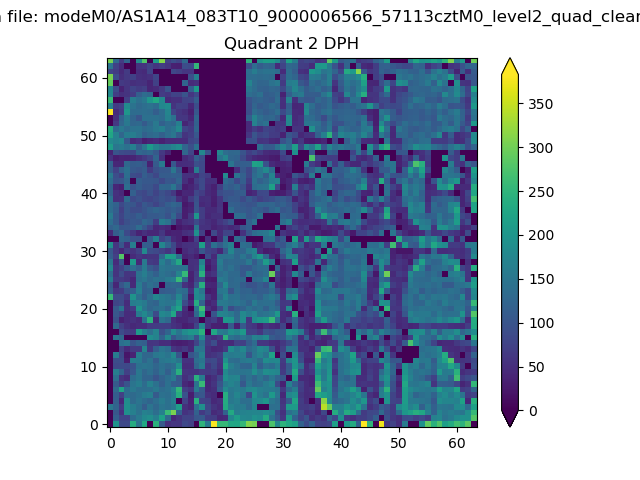 |
Quadrant C |
| Plot type | Count rate plots | Images |
|---|---|---|
| Comparison with Poisson distribution Blue bars denote a histogram of data divided into 1 sec bins. Red curve is a Poisson curve with rate = median count rate of data. |
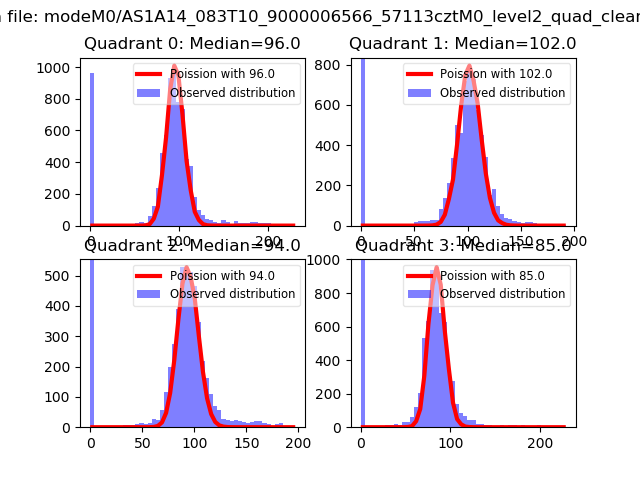 |
 |
| Quadrant-wise count rates Data is divided into 100 sec bins |
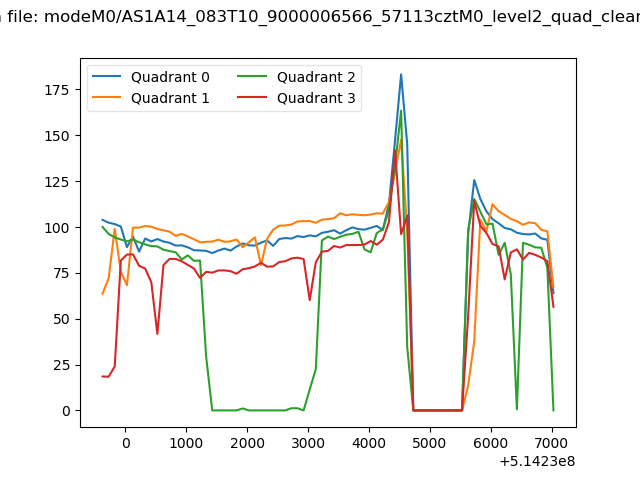 |
|
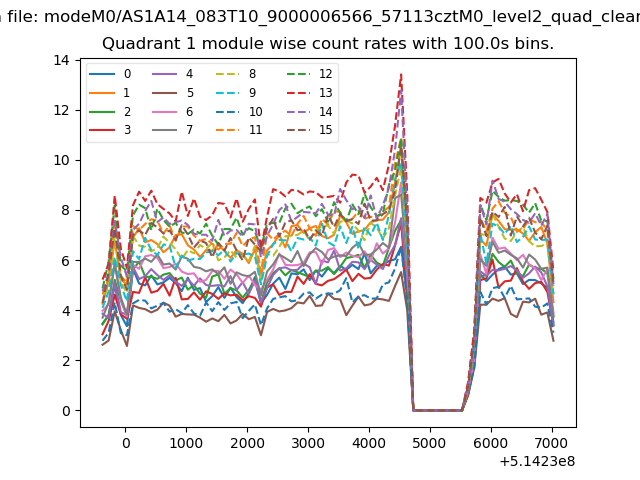
| Module-wise count rates for Quadrant A Data is divided into 100 sec bins |
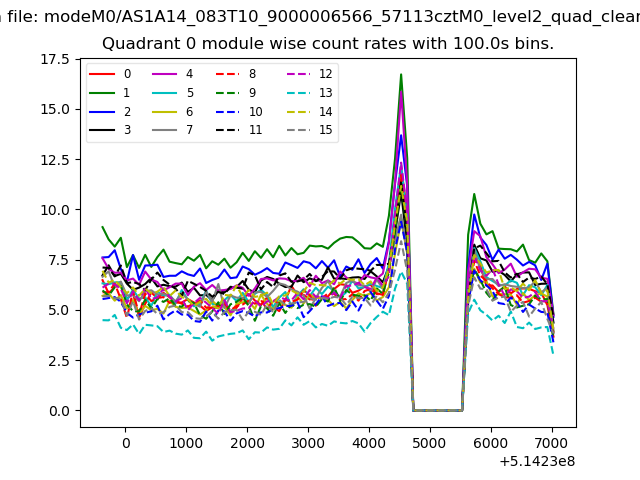 |
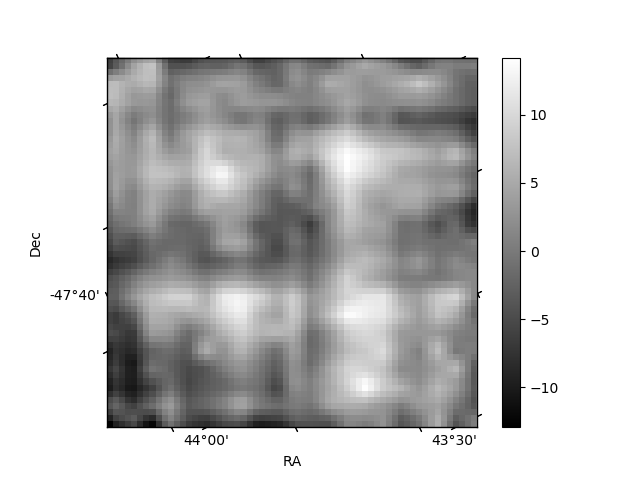 |
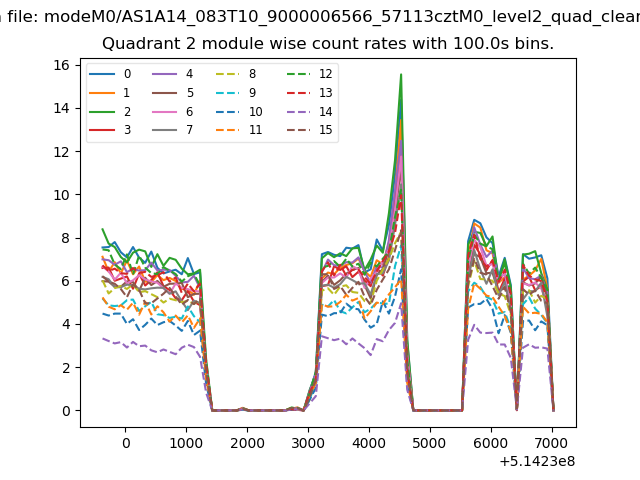
| Module-wise count rates for Quadrant B Data is divided into 100 sec bins |
 |
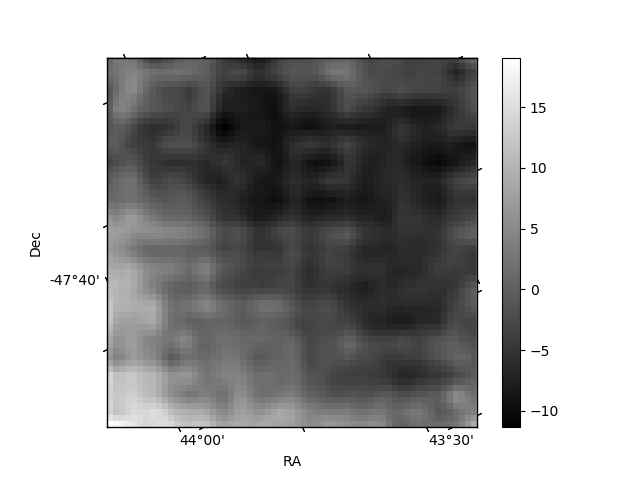 |
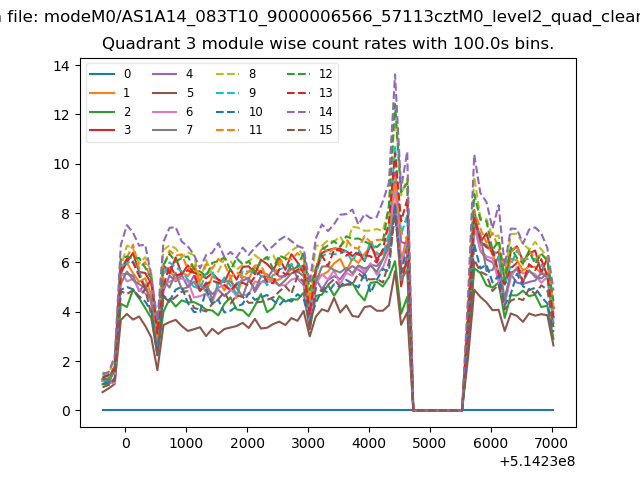
| Module-wise count rates for Quadrant C Data is divided into 100 sec bins |
 |
 |
| Module-wise count rates for Quadrant D Data is divided into 100 sec bins |
 |
 |
| Parameter | Plot |
|---|---|
| CZT HV Monitor | 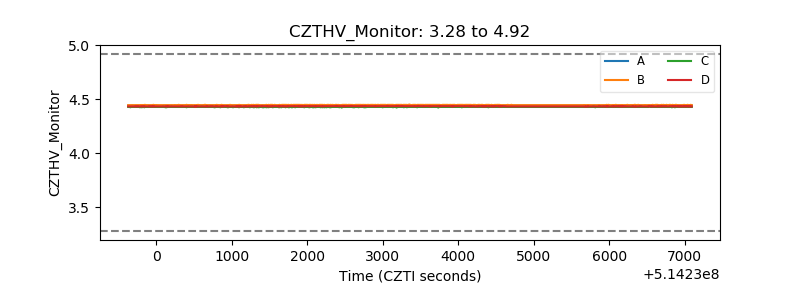 |
| D_VDD | 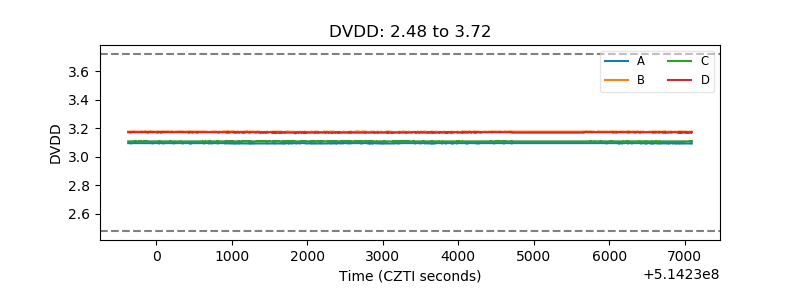 |
| Temperature 1 | 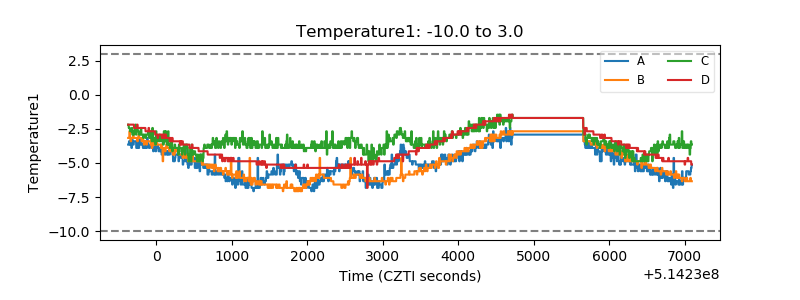 |
| Veto HV Monitor | 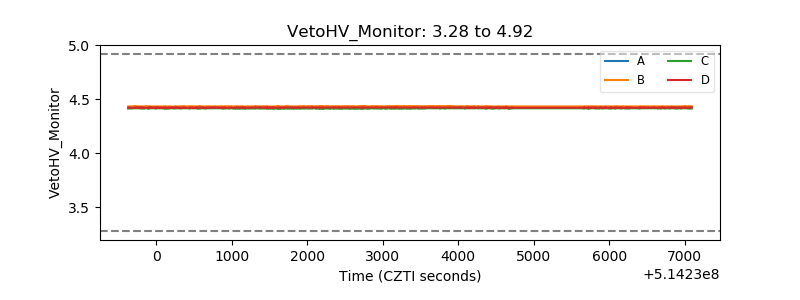 |
| Veto LLD | 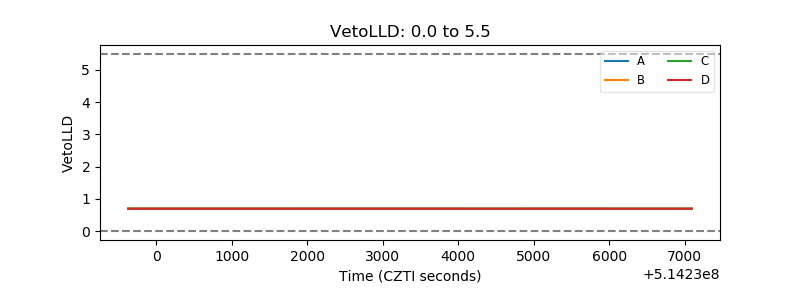 |
| Alpha Counter | 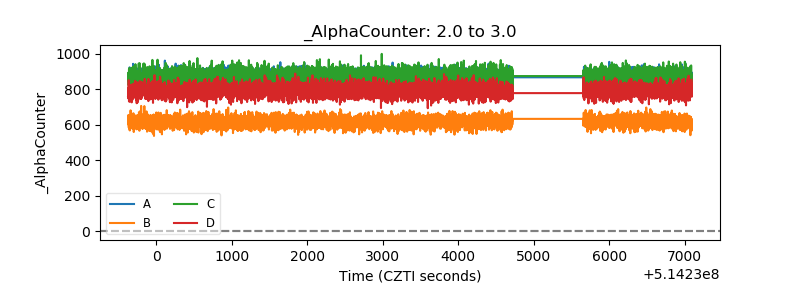 |
| _CPM_Rate | 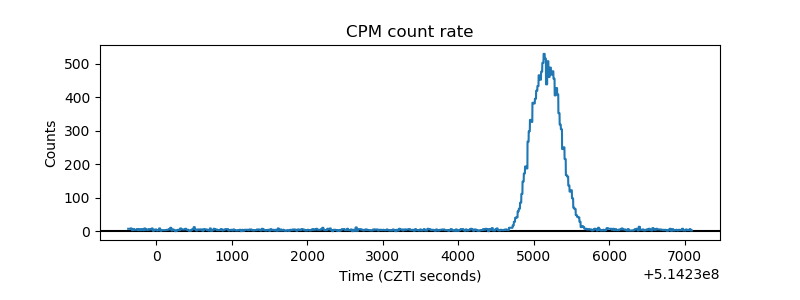 |
| CZT Counter | 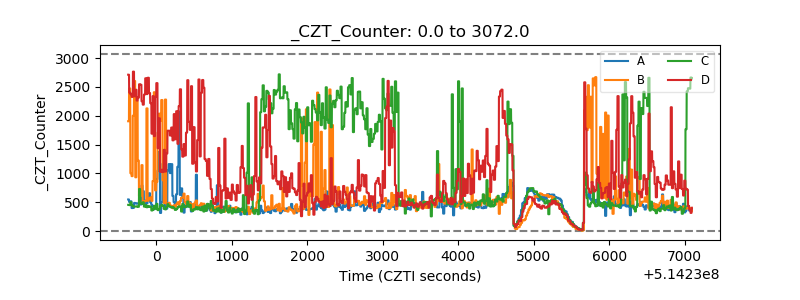 |
| +2.5 Volts monitor |  |
| +5 Volts monitor | 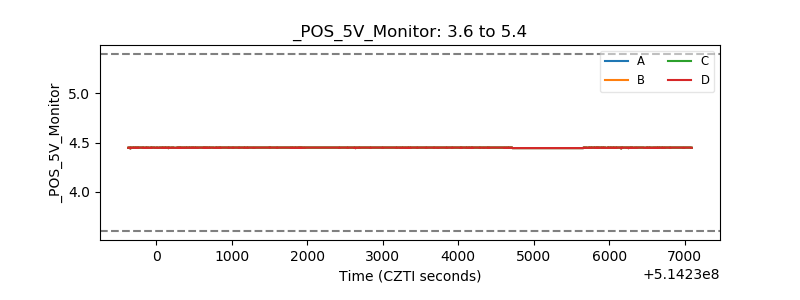 |
| _ROLL_ROT | 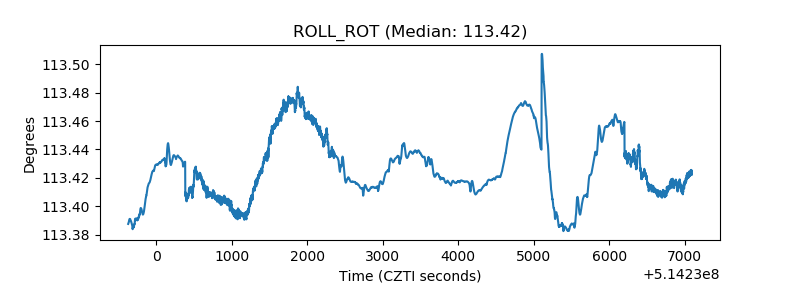 |
| _Roll_DEC | 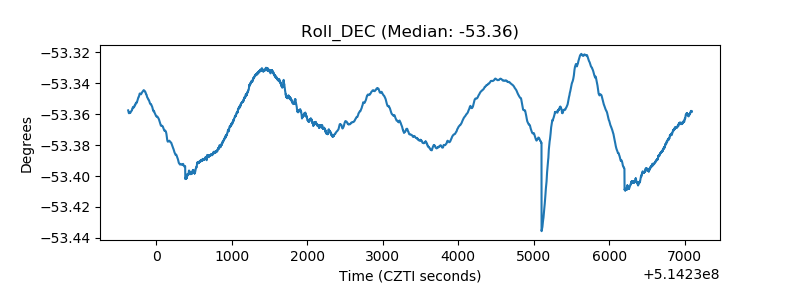 |
| _Roll_RA | 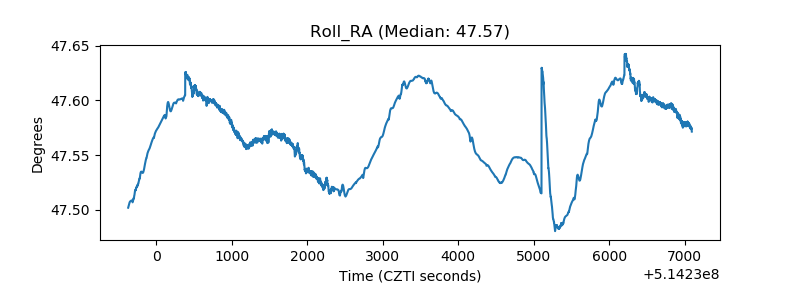 |
| Veto Counter | 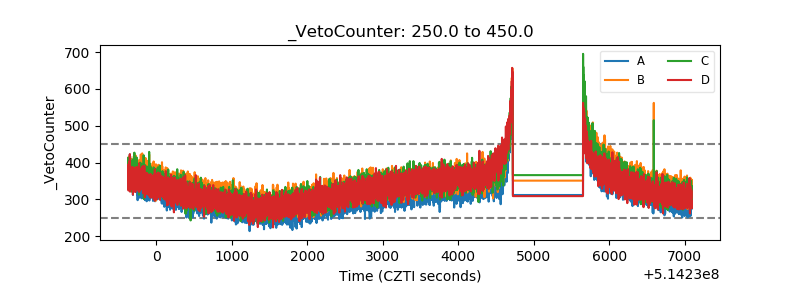 |