| Param | Original file | Final file |
|---|---|---|
| Filename | modeM0/AS1A14_083T10_9000006566_57115cztM0_level2.fits | modeM0/AS1A14_083T10_9000006566_57115cztM0_level2_quad_clean.evt |
| Size (bytes) | 566,389,440 | 90,518,400 |
| Size | 540.2 MB | 86.3 MB |
| Events in quadrant A | 3,211,779 | 648,817 |
| Events in quadrant B | 4,189,935 | 639,461 |
| Events in quadrant C | 7,415,309 | 438,781 |
| Events in quadrant D | 5,639,059 | 557,142 |
| Mode M9 | |||
|---|---|---|---|
| Quadrant | BADHDUFLAG | Total packets | Discarded packets |
| A | 0 | 14 | 0 |
| B | 0 | 15 | 0 |
| C | 0 | 15 | 0 |
| D | 0 | 15 | 0 |
| Mode M0 | |||
|---|---|---|---|
| Quadrant | BADHDUFLAG | Total packets | Discarded packets |
| A | 0 | 14439 | 2 |
| B | 0 | 17140 | 2 |
| C | 0 | 26637 | 2 |
| D | 0 | 21357 | 2 |
| Mode SS | |||
|---|---|---|---|
| Quadrant | BADHDUFLAG | Total packets | Discarded packets |
| A | 0 | 132 | 0 |
| B | 0 | 132 | 0 |
| C | 0 | 132 | 0 |
| D | 0 | 132 | 0 |
| Quadrant | Total seconds | Saturated seconds | Saturation percentage |
|---|---|---|---|
| A | 6552 | 177 | 2.701465% |
| B | 6552 | 543 | 8.287546% |
| C | 6552 | 2310 | 35.256410% |
| D | 6551 | 430 | 6.563883% |
Noise dominated data is calculated using 1-second bins in cleaned event files. If a bin has >2000 counts, and if more than 50% of those come from <1% of pixels, then it is considered to be noise-dominated and hence unusable.
| Quadrant | # 1 sec bins | Bins with >0 counts | Bins with >2000 counts | High rate bins dominated by noise | Noise dominated (total time) | Noise dominated (detector-on time) | Marked lightcurve |
|---|---|---|---|---|---|---|---|
| A | 7612 | 6553 | 83 | 83 | 1.09% | 1.27% | 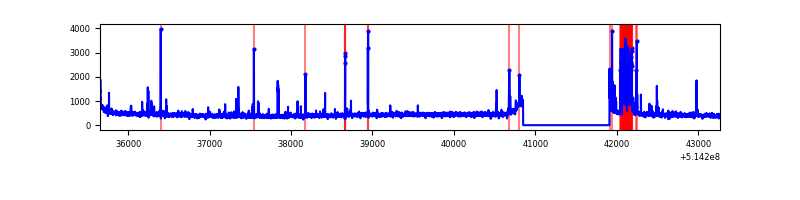 |
| B | 7612 | 6553 | 351 | 351 | 4.61% | 5.36% | 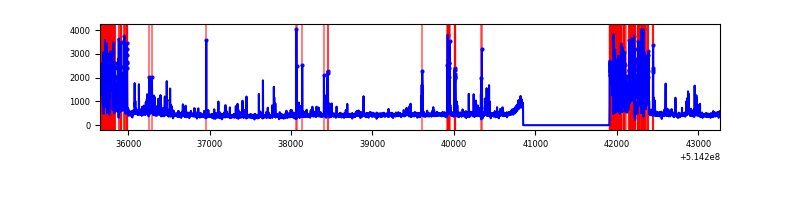 |
| C | 7612 | 6553 | 1881 | 1881 | 24.71% | 28.70% | 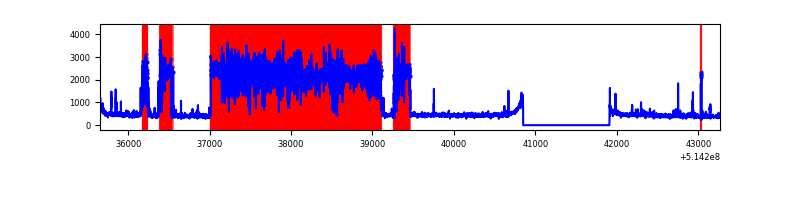 |
| D | 7611 | 6552 | 452 | 452 | 5.94% | 6.90% | 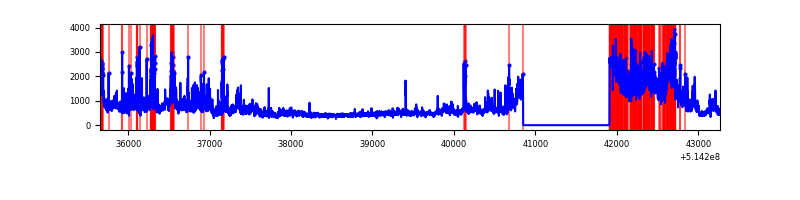 |
Top three noisy pixels from each quadrant. If the there are fewer than three noisy pixels in the level2.evt file, extra rows are filled as -1
| Pixel properties | Quadrant properties | ||||||
|---|---|---|---|---|---|---|---|
| Quadrant | DetID | PixID | Counts | Sigma | Mean | Median | Sigma |
| A | 13 | 248 | 251288 | 1406.53 | 717 | 699 | 178.2 |
| A | 10 | 251 | 112567 | 627.9 | 717 | 699 | 178.2 |
| A | 5 | 113 | 22054 | 119.86 | 717 | 699 | 178.2 |
| B | 10 | 16 | 1065398 | 7411.75 | 677 | 653 | 143.7 |
| B | 5 | 185 | 128593 | 890.6 | 677 | 653 | 143.7 |
| B | 4 | 171 | 72590 | 500.76 | 677 | 653 | 143.7 |
| C | 15 | 198 | 5006687 | 31911.91 | 568 | 561 | 156.9 |
| C | 12 | 252 | 53609 | 338.16 | 568 | 561 | 156.9 |
| C | 14 | 67 | 45237 | 284.79 | 568 | 561 | 156.9 |
| D | 15 | 142 | 2000114 | 10384.31 | 671 | 641 | 192.5 |
| D | 12 | 33 | 398477 | 2066.17 | 671 | 641 | 192.5 |
| D | 2 | 249 | 279648 | 1449.03 | 671 | 641 | 192.5 |
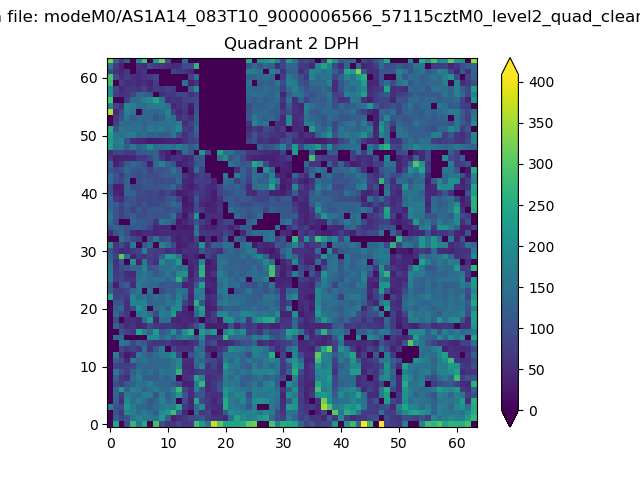
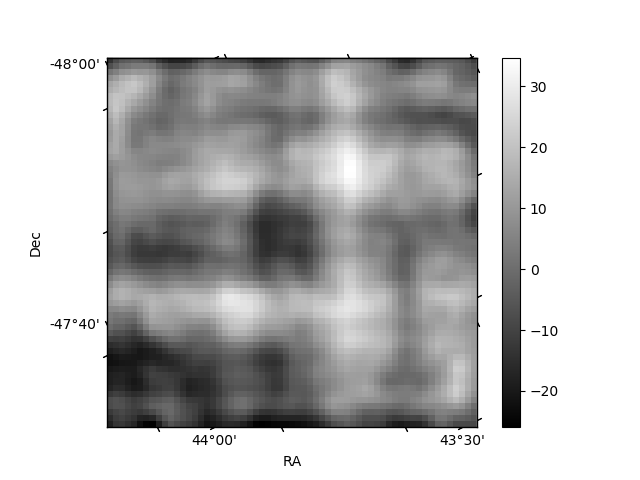
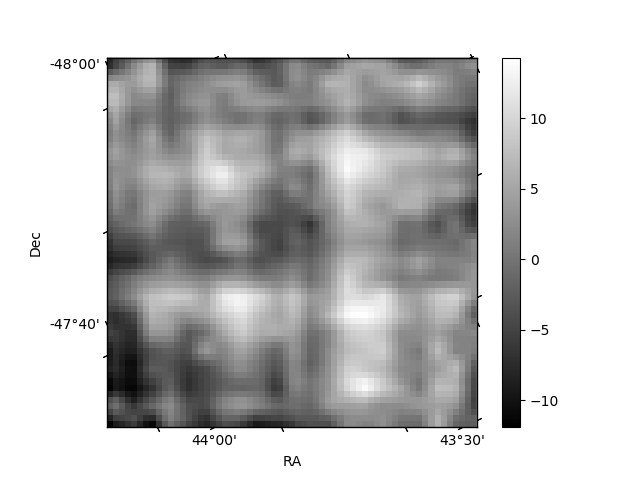
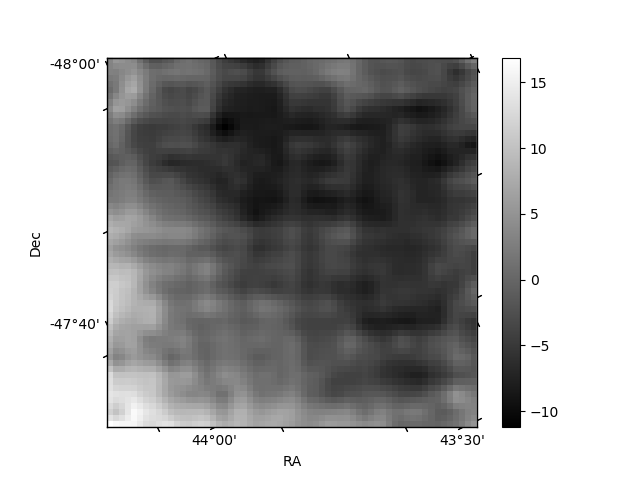
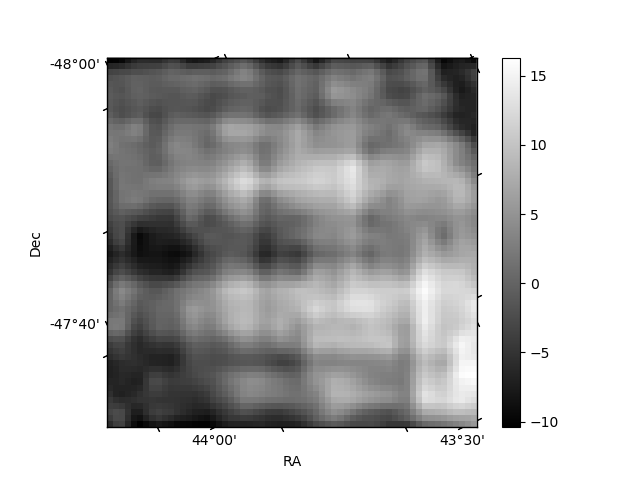
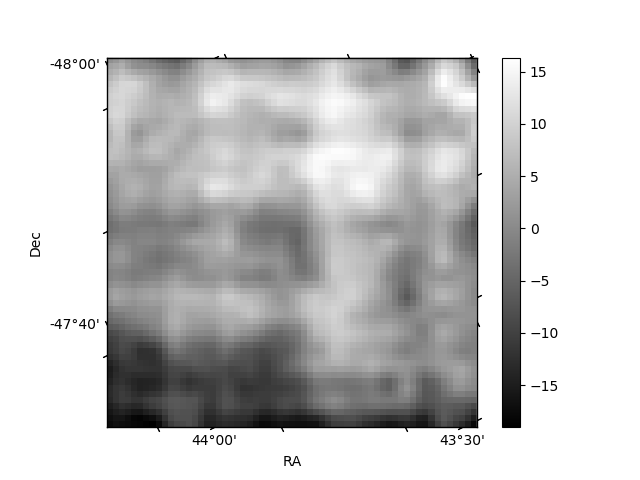
Histogram calculated using DETX and DETY for each event in the final _common_clean file
| Quadrant A | 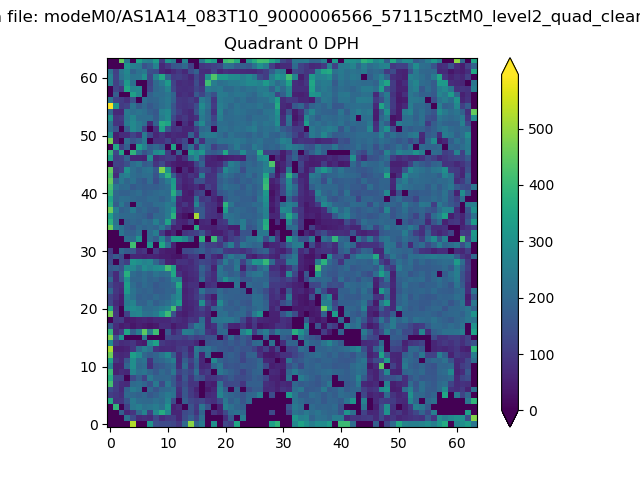 |
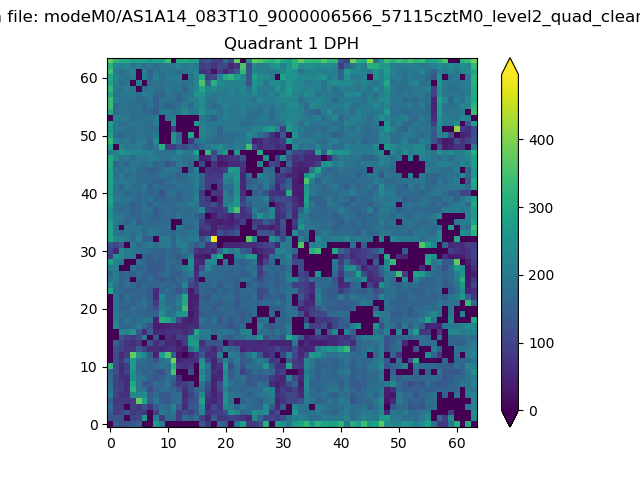 |
Quadrant B |
|---|---|---|---|
| Quadrant D | 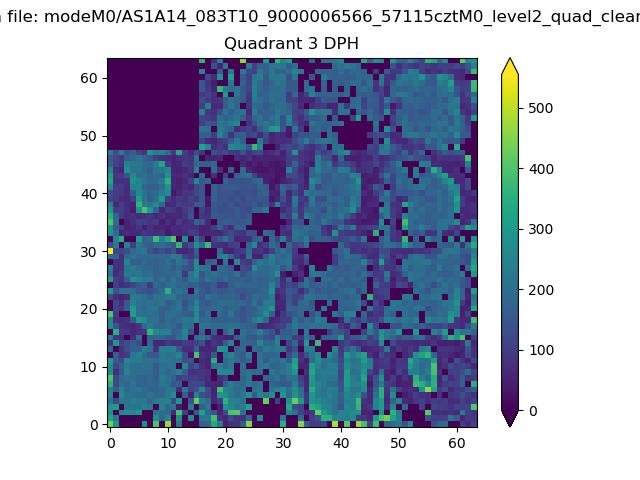 |
 |
Quadrant C |
| Plot type | Count rate plots | Images |
|---|---|---|
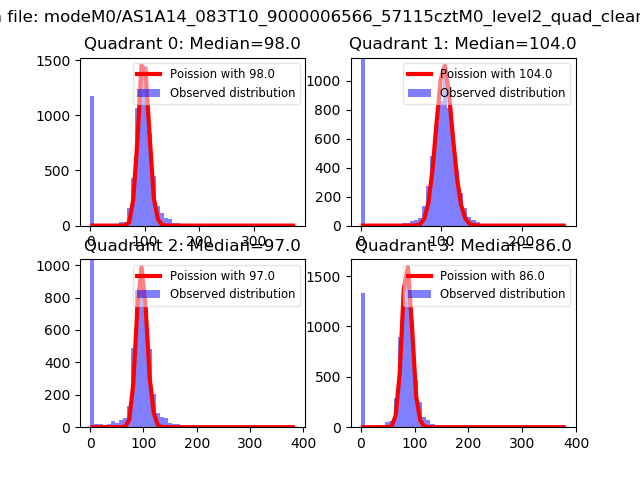
| Comparison with Poisson distribution Blue bars denote a histogram of data divided into 1 sec bins. Red curve is a Poisson curve with rate = median count rate of data. |
 |
 |
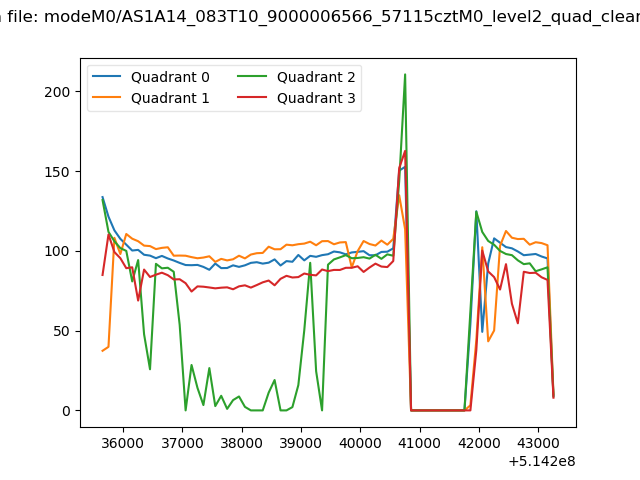
| Quadrant-wise count rates Data is divided into 100 sec bins |
 |
|
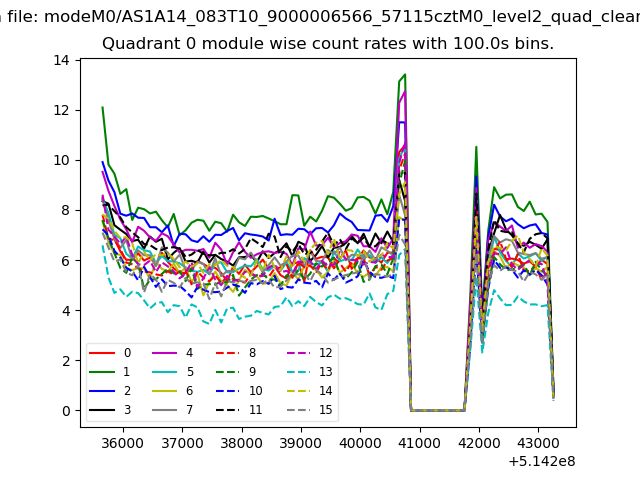
| Module-wise count rates for Quadrant A Data is divided into 100 sec bins |
 |
 |
| Module-wise count rates for Quadrant B Data is divided into 100 sec bins |
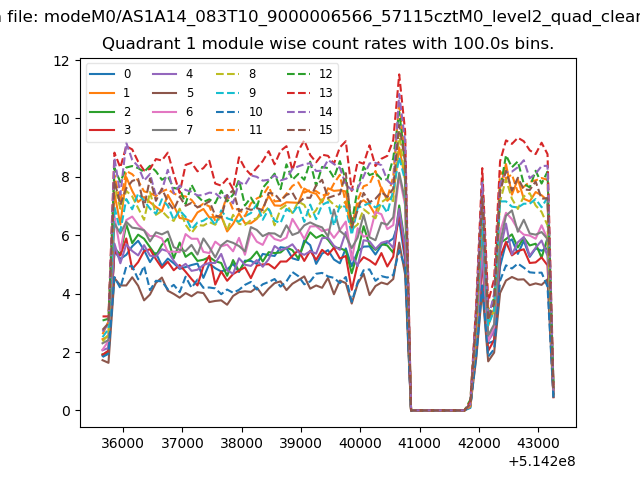 |
 |
| Module-wise count rates for Quadrant C Data is divided into 100 sec bins |
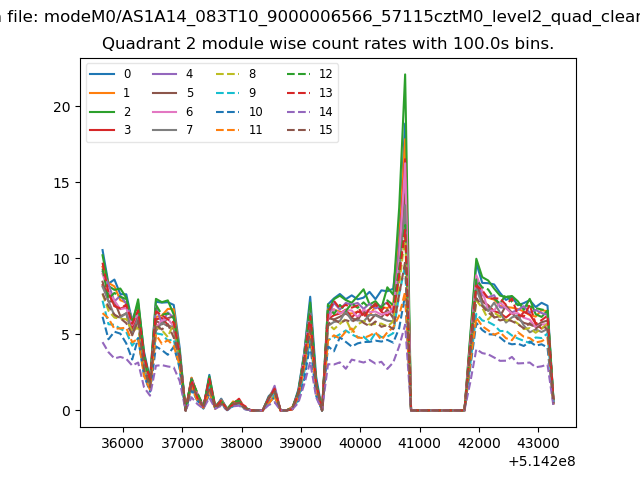 |
 |
| Module-wise count rates for Quadrant D Data is divided into 100 sec bins |
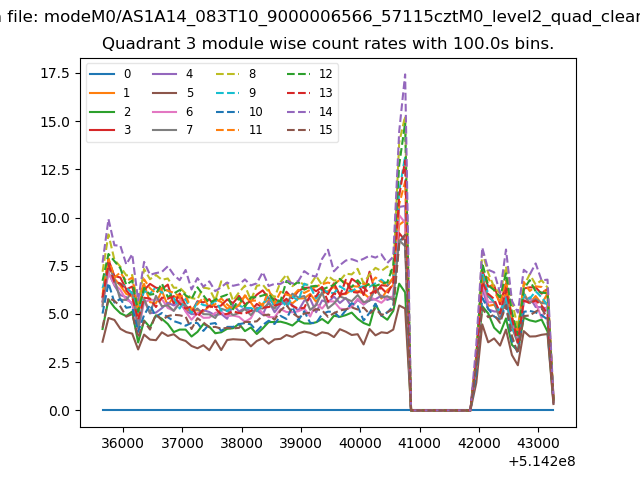 |
 |
| Parameter | Plot |
|---|---|
| CZT HV Monitor | 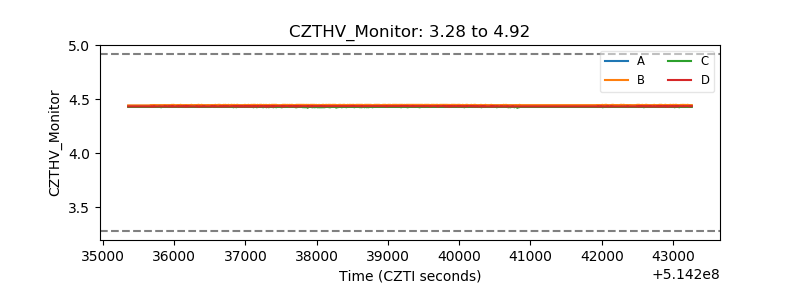 |
| D_VDD | 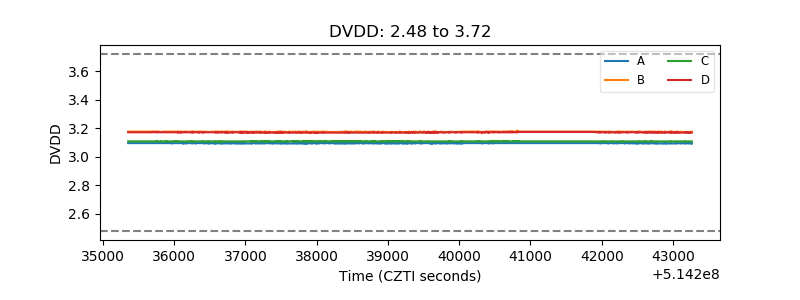 |
| Temperature 1 | 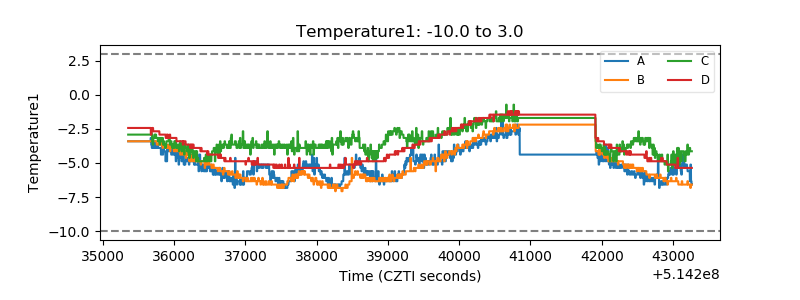 |
| Veto HV Monitor | 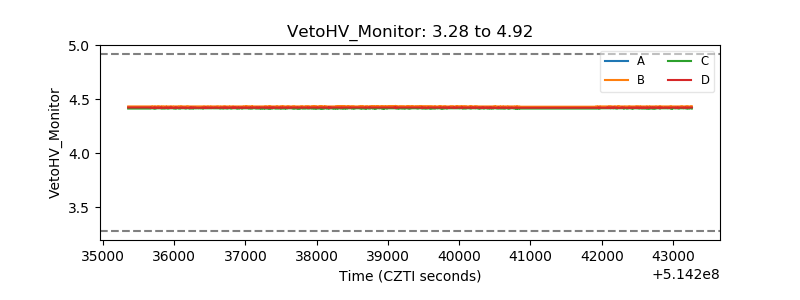 |
| Veto LLD | 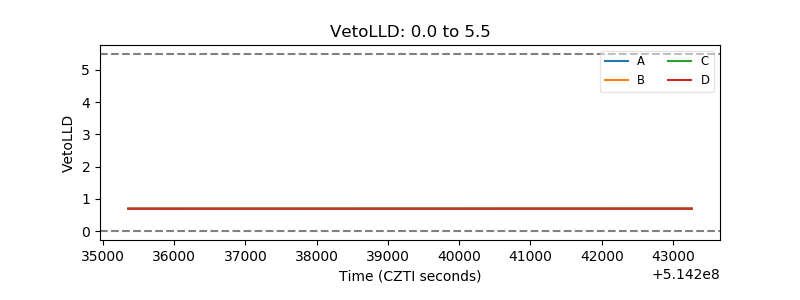 |
| Alpha Counter | 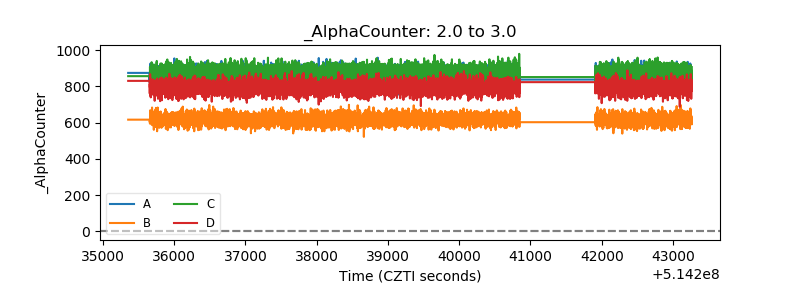 |
| _CPM_Rate | 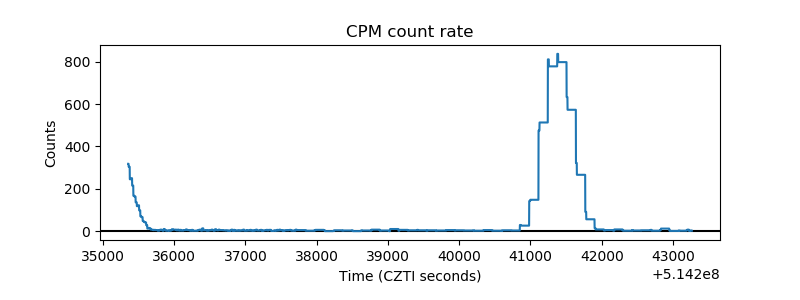 |
| CZT Counter | 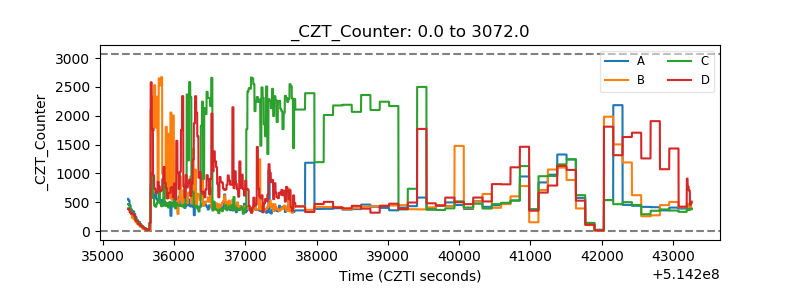 |
| +2.5 Volts monitor | 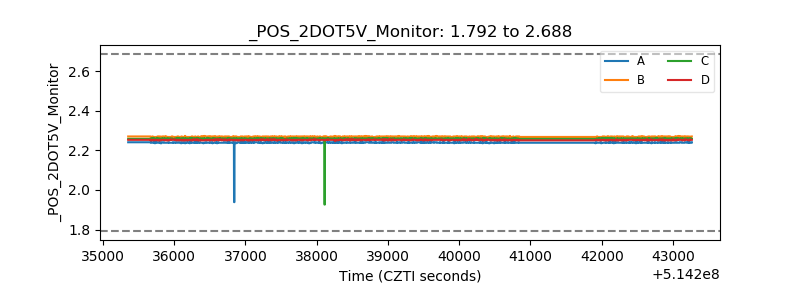 |
| +5 Volts monitor |  |
| _ROLL_ROT | 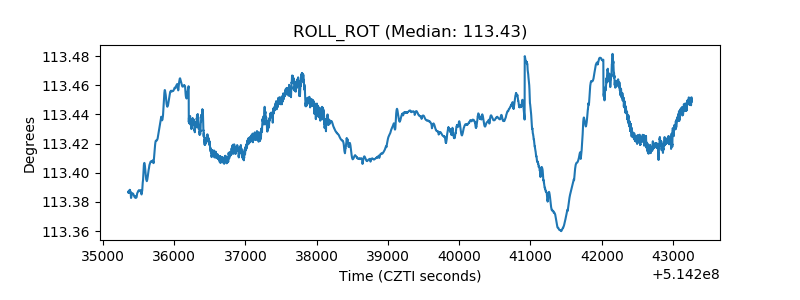 |
| _Roll_DEC | 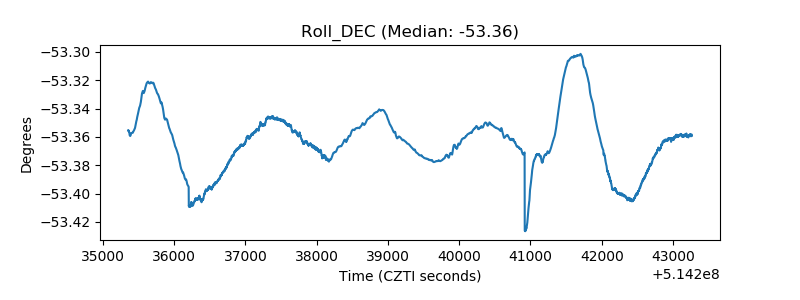 |
| _Roll_RA | 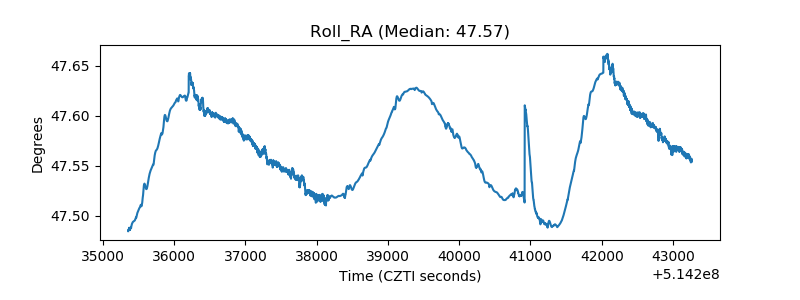 |
| Veto Counter | 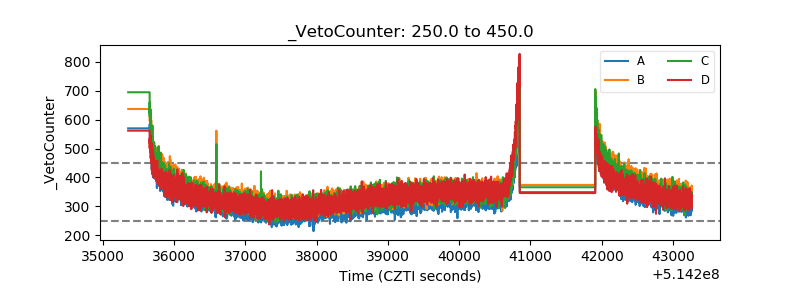 |