| Param | Original file | Final file |
|---|---|---|
| Filename | modeM0/AS1A14_083T10_9000006566_57116cztM0_level2.fits | modeM0/AS1A14_083T10_9000006566_57116cztM0_level2_quad_clean.evt |
| Size (bytes) | 492,811,200 | 91,823,040 |
| Size | 470.0 MB | 87.6 MB |
| Events in quadrant A | 3,096,787 | 632,793 |
| Events in quadrant B | 4,139,242 | 642,820 |
| Events in quadrant C | 4,745,847 | 516,277 |
| Events in quadrant D | 5,763,595 | 543,005 |
| Mode M9 | |||
|---|---|---|---|
| Quadrant | BADHDUFLAG | Total packets | Discarded packets |
| A | 0 | 18 | 0 |
| B | 0 | 19 | 0 |
| C | 0 | 19 | 0 |
| D | 0 | 19 | 0 |
| Mode M0 | |||
|---|---|---|---|
| Quadrant | BADHDUFLAG | Total packets | Discarded packets |
| A | 0 | 13937 | 3 |
| B | 0 | 16669 | 2 |
| C | 0 | 18725 | 2 |
| D | 0 | 21482 | 2 |
| Mode SS | |||
|---|---|---|---|
| Quadrant | BADHDUFLAG | Total packets | Discarded packets |
| A | 0 | 130 | 0 |
| B | 0 | 130 | 0 |
| C | 0 | 130 | 0 |
| D | 0 | 130 | 0 |
| Quadrant | Total seconds | Saturated seconds | Saturation percentage |
|---|---|---|---|
| A | 6387 | 144 | 2.254580% |
| B | 6387 | 471 | 7.374354% |
| C | 6387 | 1093 | 17.112886% |
| D | 6387 | 351 | 5.495538% |
Noise dominated data is calculated using 1-second bins in cleaned event files. If a bin has >2000 counts, and if more than 50% of those come from <1% of pixels, then it is considered to be noise-dominated and hence unusable.
| Quadrant | # 1 sec bins | Bins with >0 counts | Bins with >2000 counts | High rate bins dominated by noise | Noise dominated (total time) | Noise dominated (detector-on time) | Marked lightcurve |
|---|---|---|---|---|---|---|---|
| A | 7542 | 6388 | 77 | 77 | 1.02% | 1.21% | 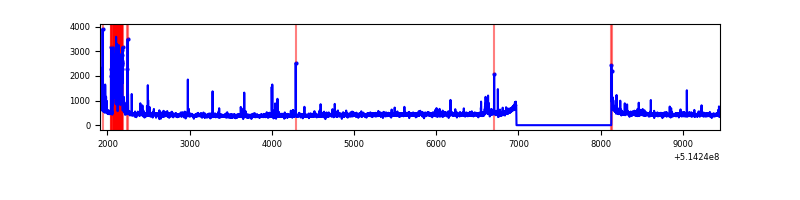 |
| B | 7542 | 6388 | 315 | 315 | 4.18% | 4.93% | 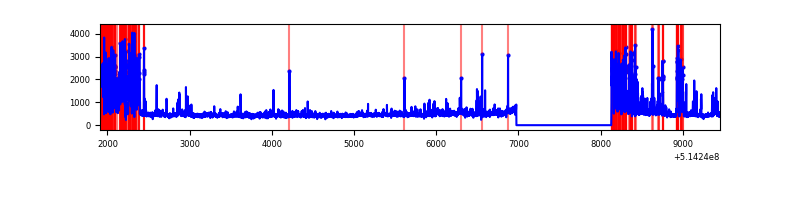 |
| C | 7542 | 6388 | 691 | 691 | 9.16% | 10.82% | 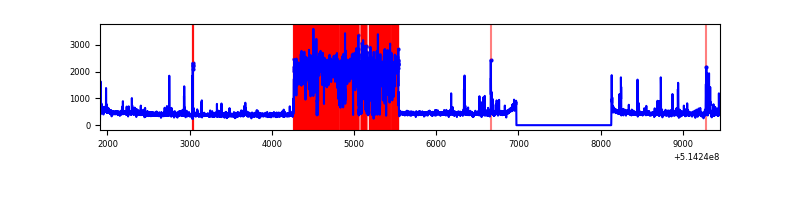 |
| D | 7542 | 6388 | 410 | 410 | 5.44% | 6.42% | 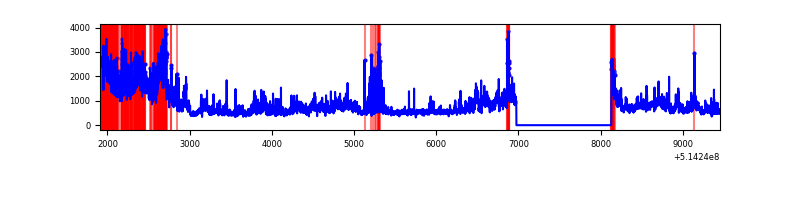 |
Top three noisy pixels from each quadrant. If the there are fewer than three noisy pixels in the level2.evt file, extra rows are filled as -1
| Pixel properties | Quadrant properties | ||||||
|---|---|---|---|---|---|---|---|
| Quadrant | DetID | PixID | Counts | Sigma | Mean | Median | Sigma |
| A | 13 | 248 | 250814 | 1442.5 | 700 | 684 | 173.4 |
| A | 10 | 251 | 69320 | 395.83 | 700 | 684 | 173.4 |
| A | 3 | 14 | 28912 | 162.79 | 700 | 684 | 173.4 |
| B | 10 | 16 | 1148191 | 8055.76 | 669 | 645 | 142.5 |
| B | 0 | 213 | 52373 | 363.13 | 669 | 645 | 142.5 |
| B | 0 | 199 | 45442 | 314.47 | 669 | 645 | 142.5 |
| C | 15 | 198 | 2120803 | 12594.76 | 612 | 608 | 168.3 |
| C | 14 | 254 | 78839 | 464.72 | 612 | 608 | 168.3 |
| C | 12 | 252 | 48739 | 285.91 | 612 | 608 | 168.3 |
| D | 15 | 142 | 2640265 | 14261.97 | 656 | 626 | 185.1 |
| D | 12 | 33 | 149228 | 802.9 | 656 | 626 | 185.1 |
| D | 8 | 160 | 106982 | 574.64 | 656 | 626 | 185.1 |
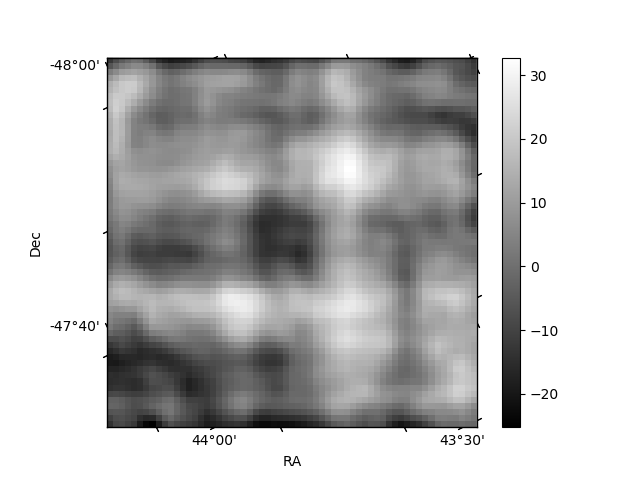
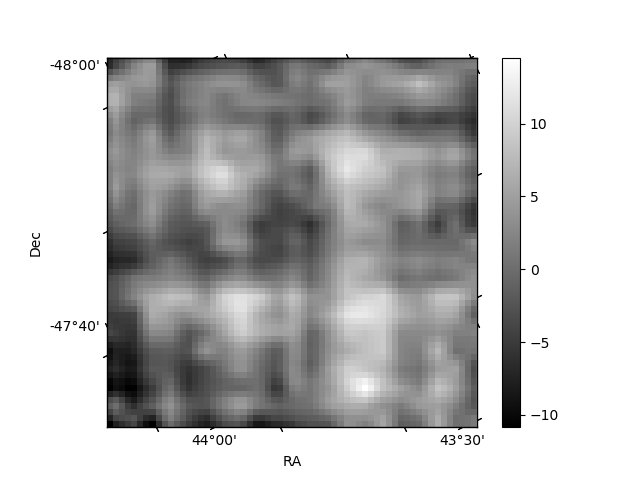
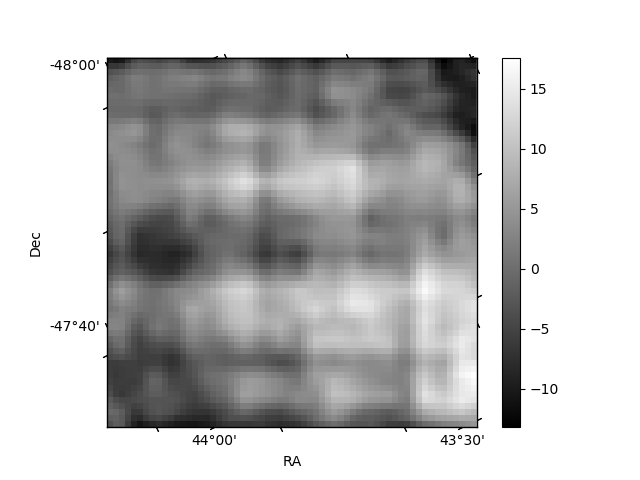
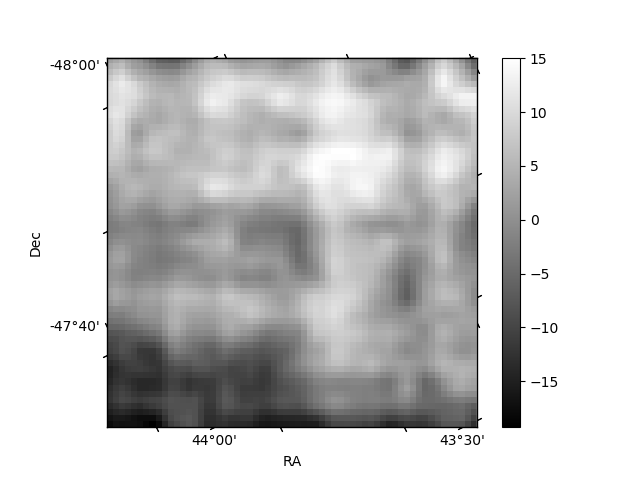
Histogram calculated using DETX and DETY for each event in the final _common_clean file
| Quadrant A | 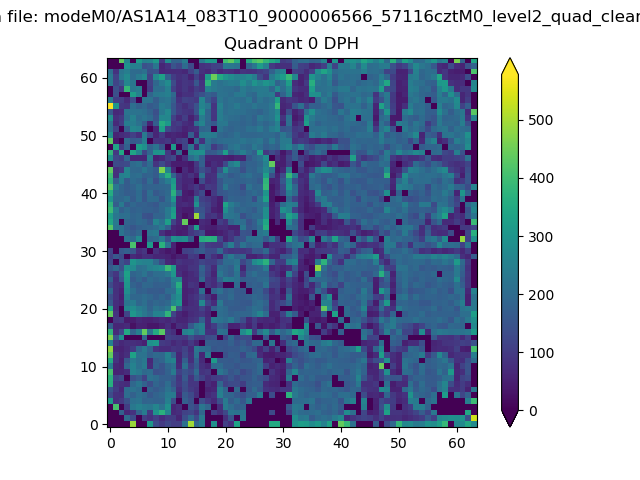 |
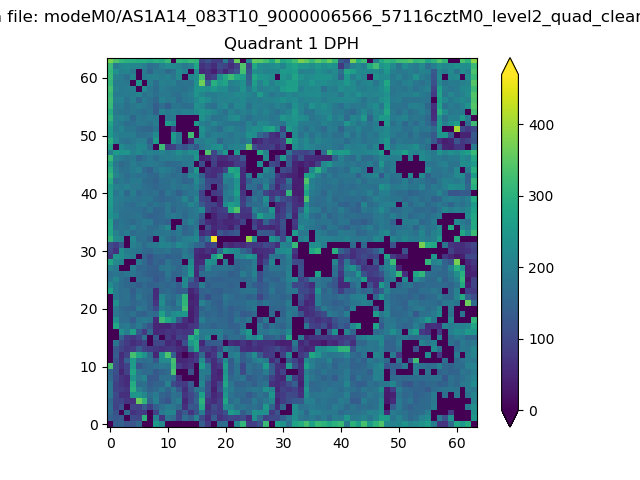 |
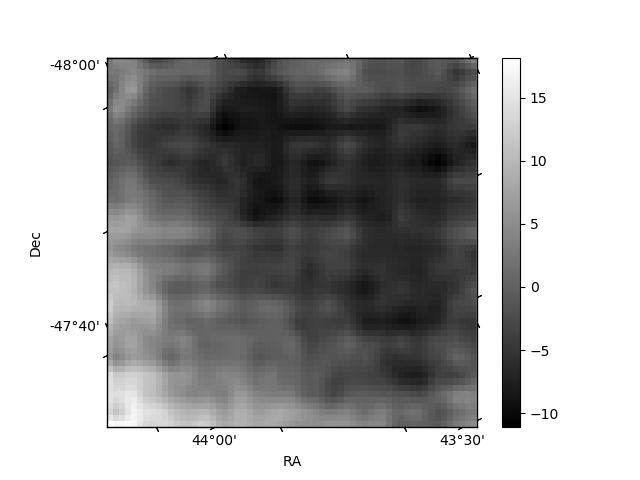
Quadrant B |
|---|---|---|---|
| Quadrant D | 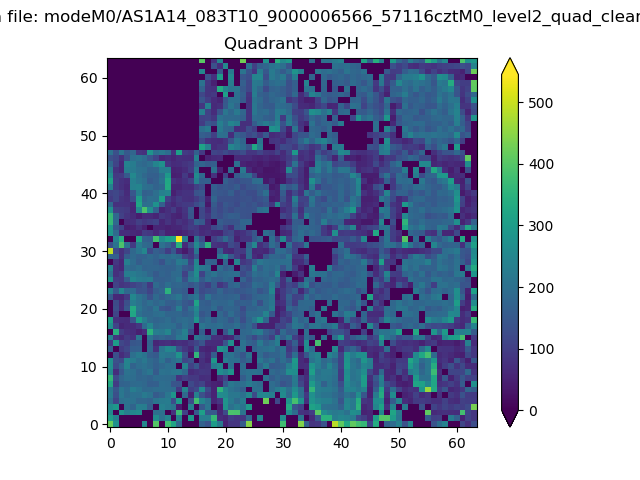 |
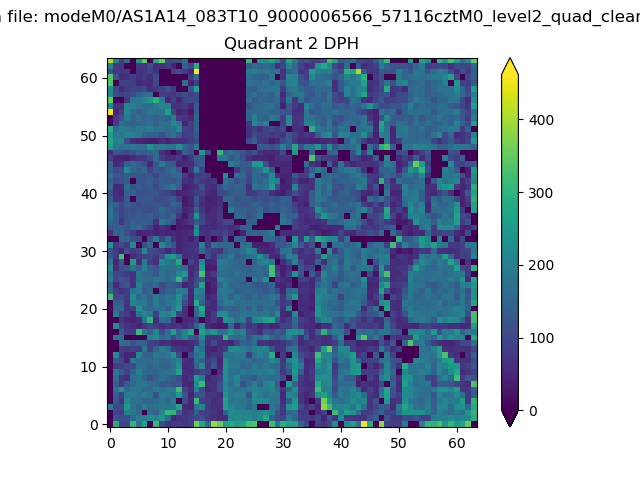 |
Quadrant C |
| Plot type | Count rate plots | Images |
|---|---|---|
| Comparison with Poisson distribution Blue bars denote a histogram of data divided into 1 sec bins. Red curve is a Poisson curve with rate = median count rate of data. |
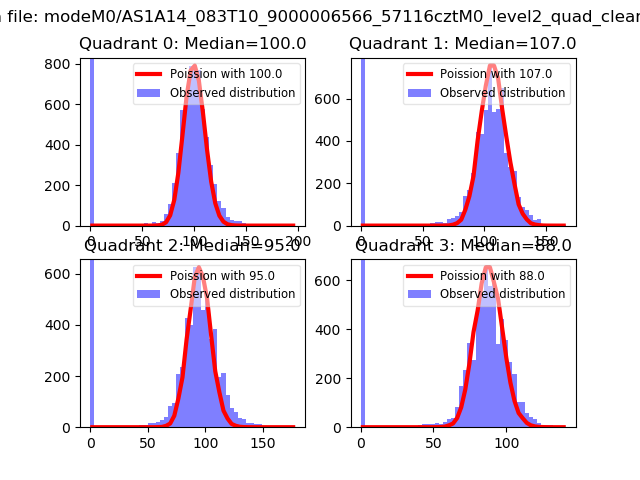 |
 |
| Quadrant-wise count rates Data is divided into 100 sec bins |
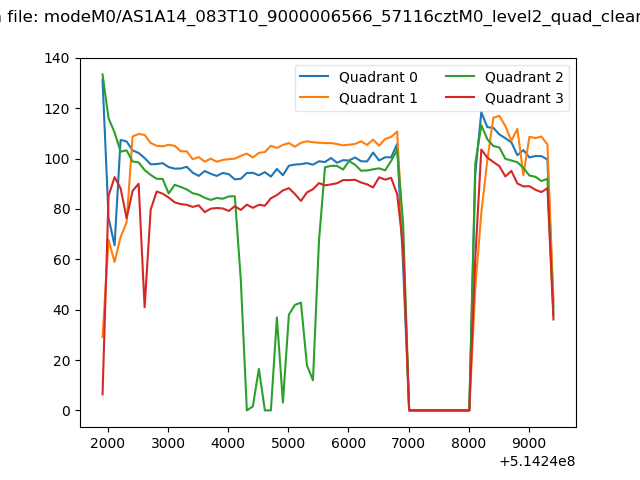 |
|
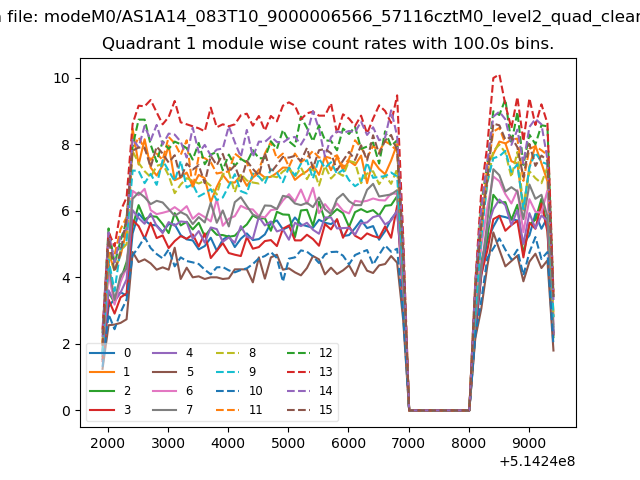
| Module-wise count rates for Quadrant A Data is divided into 100 sec bins |
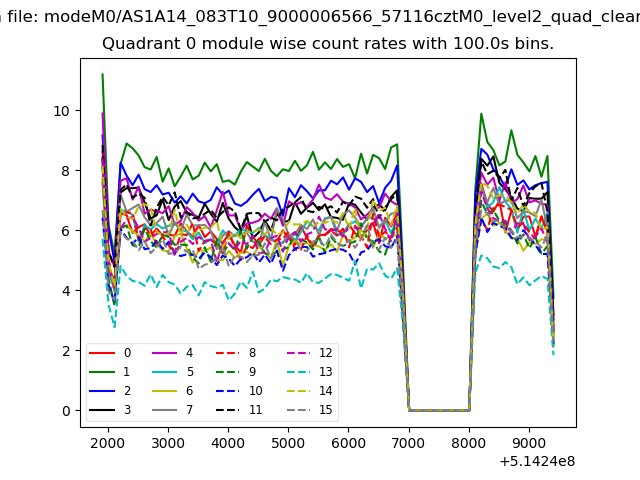 |
 |
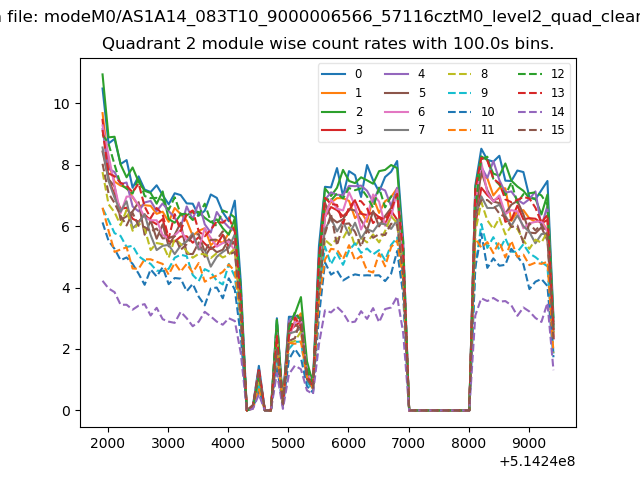
| Module-wise count rates for Quadrant B Data is divided into 100 sec bins |
 |
 |
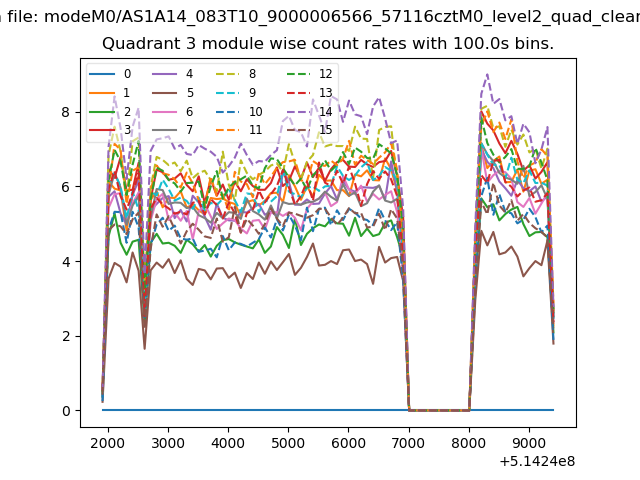
| Module-wise count rates for Quadrant C Data is divided into 100 sec bins |
 |
 |
| Module-wise count rates for Quadrant D Data is divided into 100 sec bins |
 |
 |
| Parameter | Plot |
|---|---|
| CZT HV Monitor | 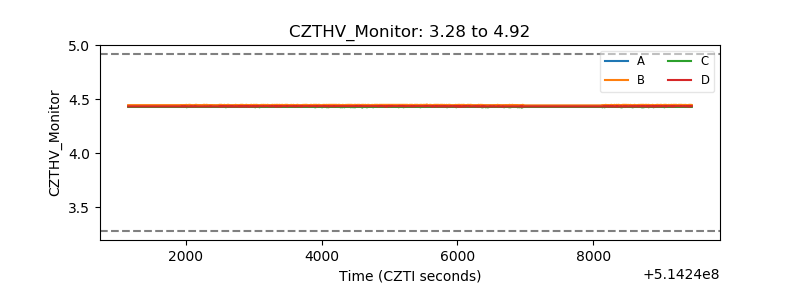 |
| D_VDD | 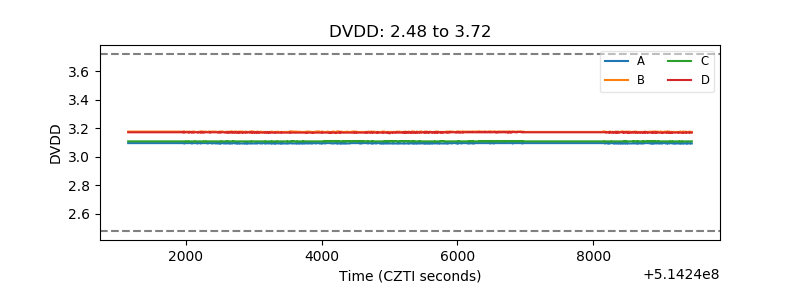 |
| Temperature 1 | 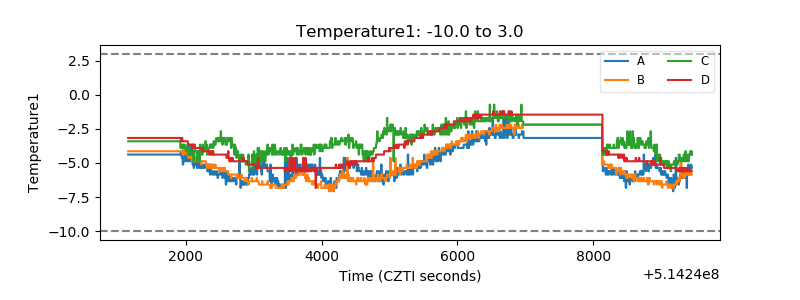 |
| Veto HV Monitor | 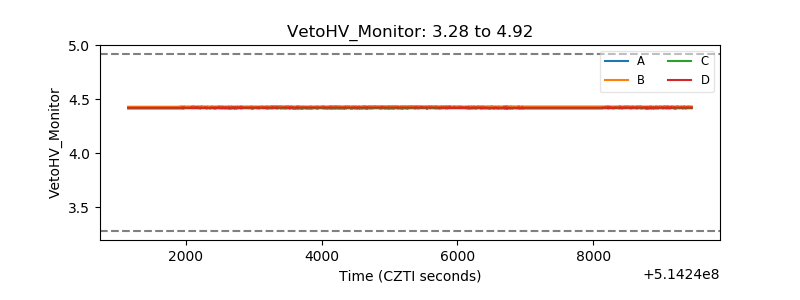 |
| Veto LLD | 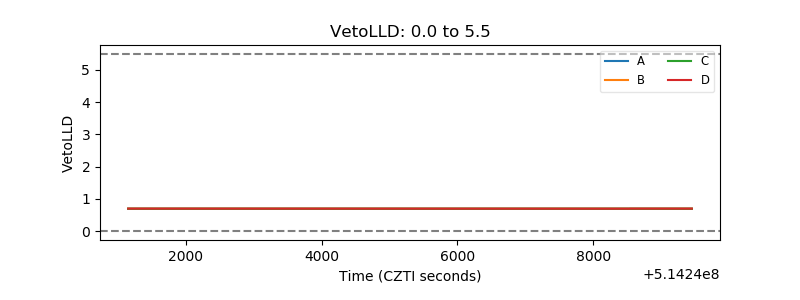 |
| Alpha Counter | 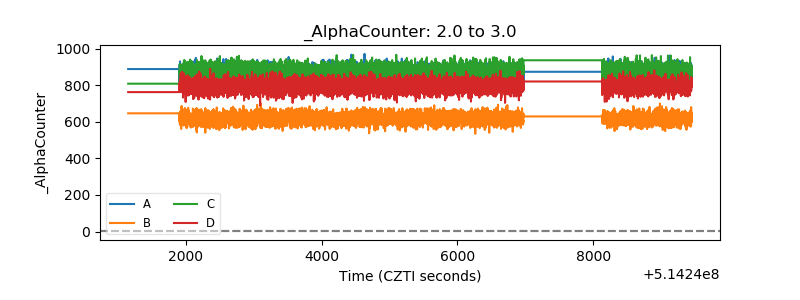 |
| _CPM_Rate | 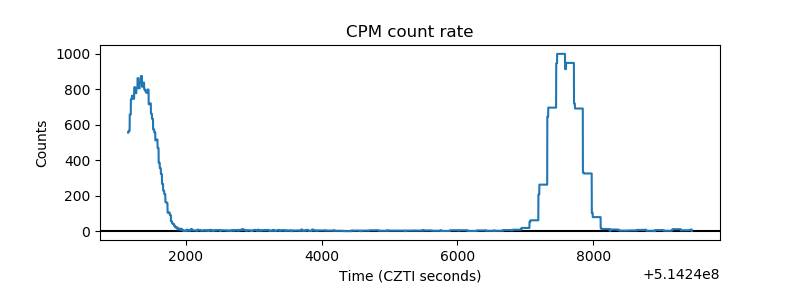 |
| CZT Counter | 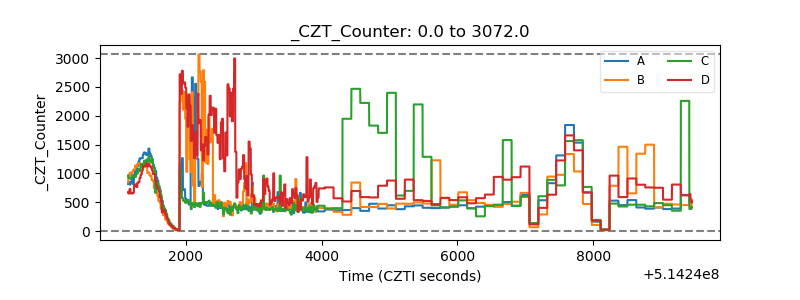 |
| +2.5 Volts monitor | 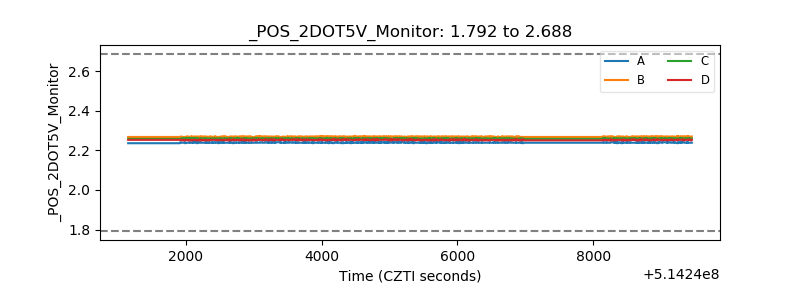 |
| +5 Volts monitor | 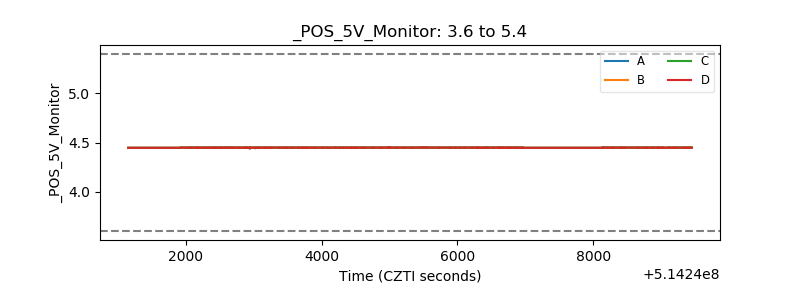 |
| _ROLL_ROT | 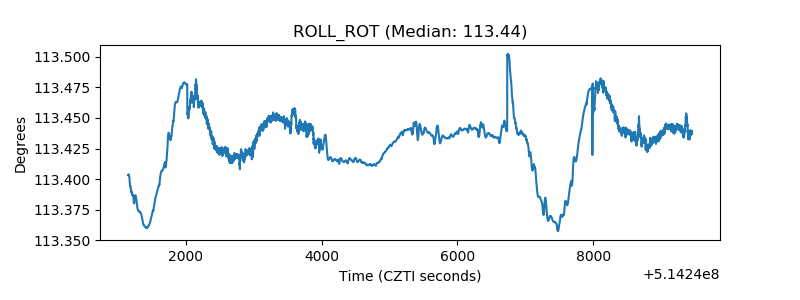 |
| _Roll_DEC | 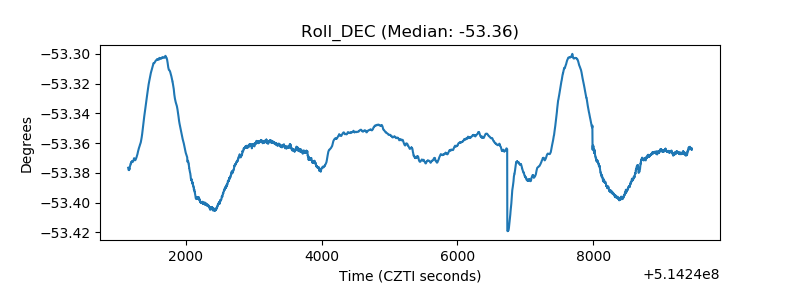 |
| _Roll_RA | 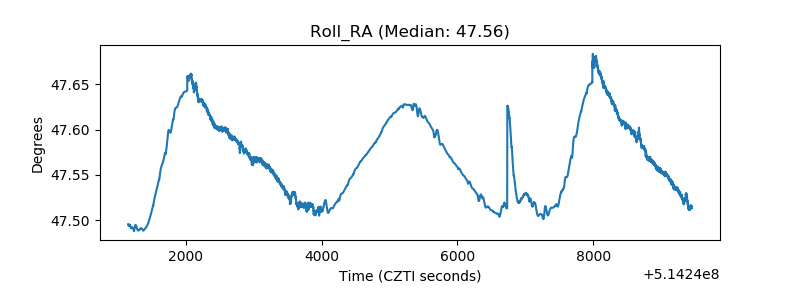 |
| Veto Counter | 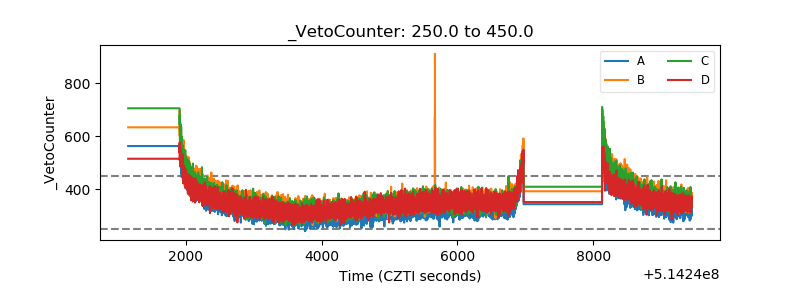 |