| Param | Original file | Final file |
|---|---|---|
| Filename | modeM0/AS1A14_083T10_9000006566_57119cztM0_level2.fits | modeM0/AS1A14_083T10_9000006566_57119cztM0_level2_quad_clean.evt |
| Size (bytes) | 568,169,280 | 91,275,840 |
| Size | 541.8 MB | 87.0 MB |
| Events in quadrant A | 3,101,663 | 654,607 |
| Events in quadrant B | 3,360,439 | 703,332 |
| Events in quadrant C | 7,136,731 | 425,243 |
| Events in quadrant D | 6,911,188 | 513,281 |
| Mode M9 | |||
|---|---|---|---|
| Quadrant | BADHDUFLAG | Total packets | Discarded packets |
| A | 0 | 15 | 0 |
| B | 0 | 16 | 0 |
| C | 0 | 16 | 0 |
| D | 0 | 16 | 0 |
| Mode M0 | |||
|---|---|---|---|
| Quadrant | BADHDUFLAG | Total packets | Discarded packets |
| A | 0 | 14184 | 2 |
| B | 0 | 14590 | 2 |
| C | 0 | 25863 | 2 |
| D | 0 | 25158 | 2 |
| Mode SS | |||
|---|---|---|---|
| Quadrant | BADHDUFLAG | Total packets | Discarded packets |
| A | 0 | 136 | 0 |
| B | 0 | 136 | 0 |
| C | 0 | 136 | 0 |
| D | 0 | 136 | 0 |
| Quadrant | Total seconds | Saturated seconds | Saturation percentage |
|---|---|---|---|
| A | 6706 | 89 | 1.327170% |
| B | 6706 | 137 | 2.042947% |
| C | 6706 | 2252 | 33.581867% |
| D | 6705 | 926 | 13.810589% |
Noise dominated data is calculated using 1-second bins in cleaned event files. If a bin has >2000 counts, and if more than 50% of those come from <1% of pixels, then it is considered to be noise-dominated and hence unusable.
| Quadrant | # 1 sec bins | Bins with >0 counts | Bins with >2000 counts | High rate bins dominated by noise | Noise dominated (total time) | Noise dominated (detector-on time) | Marked lightcurve |
|---|---|---|---|---|---|---|---|
| A | 7731 | 6706 | 24 | 24 | 0.31% | 0.36% | 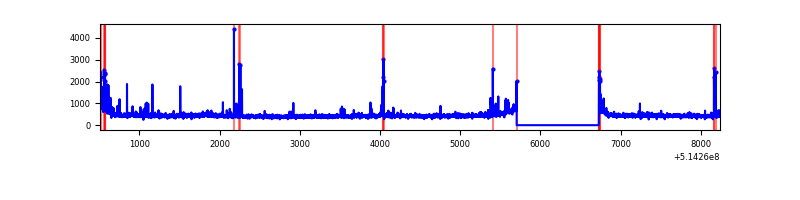 |
| B | 7731 | 6707 | 23 | 23 | 0.30% | 0.34% | 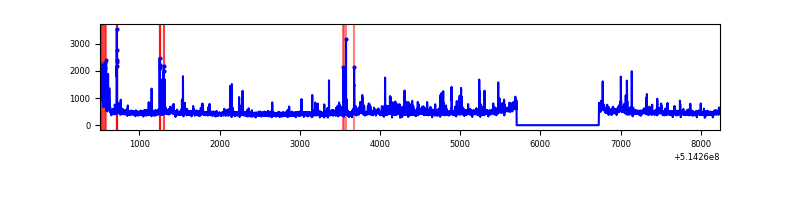 |
| C | 7731 | 6707 | 1789 | 1789 | 23.14% | 26.67% | 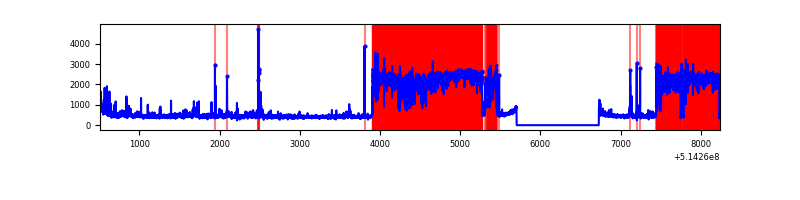 |
| D | 7730 | 6706 | 928 | 928 | 12.01% | 13.84% | 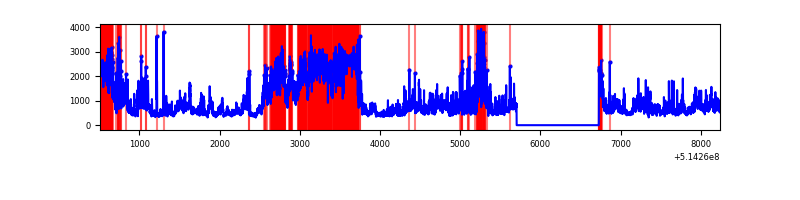 |
Top three noisy pixels from each quadrant. If the there are fewer than three noisy pixels in the level2.evt file, extra rows are filled as -1
| Pixel properties | Quadrant properties | ||||||
|---|---|---|---|---|---|---|---|
| Quadrant | DetID | PixID | Counts | Sigma | Mean | Median | Sigma |
| A | 10 | 251 | 119465 | 659.6 | 735 | 716 | 180.0 |
| A | 3 | 14 | 96621 | 532.71 | 735 | 716 | 180.0 |
| A | 8 | 28 | 14849 | 78.5 | 735 | 716 | 180.0 |
| B | 10 | 16 | 90650 | 573.15 | 730 | 701 | 156.9 |
| B | 10 | 247 | 81375 | 514.05 | 730 | 701 | 156.9 |
| B | 4 | 171 | 68375 | 431.21 | 730 | 701 | 156.9 |
| C | 15 | 198 | 4609688 | 29982.42 | 571 | 566 | 153.7 |
| C | 13 | 3 | 58057 | 373.98 | 571 | 566 | 153.7 |
| C | 12 | 252 | 57314 | 369.15 | 571 | 566 | 153.7 |
| D | 15 | 142 | 3336739 | 17479.82 | 677 | 648 | 190.9 |
| D | 12 | 33 | 305597 | 1597.81 | 677 | 648 | 190.9 |
| D | 2 | 249 | 154294 | 805.05 | 677 | 648 | 190.9 |
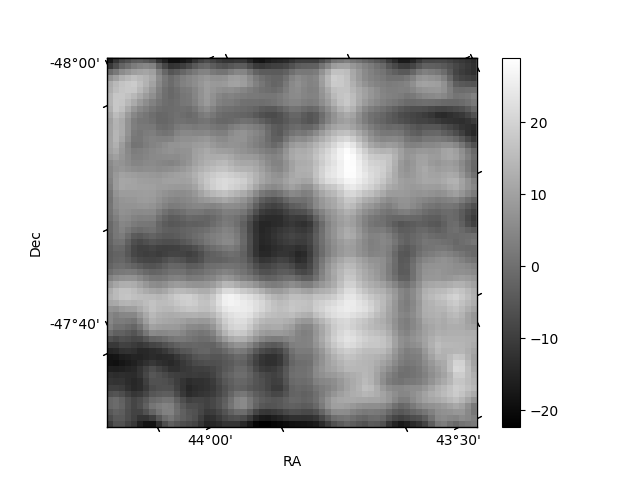
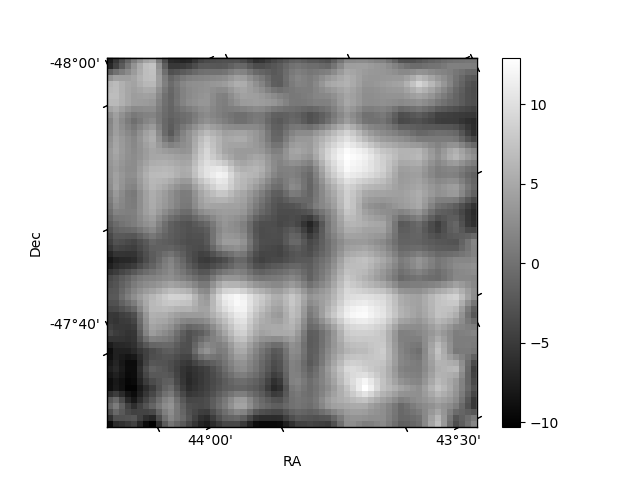
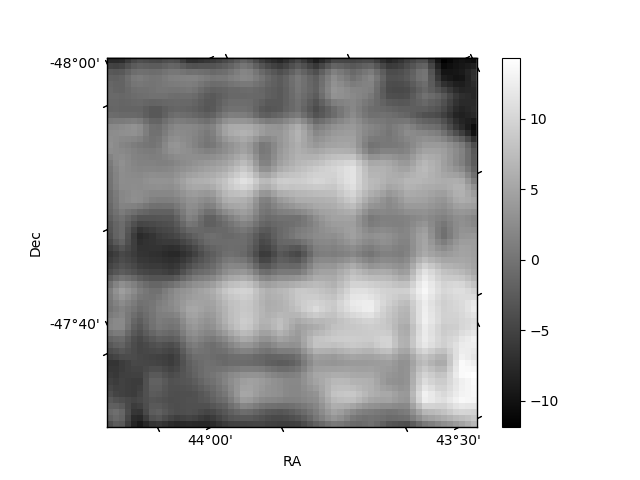
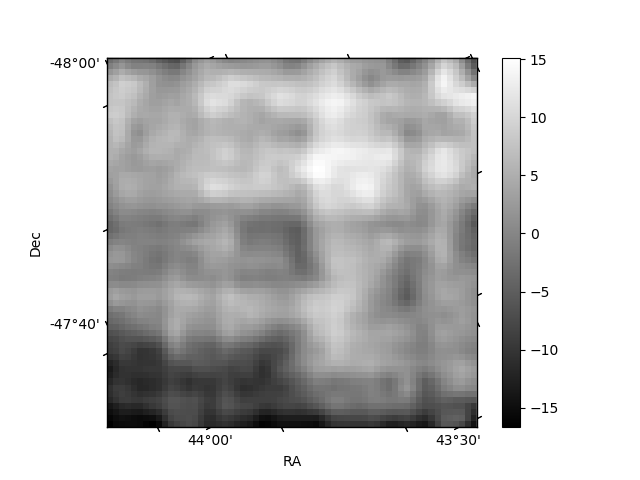
Histogram calculated using DETX and DETY for each event in the final _common_clean file
| Quadrant A | 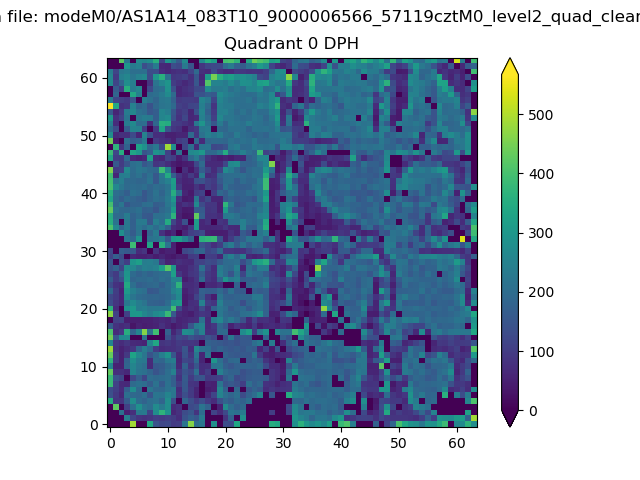 |
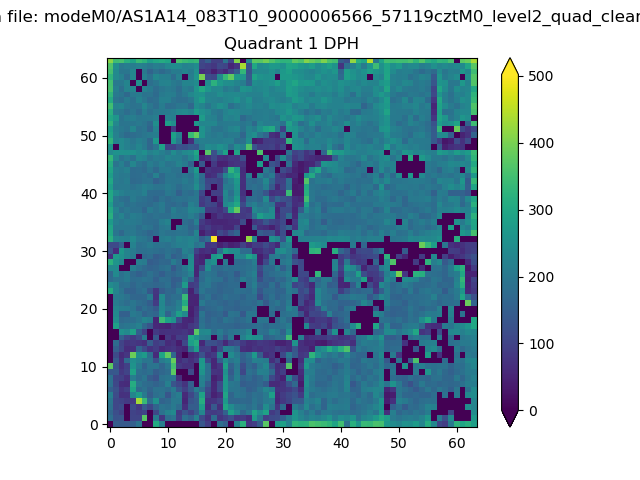 |
Quadrant B |
|---|---|---|---|
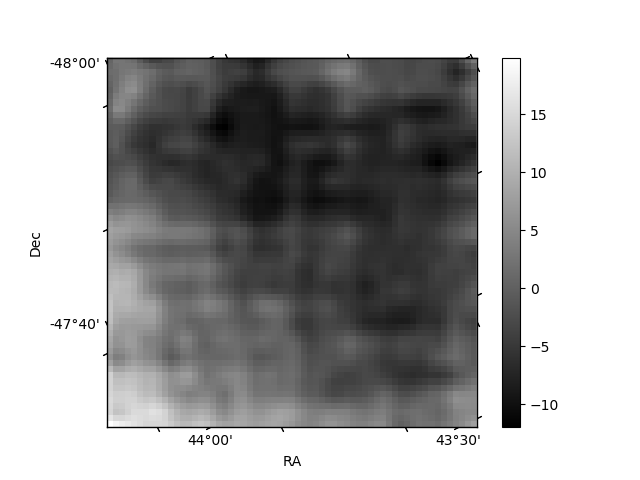
| Quadrant D | 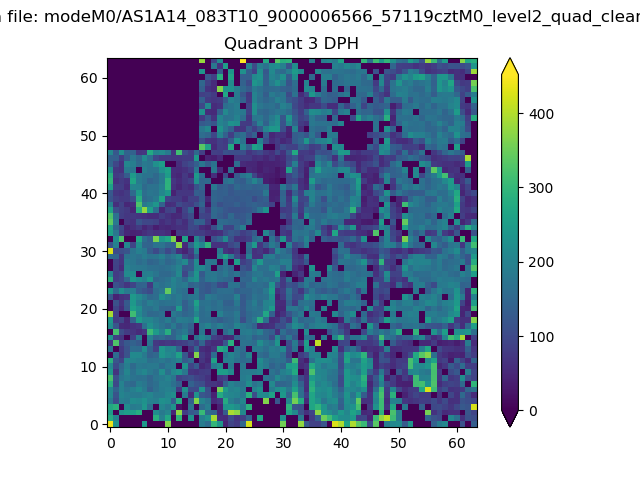 |
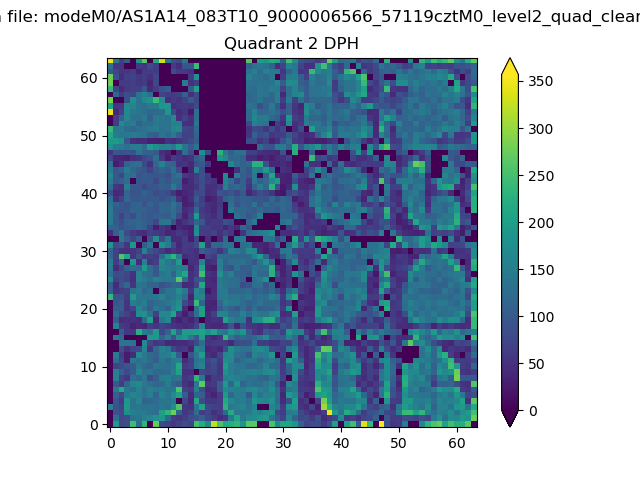 |
Quadrant C |
| Plot type | Count rate plots | Images |
|---|---|---|
| Comparison with Poisson distribution Blue bars denote a histogram of data divided into 1 sec bins. Red curve is a Poisson curve with rate = median count rate of data. |
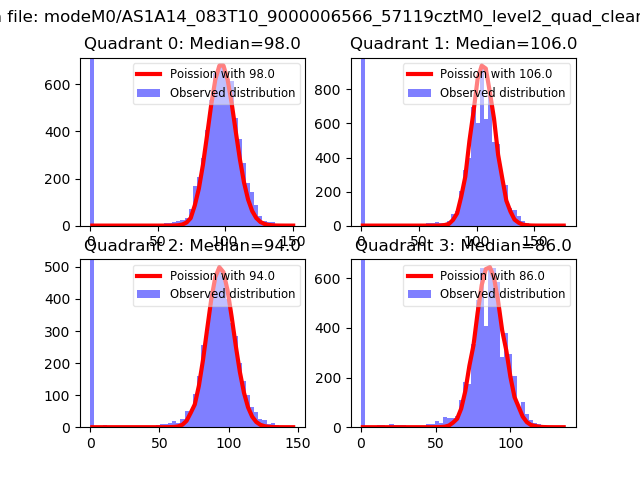 |
 |
| Quadrant-wise count rates Data is divided into 100 sec bins |
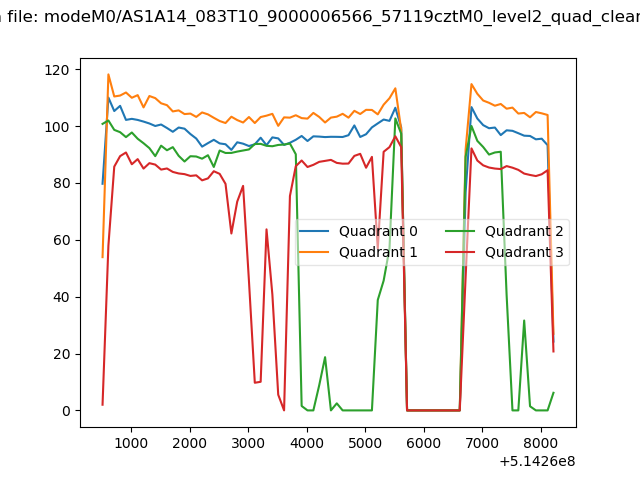 |
|
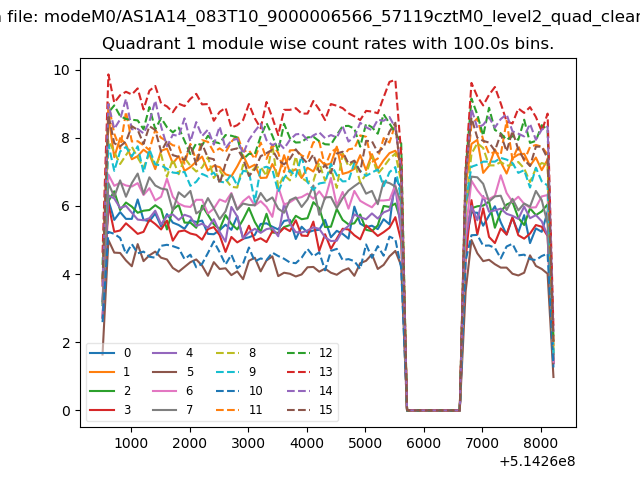
| Module-wise count rates for Quadrant A Data is divided into 100 sec bins |
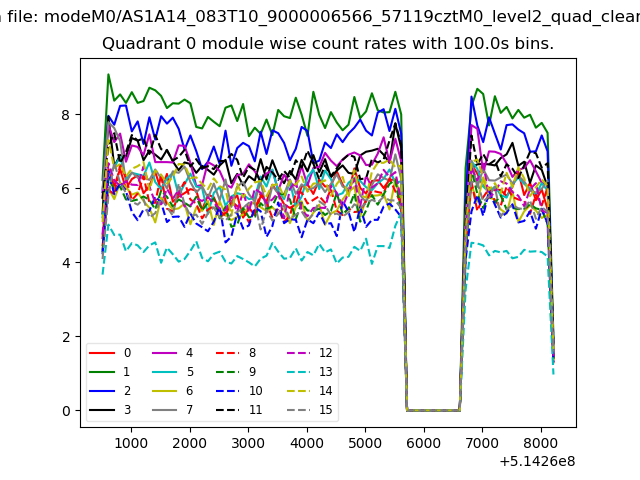 |
 |
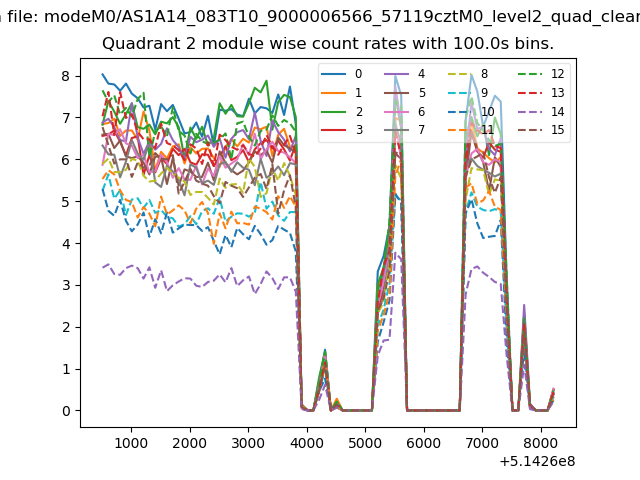
| Module-wise count rates for Quadrant B Data is divided into 100 sec bins |
 |
 |
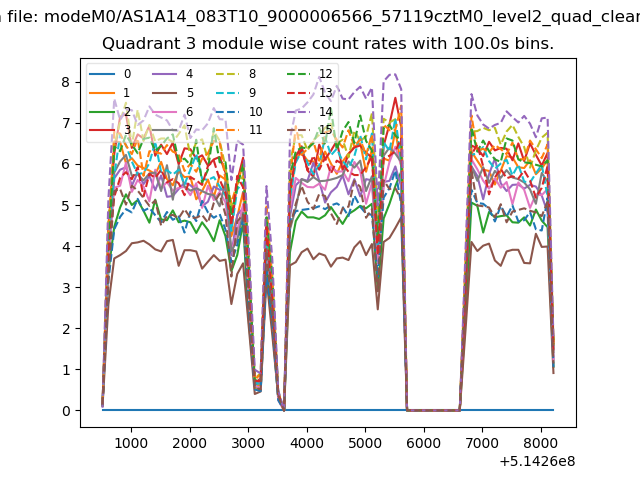
| Module-wise count rates for Quadrant C Data is divided into 100 sec bins |
 |
 |
| Module-wise count rates for Quadrant D Data is divided into 100 sec bins |
 |
 |
| Parameter | Plot |
|---|---|
| CZT HV Monitor | 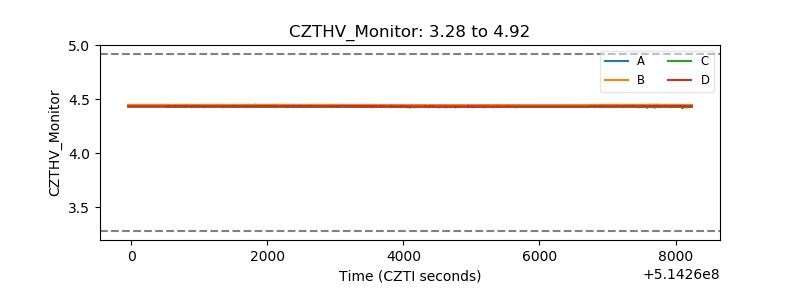 |
| D_VDD | 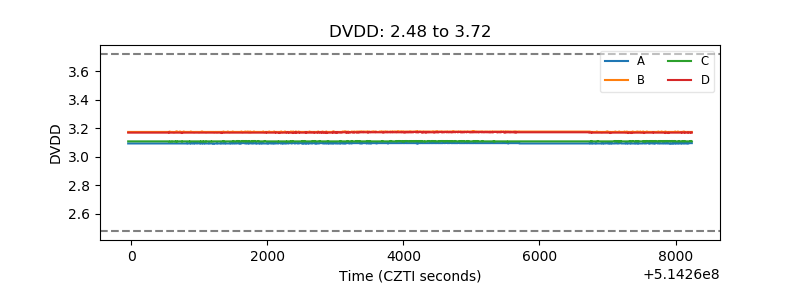 |
| Temperature 1 | 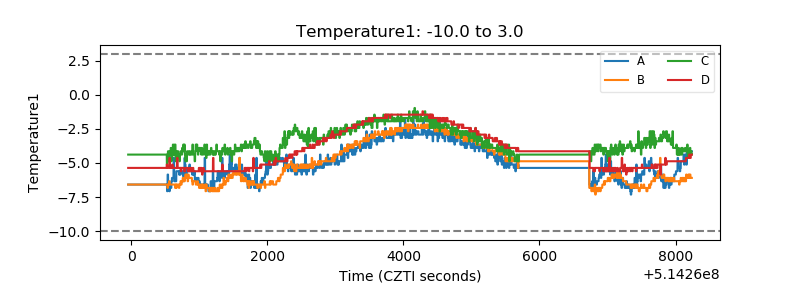 |
| Veto HV Monitor | 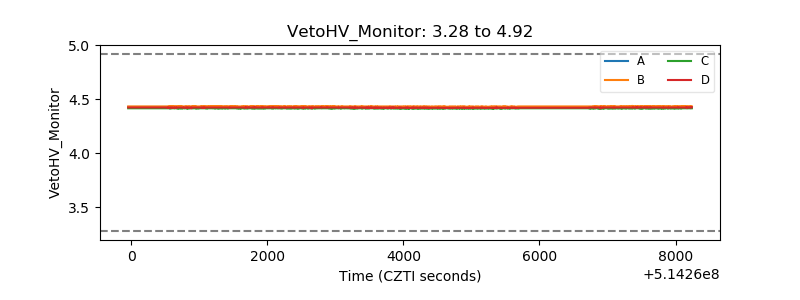 |
| Veto LLD | 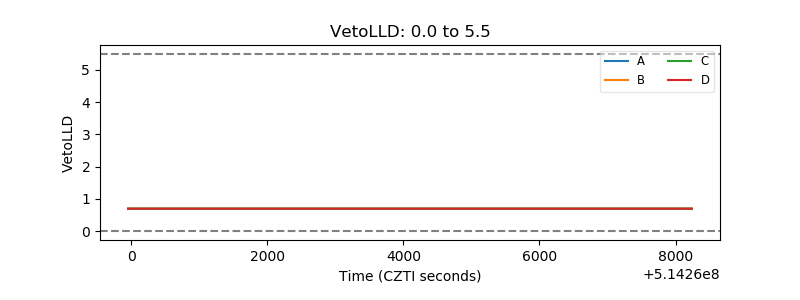 |
| Alpha Counter | 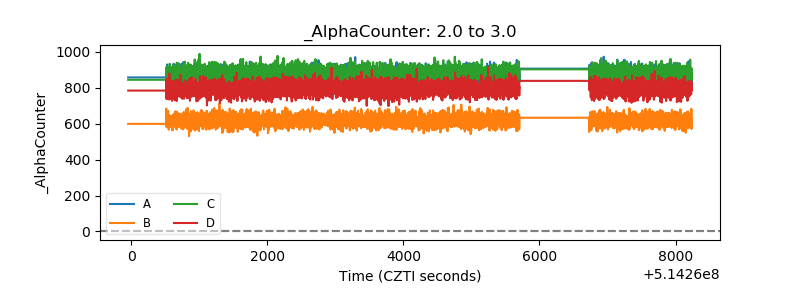 |
| _CPM_Rate | 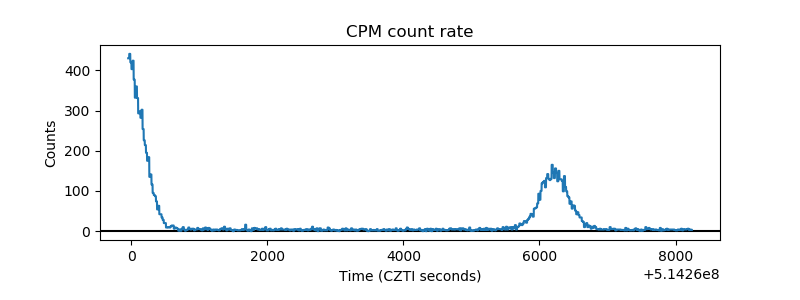 |
| CZT Counter | 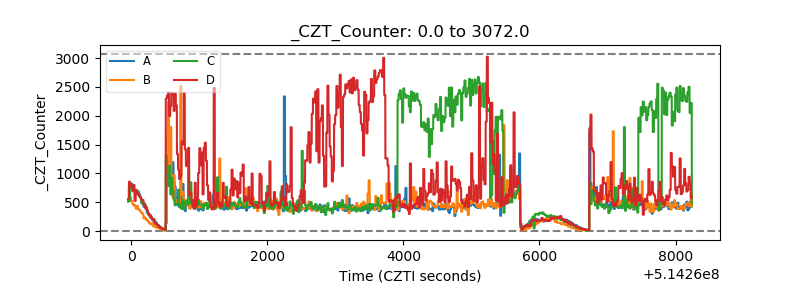 |
| +2.5 Volts monitor | 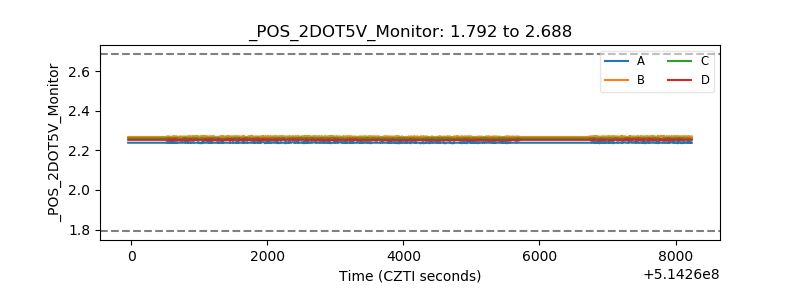 |
| +5 Volts monitor | 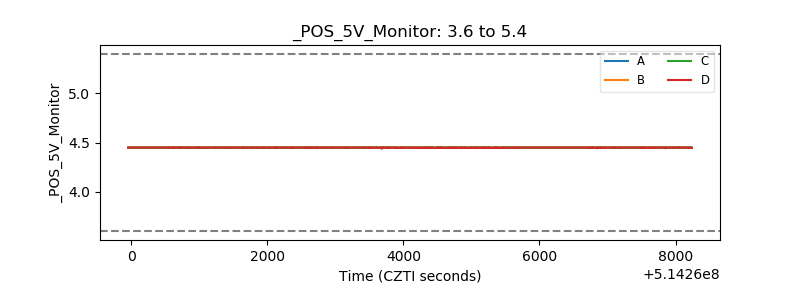 |
| _ROLL_ROT | 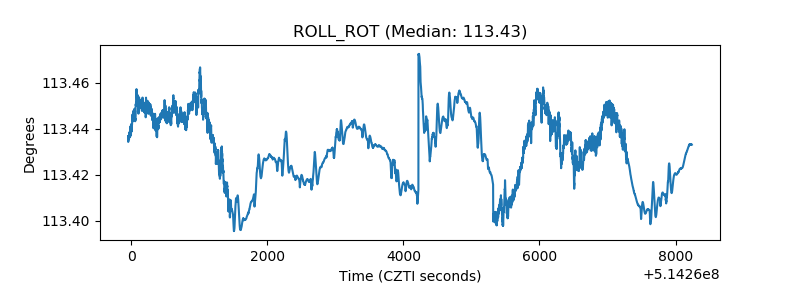 |
| _Roll_DEC | 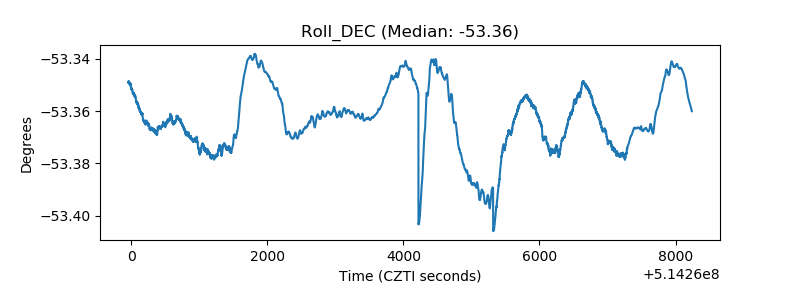 |
| _Roll_RA | 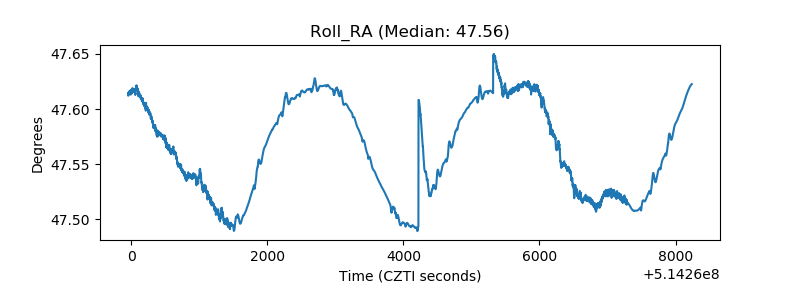 |
| Veto Counter | 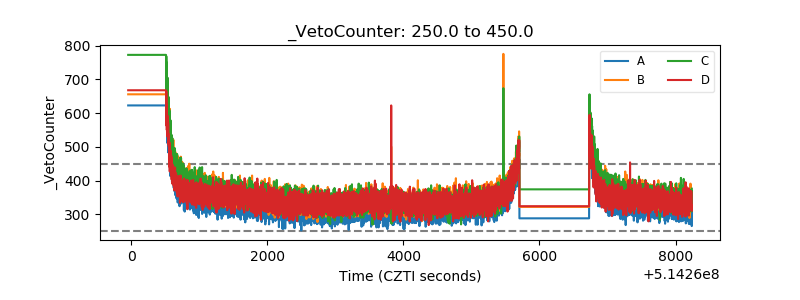 |