| Param | Original file | Final file |
|---|---|---|
| Filename | modeM0/AS1A14_083T10_9000006566_57120cztM0_level2.fits | modeM0/AS1A14_083T10_9000006566_57120cztM0_level2_quad_clean.evt |
| Size (bytes) | 557,398,080 | 86,872,320 |
| Size | 531.6 MB | 82.8 MB |
| Events in quadrant A | 2,990,590 | 615,904 |
| Events in quadrant B | 3,165,285 | 651,841 |
| Events in quadrant C | 6,589,387 | 428,282 |
| Events in quadrant D | 7,387,670 | 485,750 |
| Mode M9 | |||
|---|---|---|---|
| Quadrant | BADHDUFLAG | Total packets | Discarded packets |
| A | 0 | 6 | 0 |
| B | 0 | 6 | 0 |
| C | 0 | 6 | 0 |
| D | 0 | 6 | 0 |
| Mode M0 | |||
|---|---|---|---|
| Quadrant | BADHDUFLAG | Total packets | Discarded packets |
| A | 0 | 13682 | 1 |
| B | 0 | 13884 | 1 |
| C | 0 | 24094 | 1 |
| D | 0 | 26423 | 3 |
| Mode SS | |||
|---|---|---|---|
| Quadrant | BADHDUFLAG | Total packets | Discarded packets |
| A | 0 | 130 | 0 |
| B | 0 | 130 | 0 |
| C | 0 | 130 | 0 |
| D | 0 | 130 | 0 |
| Quadrant | Total seconds | Saturated seconds | Saturation percentage |
|---|---|---|---|
| A | 6430 | 125 | 1.944012% |
| B | 6431 | 210 | 3.265433% |
| C | 6431 | 1957 | 30.430726% |
| D | 6430 | 967 | 15.038880% |
Noise dominated data is calculated using 1-second bins in cleaned event files. If a bin has >2000 counts, and if more than 50% of those come from <1% of pixels, then it is considered to be noise-dominated and hence unusable.
| Quadrant | # 1 sec bins | Bins with >0 counts | Bins with >2000 counts | High rate bins dominated by noise | Noise dominated (total time) | Noise dominated (detector-on time) | Marked lightcurve |
|---|---|---|---|---|---|---|---|
| A | 6985 | 6431 | 19 | 19 | 0.27% | 0.30% | 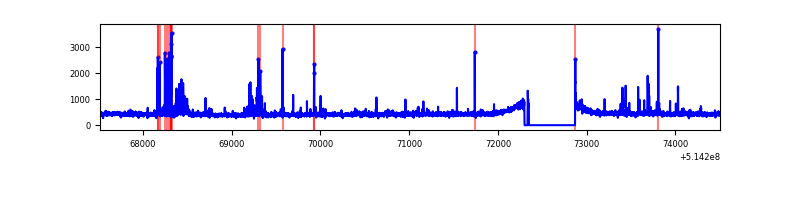 |
| B | 6986 | 6431 | 19 | 19 | 0.27% | 0.30% | 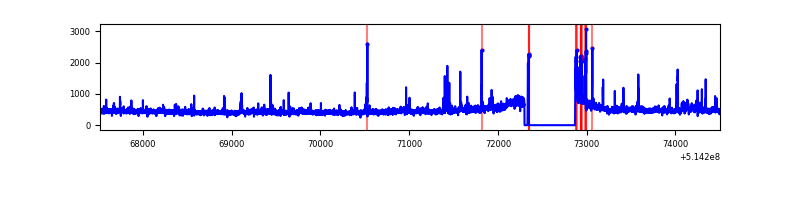 |
| C | 6986 | 6432 | 1420 | 1420 | 20.33% | 22.08% | 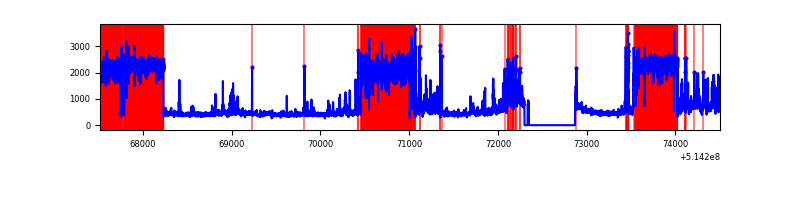 |
| D | 6985 | 6430 | 922 | 922 | 13.20% | 14.34% | 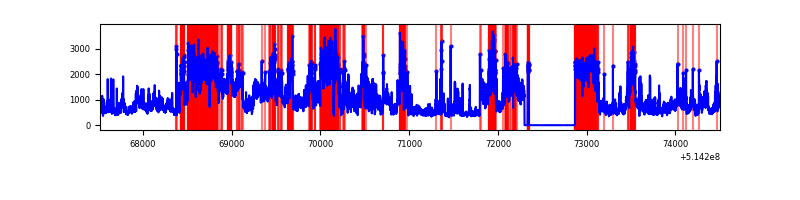 |
Top three noisy pixels from each quadrant. If the there are fewer than three noisy pixels in the level2.evt file, extra rows are filled as -1
| Pixel properties | Quadrant properties | ||||||
|---|---|---|---|---|---|---|---|
| Quadrant | DetID | PixID | Counts | Sigma | Mean | Median | Sigma |
| A | 10 | 251 | 138042 | 790.53 | 707 | 689 | 173.7 |
| A | 8 | 6 | 34984 | 197.38 | 707 | 689 | 173.7 |
| A | 3 | 14 | 33948 | 191.42 | 707 | 689 | 173.7 |
| B | 0 | 171 | 133489 | 907.08 | 691 | 664 | 146.4 |
| B | 10 | 16 | 97876 | 663.87 | 691 | 664 | 146.4 |
| B | 10 | 247 | 38001 | 254.98 | 691 | 664 | 146.4 |
| C | 15 | 198 | 3500500 | 22976.8 | 560 | 555 | 152.3 |
| C | 12 | 252 | 374220 | 2453.07 | 560 | 555 | 152.3 |
| C | 1 | 16 | 166326 | 1088.27 | 560 | 555 | 152.3 |
| D | 15 | 142 | 4188206 | 22701.96 | 652 | 618 | 184.5 |
| D | 12 | 33 | 160646 | 867.55 | 652 | 618 | 184.5 |
| D | 8 | 240 | 94294 | 507.84 | 652 | 618 | 184.5 |
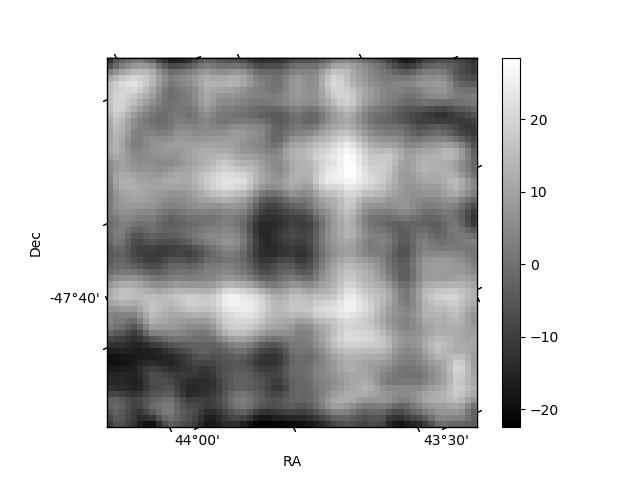
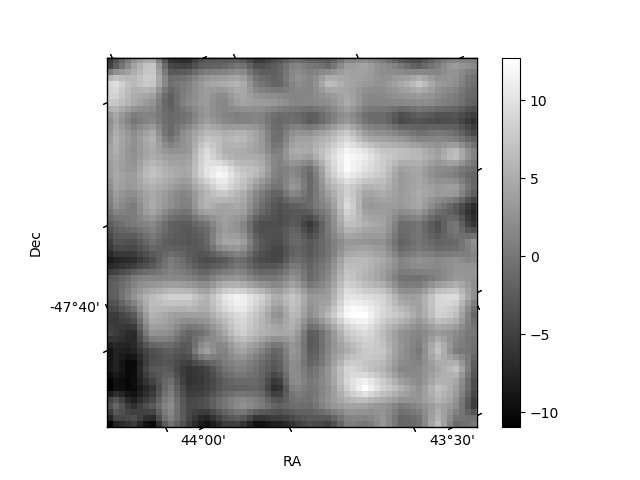
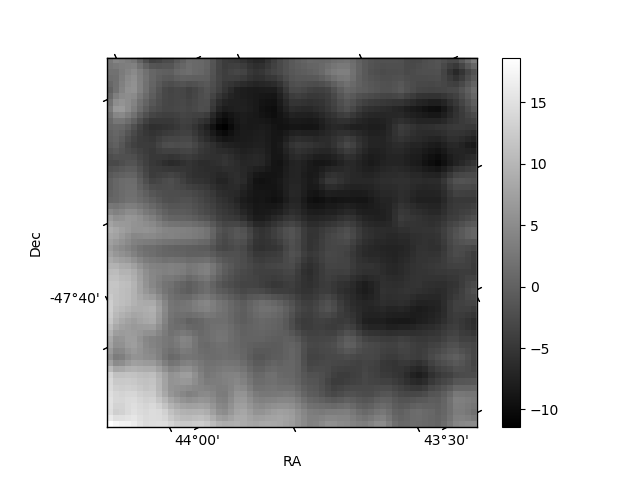
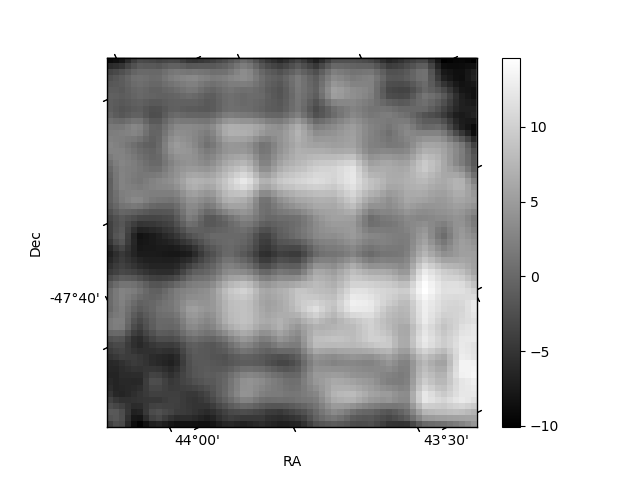
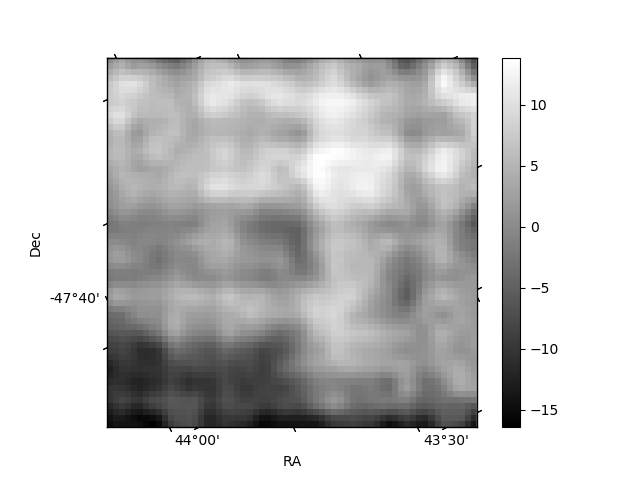
Histogram calculated using DETX and DETY for each event in the final _common_clean file
| Quadrant A | 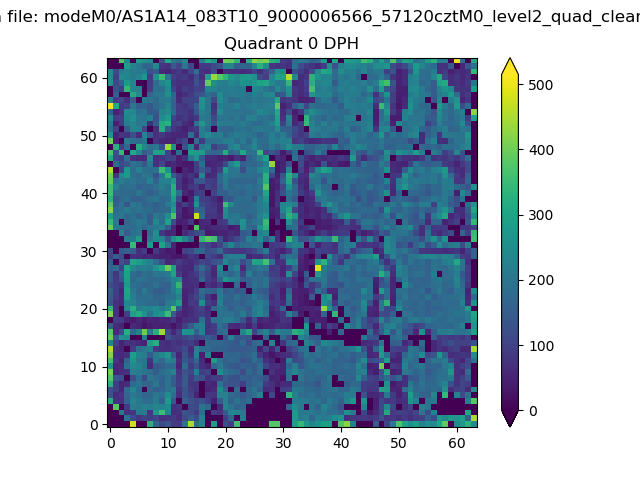 |
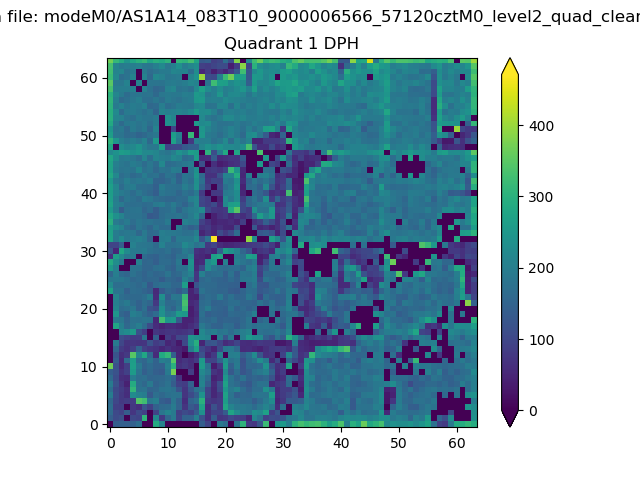 |
Quadrant B |
|---|---|---|---|
| Quadrant D | 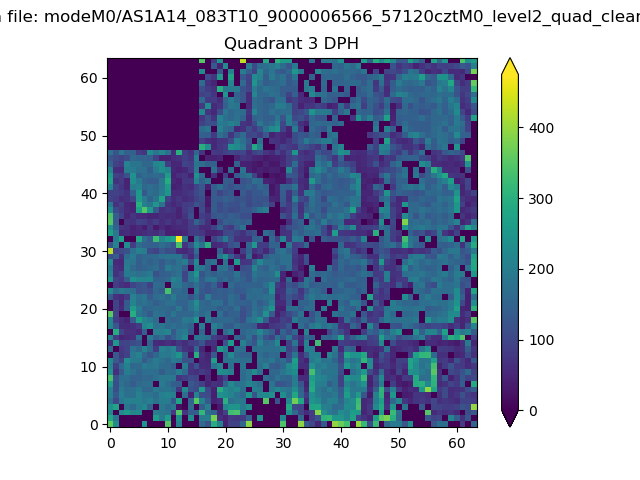 |
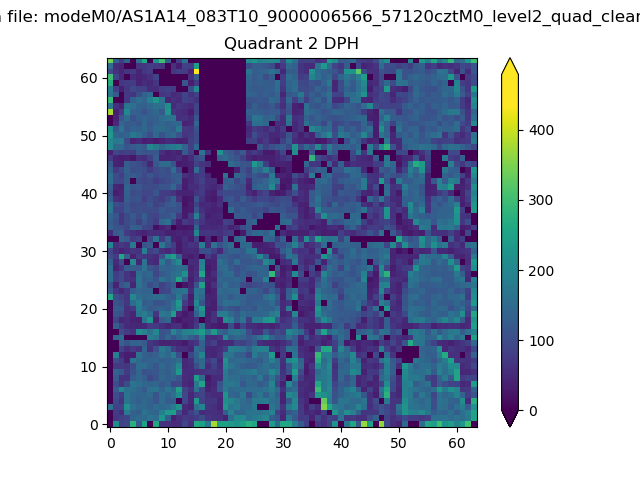 |
Quadrant C |
| Plot type | Count rate plots | Images |
|---|---|---|
| Comparison with Poisson distribution Blue bars denote a histogram of data divided into 1 sec bins. Red curve is a Poisson curve with rate = median count rate of data. |
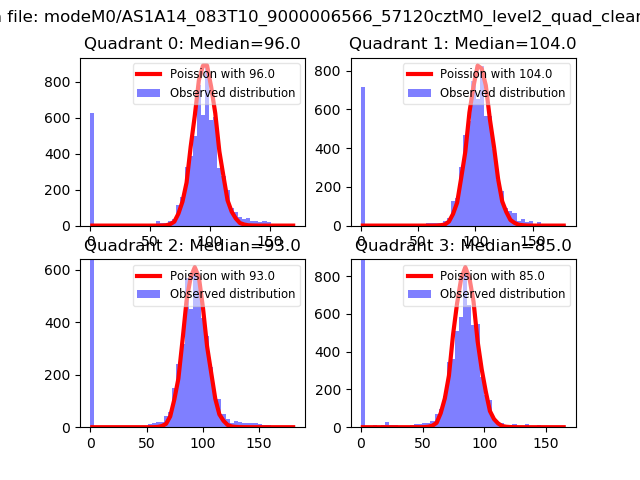 |
 |
| Quadrant-wise count rates Data is divided into 100 sec bins |
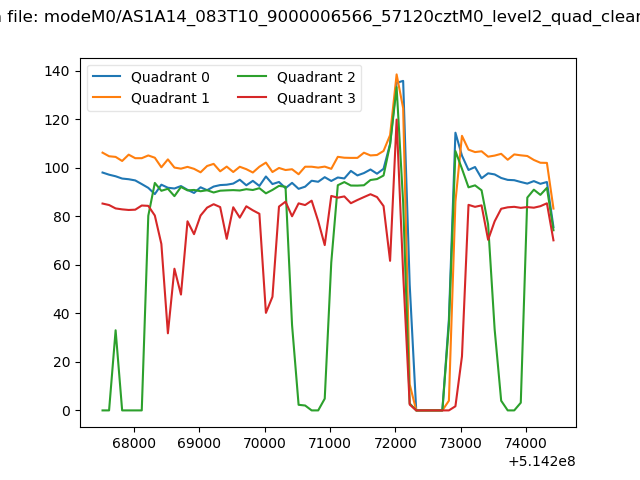 |
|
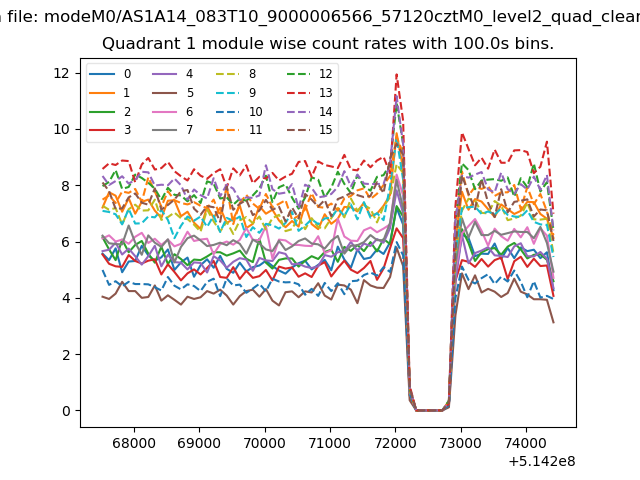
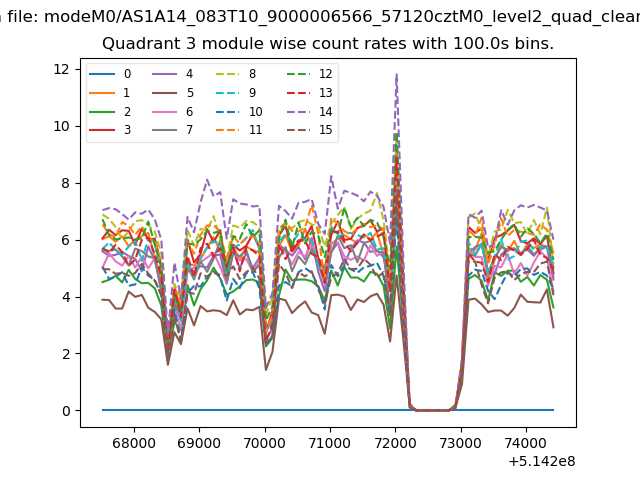
| Module-wise count rates for Quadrant A Data is divided into 100 sec bins |
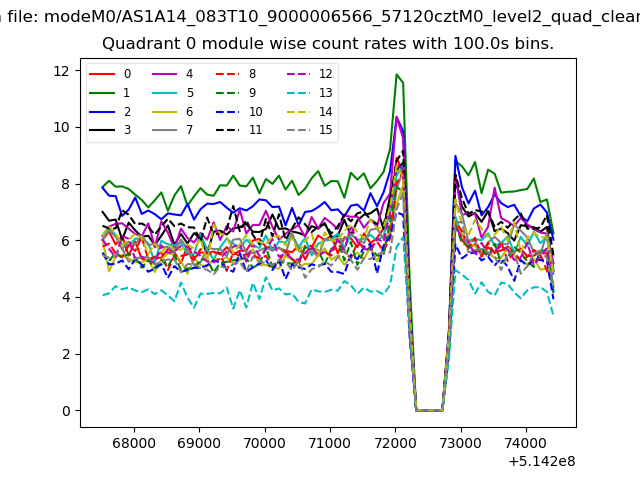 |
 |
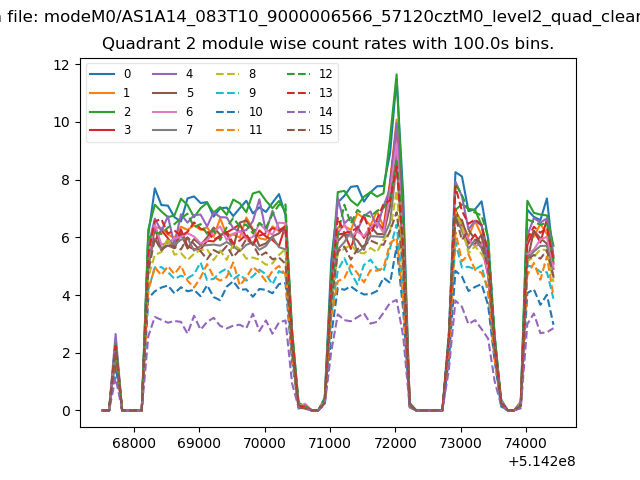
| Module-wise count rates for Quadrant B Data is divided into 100 sec bins |
 |
 |
| Module-wise count rates for Quadrant C Data is divided into 100 sec bins |
 |
 |
| Module-wise count rates for Quadrant D Data is divided into 100 sec bins |
 |
 |
| Parameter | Plot |
|---|---|
| CZT HV Monitor | 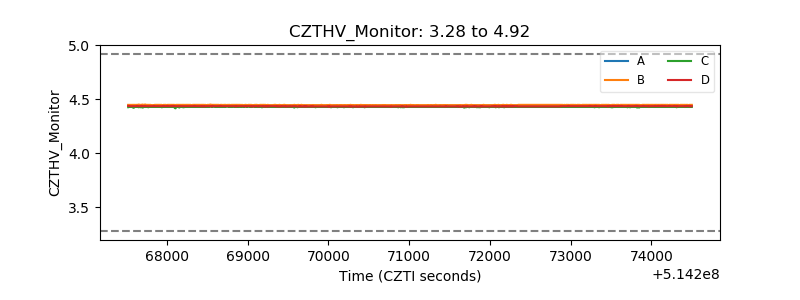 |
| D_VDD | 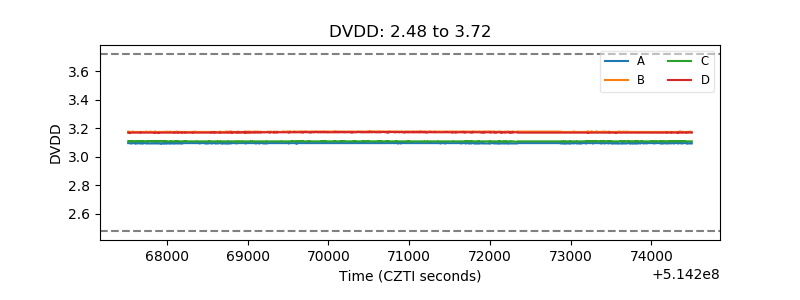 |
| Temperature 1 | 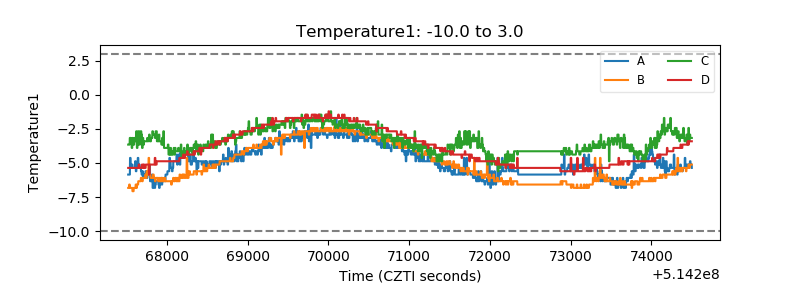 |
| Veto HV Monitor | 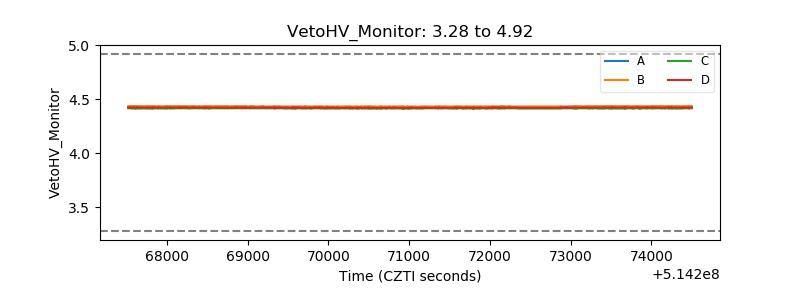 |
| Veto LLD | 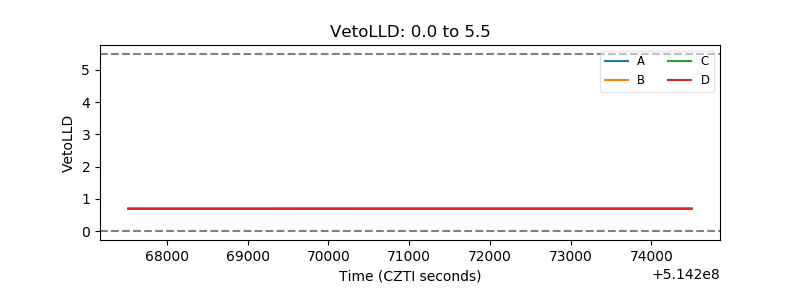 |
| Alpha Counter | 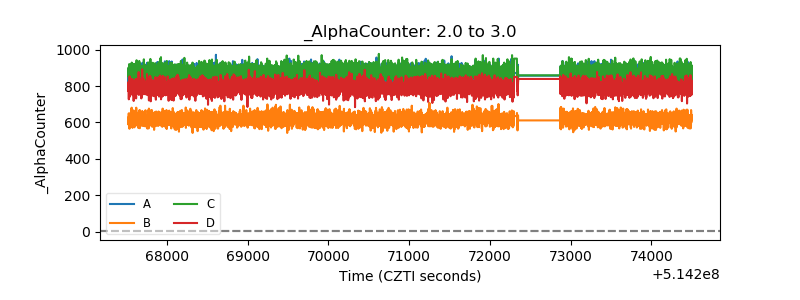 |
| _CPM_Rate | 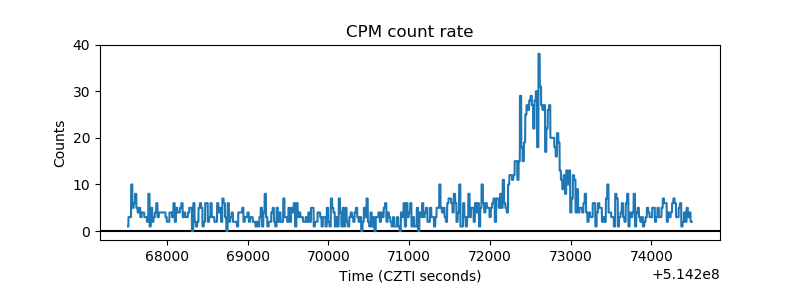 |
| CZT Counter | 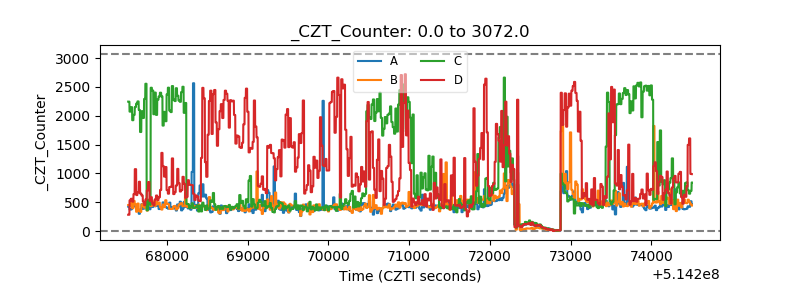 |
| +2.5 Volts monitor | 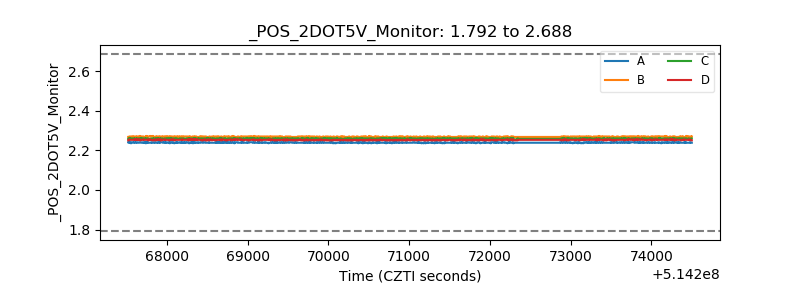 |
| +5 Volts monitor | 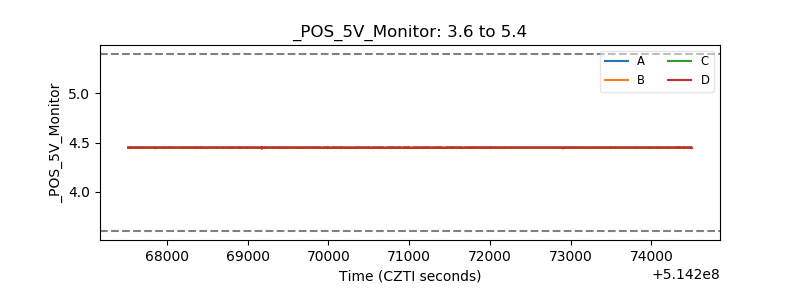 |
| _ROLL_ROT | 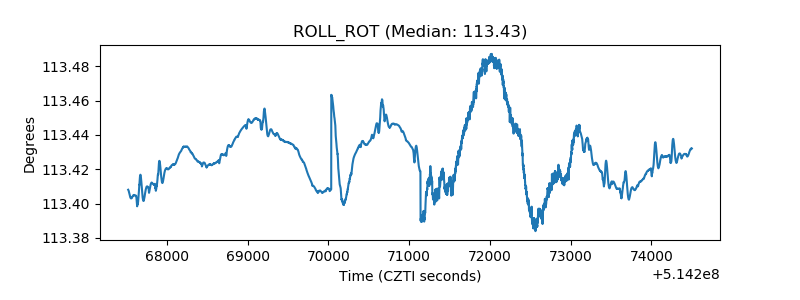 |
| _Roll_DEC | 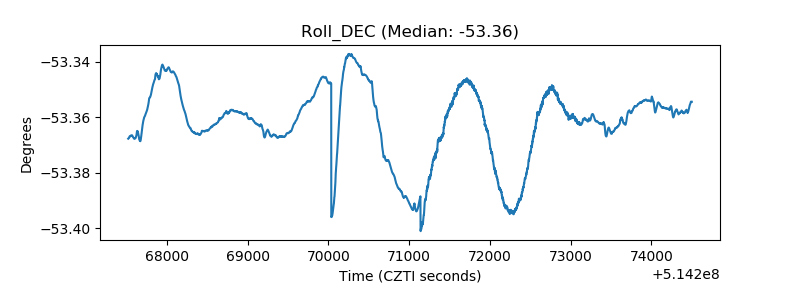 |
| _Roll_RA | 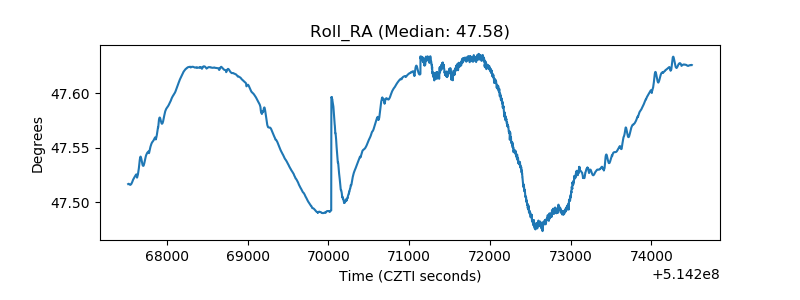 |
| Veto Counter | 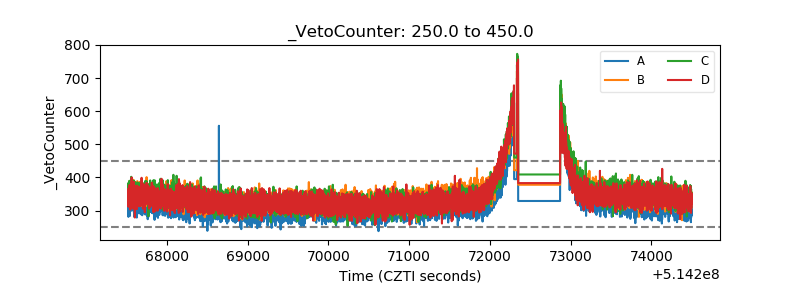 |