| Param | Original file | Final file |
|---|---|---|
| Filename | modeM0/AS1A14_083T10_9000006566_57121cztM0_level2.fits | modeM0/AS1A14_083T10_9000006566_57121cztM0_level2_quad_clean.evt |
| Size (bytes) | 652,714,560 | 102,493,440 |
| Size | 622.5 MB | 97.7 MB |
| Events in quadrant A | 4,017,453 | 719,588 |
| Events in quadrant B | 3,720,639 | 779,925 |
| Events in quadrant C | 8,690,593 | 452,512 |
| Events in quadrant D | 7,142,783 | 622,748 |
| Mode M0 | |||
|---|---|---|---|
| Quadrant | BADHDUFLAG | Total packets | Discarded packets |
| A | 0 | 17487 | 0 |
| B | 0 | 16397 | 0 |
| C | 0 | 30973 | 0 |
| D | 0 | 26421 | 0 |
| Mode SS | |||
|---|---|---|---|
| Quadrant | BADHDUFLAG | Total packets | Discarded packets |
| A | 0 | 152 | 0 |
| B | 0 | 152 | 0 |
| C | 0 | 152 | 0 |
| D | 0 | 152 | 0 |
| Quadrant | Total seconds | Saturated seconds | Saturation percentage |
|---|---|---|---|
| A | 7598 | 142 | 1.868913% |
| B | 7598 | 123 | 1.618847% |
| C | 7597 | 2627 | 34.579439% |
| D | 7597 | 476 | 6.265631% |
Noise dominated data is calculated using 1-second bins in cleaned event files. If a bin has >2000 counts, and if more than 50% of those come from <1% of pixels, then it is considered to be noise-dominated and hence unusable.
| Quadrant | # 1 sec bins | Bins with >0 counts | Bins with >2000 counts | High rate bins dominated by noise | Noise dominated (total time) | Noise dominated (detector-on time) | Marked lightcurve |
|---|---|---|---|---|---|---|---|
| A | 7598 | 7598 | 77 | 77 | 1.01% | 1.01% | 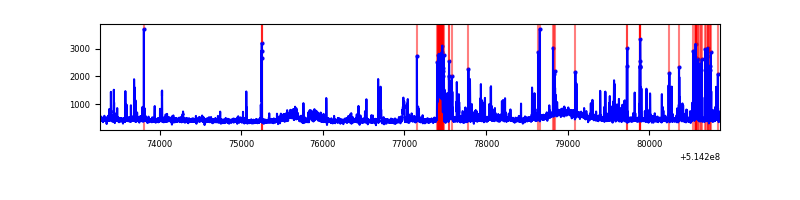 |
| B | 7598 | 7598 | 29 | 29 | 0.38% | 0.38% | 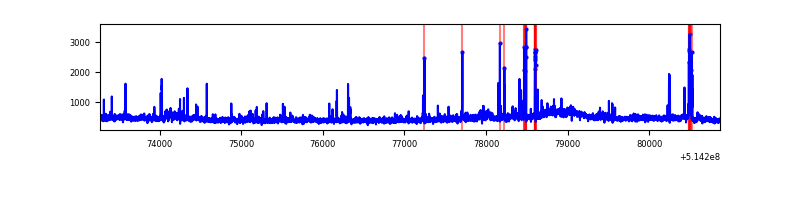 |
| C | 7597 | 7597 | 2012 | 2012 | 26.48% | 26.48% | 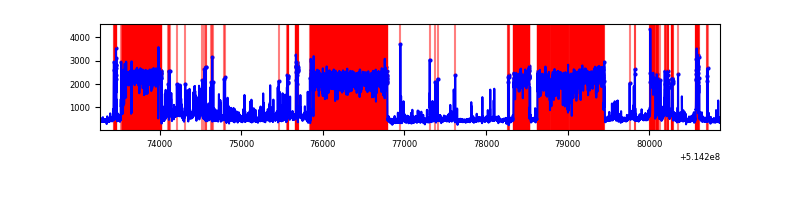 |
| D | 7597 | 7597 | 427 | 427 | 5.62% | 5.62% | 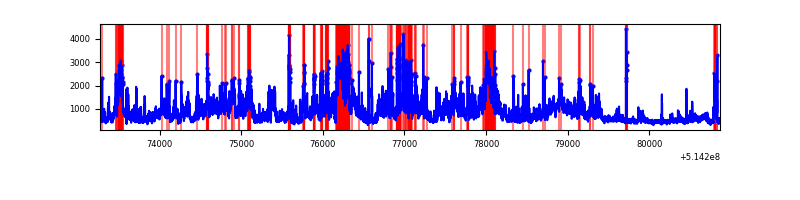 |
Top three noisy pixels from each quadrant. If the there are fewer than three noisy pixels in the level2.evt file, extra rows are filled as -1
| Pixel properties | Quadrant properties | ||||||
|---|---|---|---|---|---|---|---|
| Quadrant | DetID | PixID | Counts | Sigma | Mean | Median | Sigma |
| A | 10 | 251 | 450091 | 2189.94 | 833 | 810 | 205.2 |
| A | 3 | 14 | 330043 | 1604.79 | 833 | 810 | 205.2 |
| A | 3 | 137 | 10411 | 46.8 | 833 | 810 | 205.2 |
| B | 0 | 171 | 164342 | 921.44 | 823 | 791 | 177.5 |
| B | 0 | 213 | 131436 | 736.05 | 823 | 791 | 177.5 |
| B | 5 | 172 | 39928 | 220.5 | 823 | 791 | 177.5 |
| C | 15 | 198 | 5120667 | 31438.5 | 591 | 585 | 162.9 |
| C | 1 | 16 | 567278 | 3479.63 | 591 | 585 | 162.9 |
| C | 12 | 252 | 254486 | 1559.01 | 591 | 585 | 162.9 |
| D | 15 | 142 | 2884060 | 12895.2 | 797 | 762 | 223.6 |
| D | 8 | 160 | 312966 | 1396.29 | 797 | 762 | 223.6 |
| D | 12 | 251 | 276243 | 1232.06 | 797 | 762 | 223.6 |
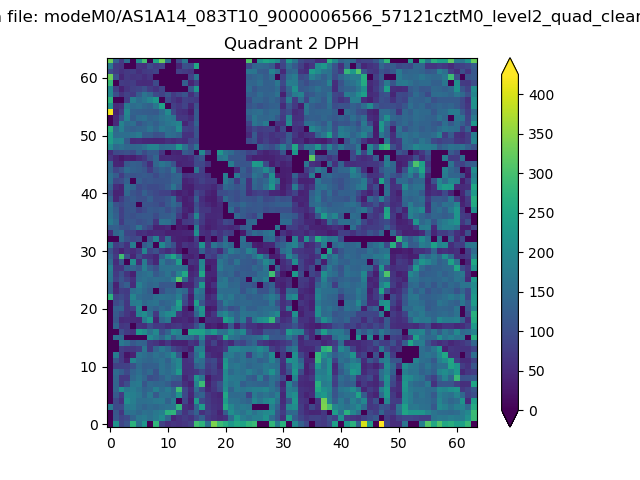
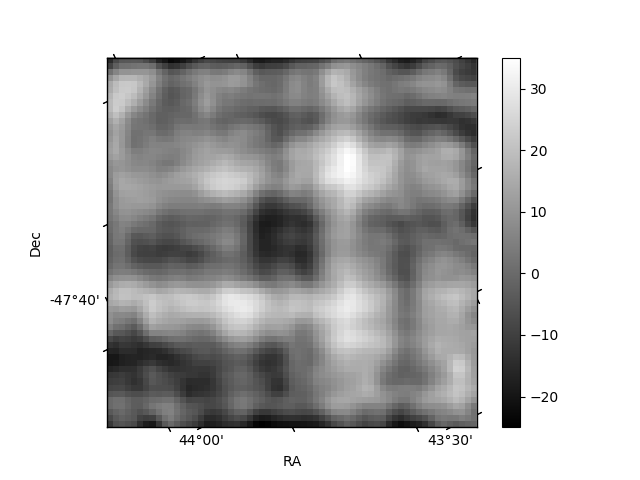
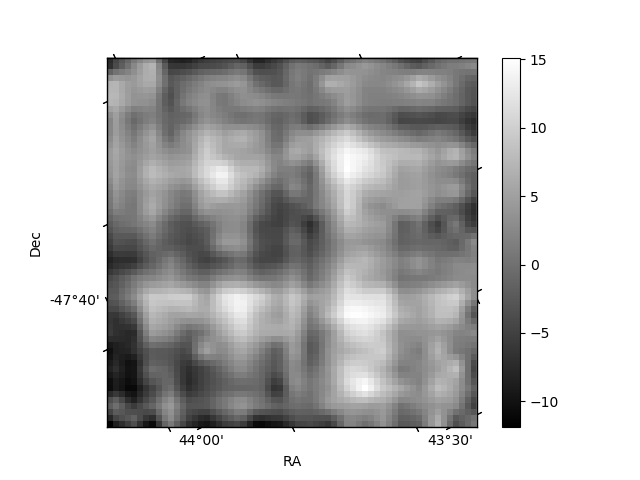
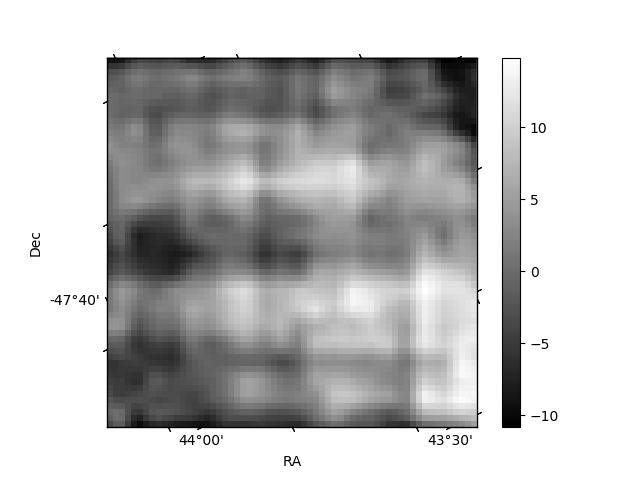
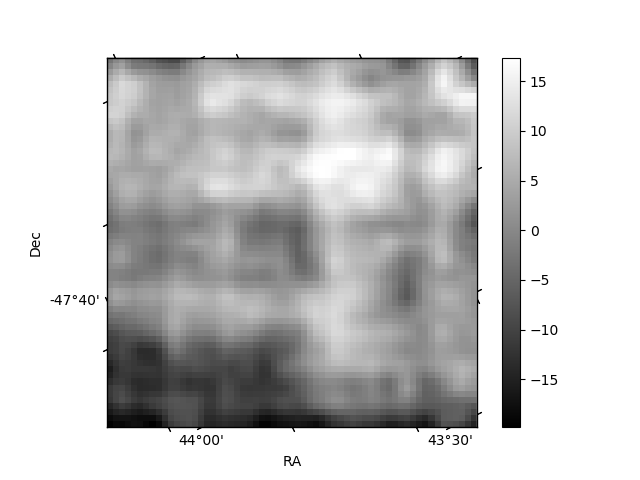
Histogram calculated using DETX and DETY for each event in the final _common_clean file
| Quadrant A | 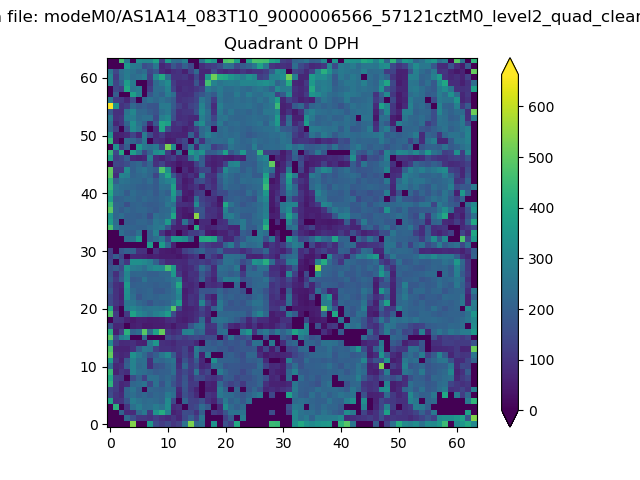 |
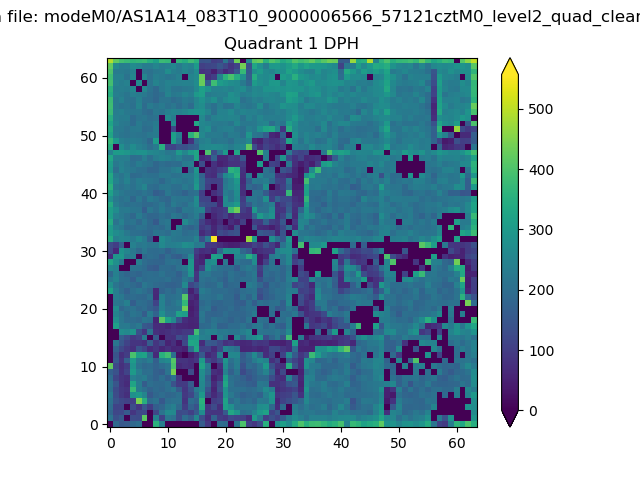 |
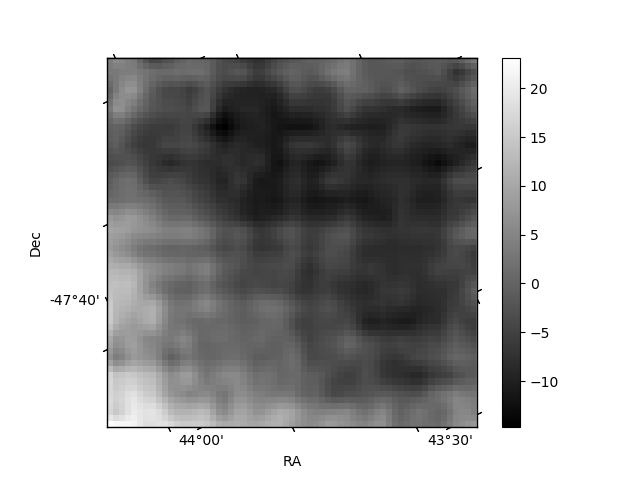
Quadrant B |
|---|---|---|---|
| Quadrant D | 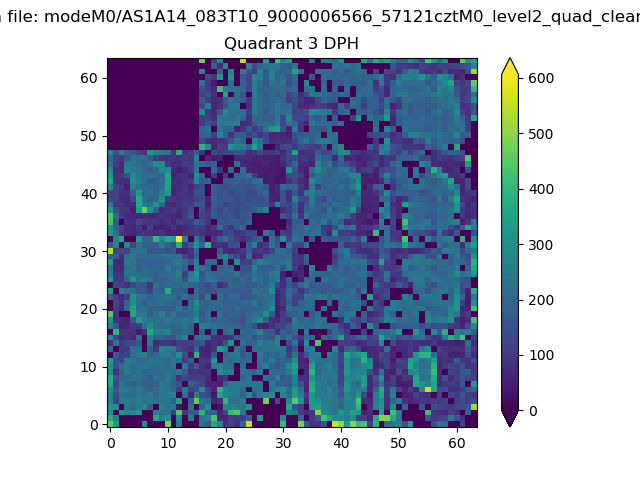 |
 |
Quadrant C |
| Plot type | Count rate plots | Images |
|---|---|---|
| Comparison with Poisson distribution Blue bars denote a histogram of data divided into 1 sec bins. Red curve is a Poisson curve with rate = median count rate of data. |
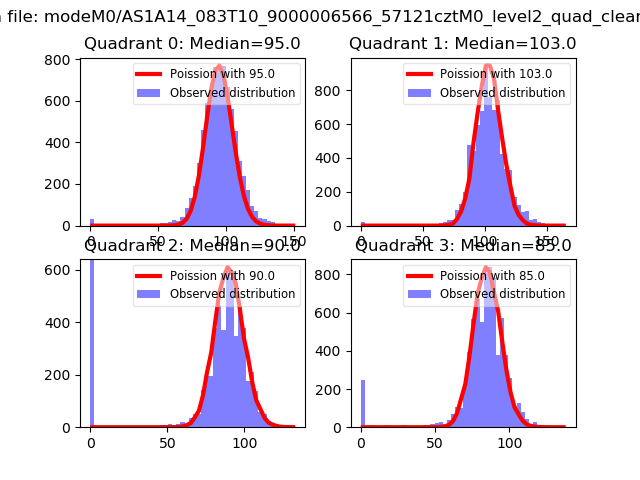 |
 |
| Quadrant-wise count rates Data is divided into 100 sec bins |
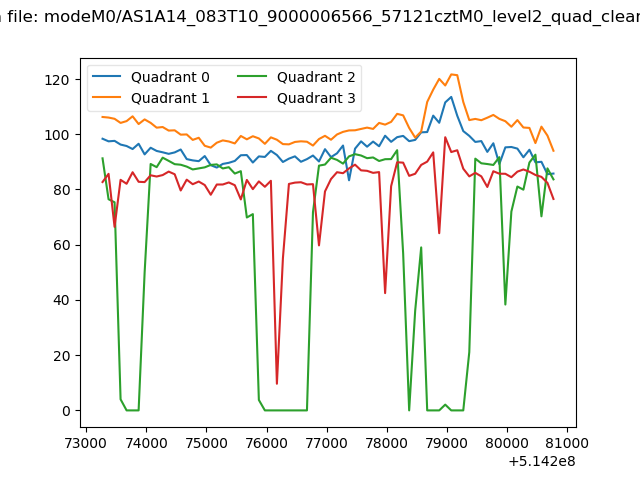 |
|
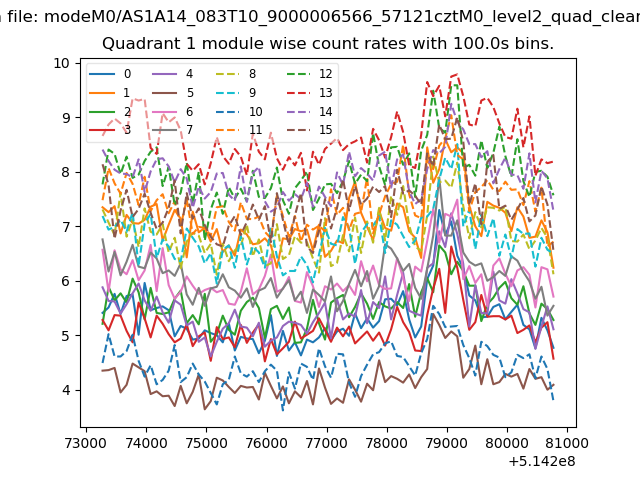
| Module-wise count rates for Quadrant A Data is divided into 100 sec bins |
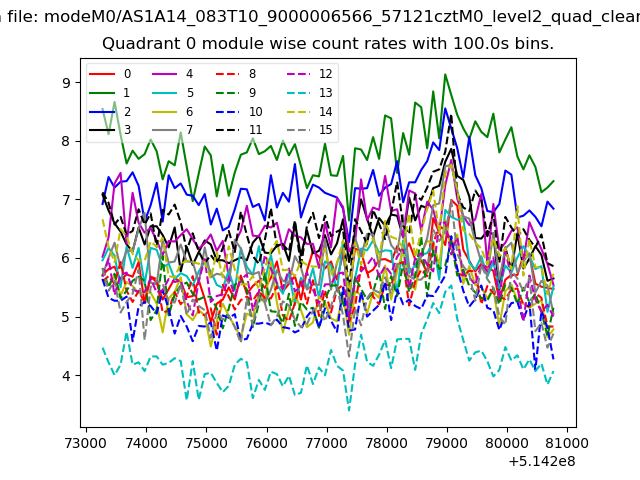 |
 |
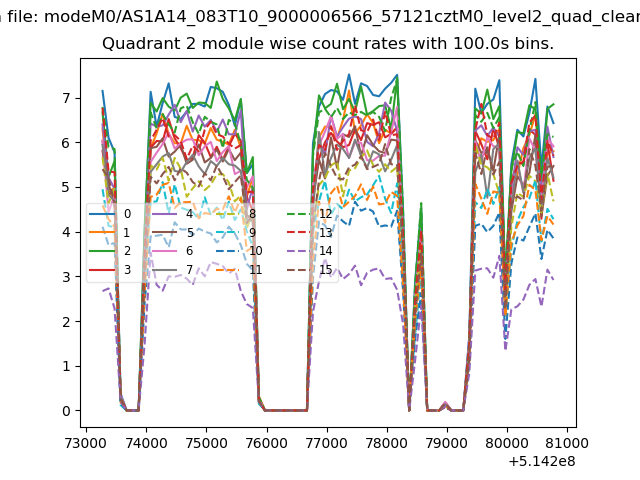
| Module-wise count rates for Quadrant B Data is divided into 100 sec bins |
 |
 |
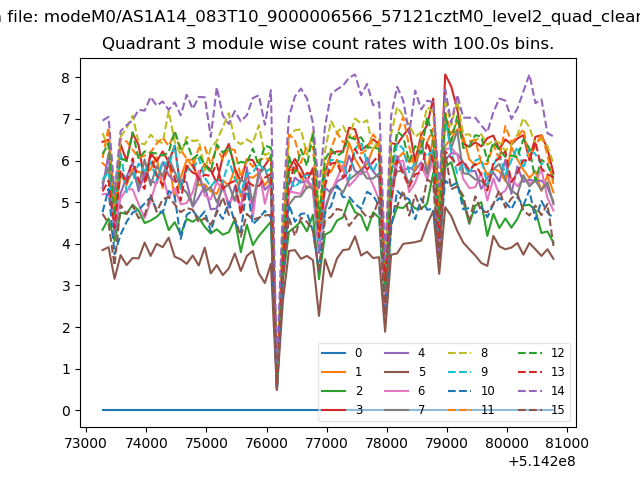
| Module-wise count rates for Quadrant C Data is divided into 100 sec bins |
 |
 |
| Module-wise count rates for Quadrant D Data is divided into 100 sec bins |
 |
 |
| Parameter | Plot |
|---|---|
| CZT HV Monitor | 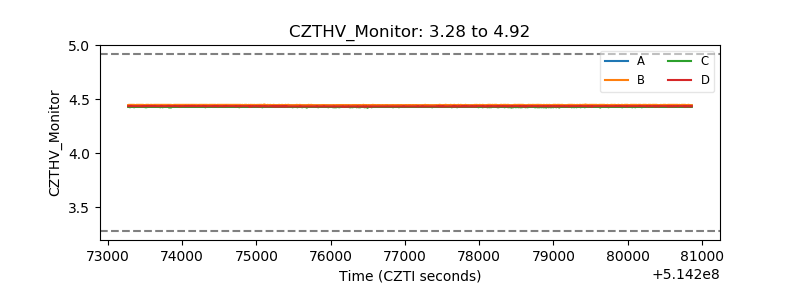 |
| D_VDD | 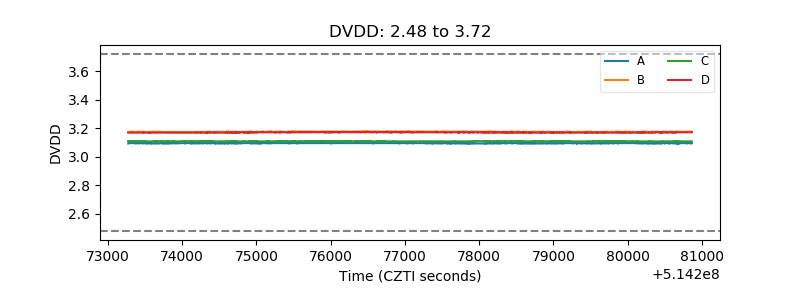 |
| Temperature 1 | 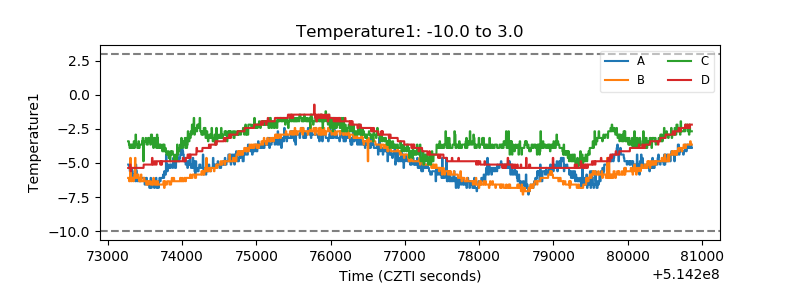 |
| Veto HV Monitor | 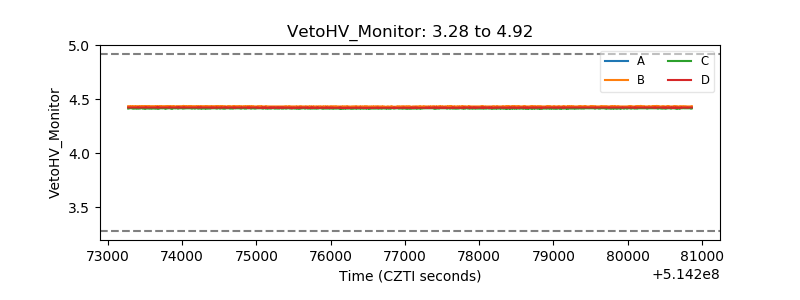 |
| Veto LLD | 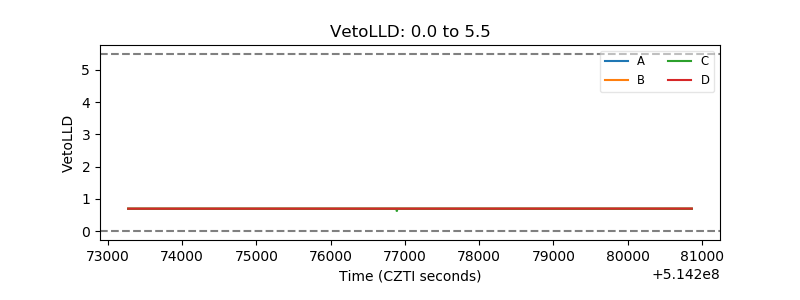 |
| Alpha Counter | 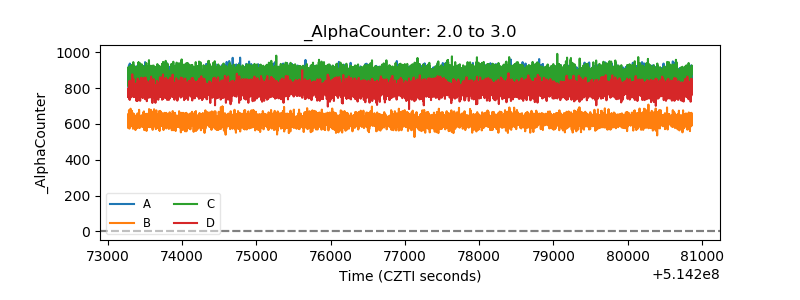 |
| _CPM_Rate | 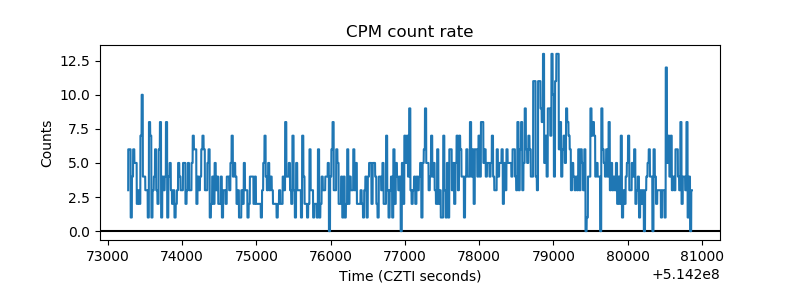 |
| CZT Counter | 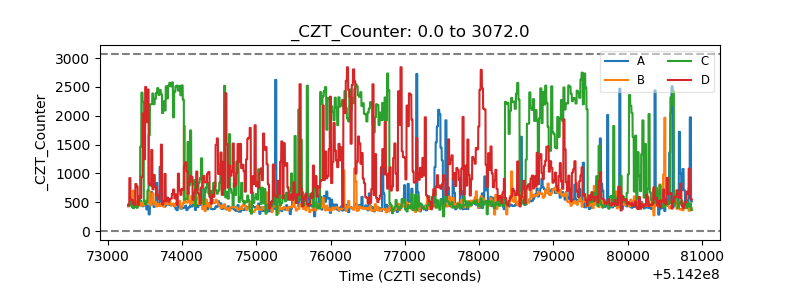 |
| +2.5 Volts monitor |  |
| +5 Volts monitor |  |
| _ROLL_ROT | 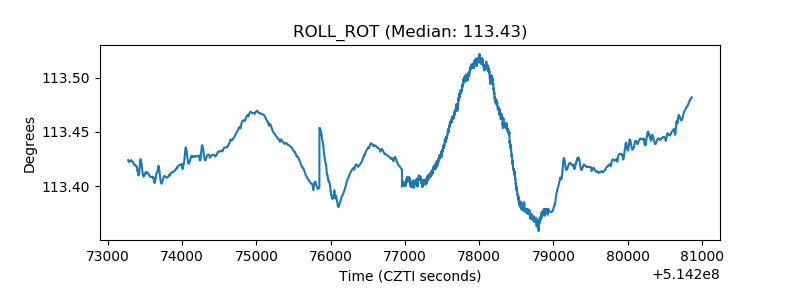 |
| _Roll_DEC | 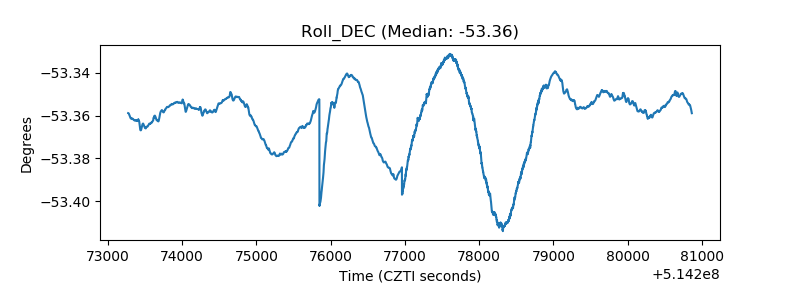 |
| _Roll_RA | 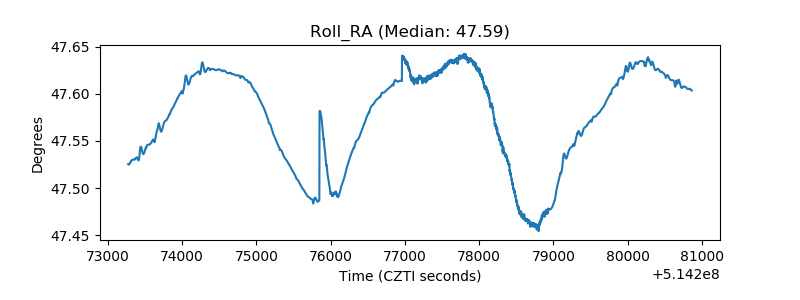 |
| Veto Counter | 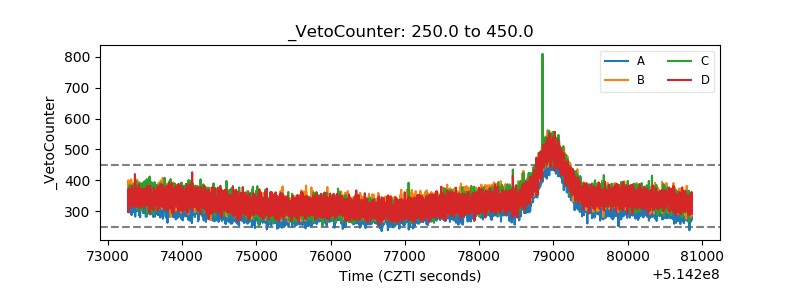 |