| Param | Original file | Final file |
|---|---|---|
| Filename | modeM0/AS1A14_083T10_9000006566_57122cztM0_level2.fits | modeM0/AS1A14_083T10_9000006566_57122cztM0_level2_quad_clean.evt |
| Size (bytes) | 559,103,040 | 104,359,680 |
| Size | 533.2 MB | 99.5 MB |
| Events in quadrant A | 3,586,760 | 716,978 |
| Events in quadrant B | 3,516,422 | 773,168 |
| Events in quadrant C | 8,114,672 | 504,879 |
| Events in quadrant D | 4,890,886 | 639,501 |
| Mode M0 | |||
|---|---|---|---|
| Quadrant | BADHDUFLAG | Total packets | Discarded packets |
| A | 0 | 16194 | 0 |
| B | 0 | 15830 | 0 |
| C | 0 | 29313 | 2 |
| D | 0 | 19654 | 0 |
| Mode SS | |||
|---|---|---|---|
| Quadrant | BADHDUFLAG | Total packets | Discarded packets |
| A | 0 | 150 | 0 |
| B | 0 | 150 | 0 |
| C | 0 | 150 | 0 |
| D | 0 | 150 | 0 |
| Quadrant | Total seconds | Saturated seconds | Saturation percentage |
|---|---|---|---|
| A | 7556 | 65 | 0.860244% |
| B | 7557 | 45 | 0.595474% |
| C | 7556 | 2085 | 27.593965% |
| D | 7556 | 185 | 2.448385% |
Noise dominated data is calculated using 1-second bins in cleaned event files. If a bin has >2000 counts, and if more than 50% of those come from <1% of pixels, then it is considered to be noise-dominated and hence unusable.
| Quadrant | # 1 sec bins | Bins with >0 counts | Bins with >2000 counts | High rate bins dominated by noise | Noise dominated (total time) | Noise dominated (detector-on time) | Marked lightcurve |
|---|---|---|---|---|---|---|---|
| A | 7556 | 7556 | 41 | 41 | 0.54% | 0.54% | 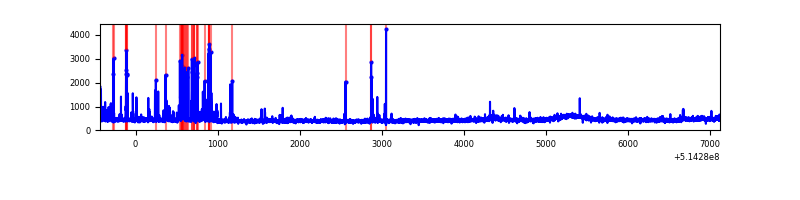 |
| B | 7557 | 7557 | 26 | 26 | 0.34% | 0.34% | 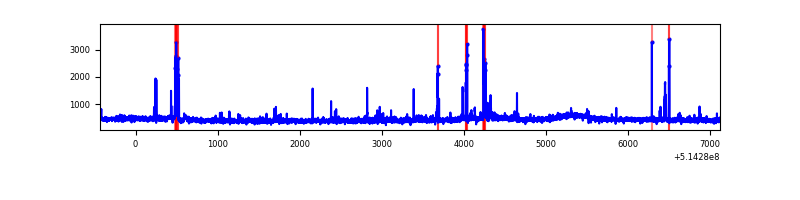 |
| C | 7556 | 7556 | 1640 | 1640 | 21.70% | 21.70% | 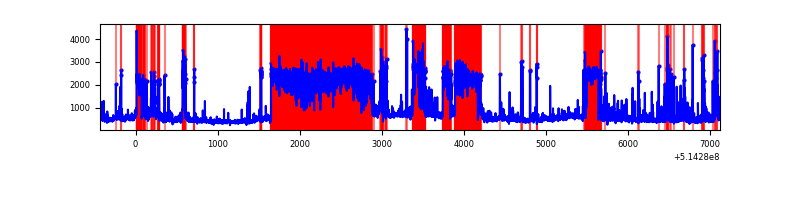 |
| D | 7556 | 7556 | 184 | 184 | 2.44% | 2.44% | 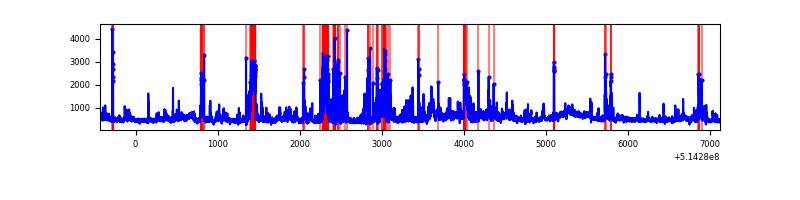 |
Top three noisy pixels from each quadrant. If the there are fewer than three noisy pixels in the level2.evt file, extra rows are filled as -1
| Pixel properties | Quadrant properties | ||||||
|---|---|---|---|---|---|---|---|
| Quadrant | DetID | PixID | Counts | Sigma | Mean | Median | Sigma |
| A | 10 | 251 | 354867 | 1750.46 | 817 | 795 | 202.3 |
| A | 3 | 14 | 64021 | 312.58 | 817 | 795 | 202.3 |
| A | 3 | 137 | 9965 | 45.33 | 817 | 795 | 202.3 |
| B | 0 | 213 | 139404 | 788.4 | 808 | 777 | 175.8 |
| B | 0 | 171 | 67263 | 378.12 | 808 | 777 | 175.8 |
| B | 10 | 16 | 25393 | 140.0 | 808 | 777 | 175.8 |
| C | 15 | 198 | 3662984 | 19894.06 | 666 | 659 | 184.1 |
| C | 12 | 254 | 744951 | 4043.06 | 666 | 659 | 184.1 |
| C | 1 | 16 | 530038 | 2875.63 | 666 | 659 | 184.1 |
| D | 15 | 142 | 701773 | 3135.61 | 789 | 754 | 223.6 |
| D | 2 | 249 | 475561 | 2123.78 | 789 | 754 | 223.6 |
| D | 8 | 240 | 140564 | 625.36 | 789 | 754 | 223.6 |
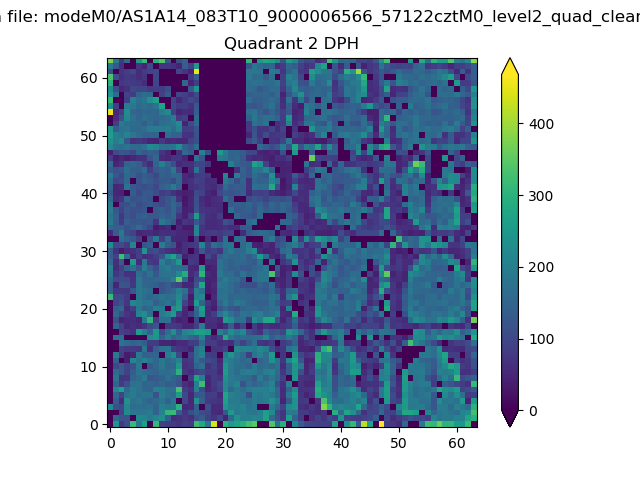
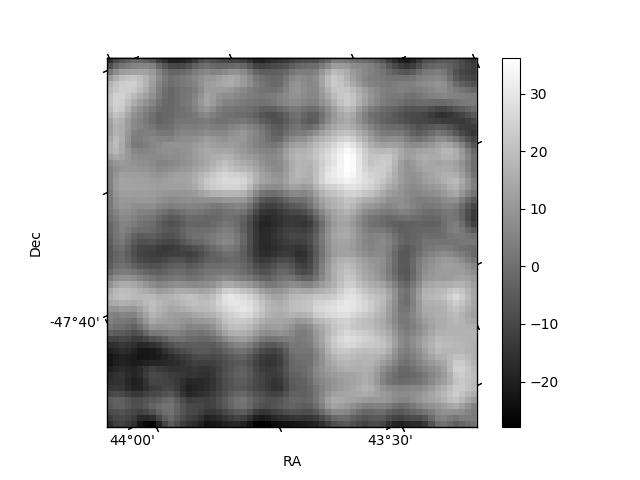
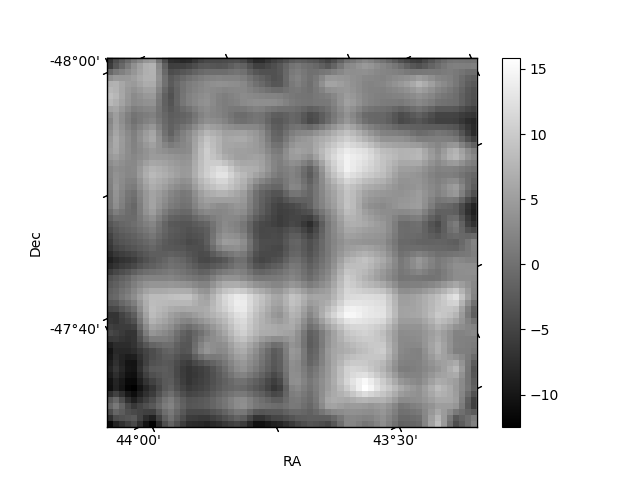
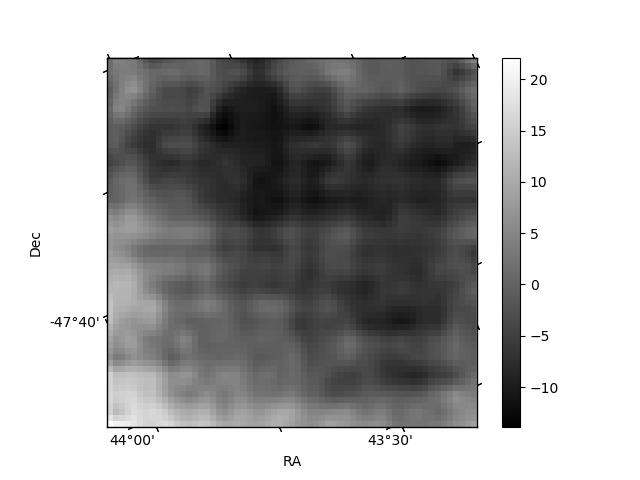
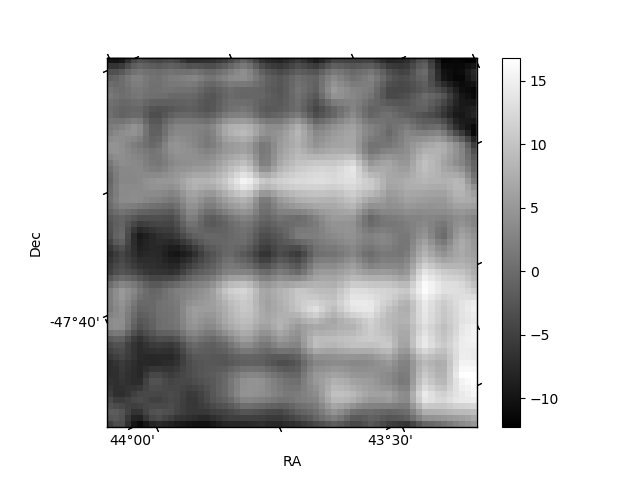
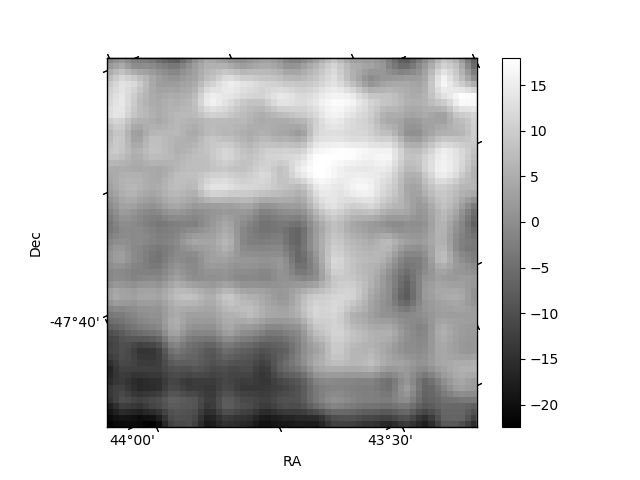
Histogram calculated using DETX and DETY for each event in the final _common_clean file
| Quadrant A | 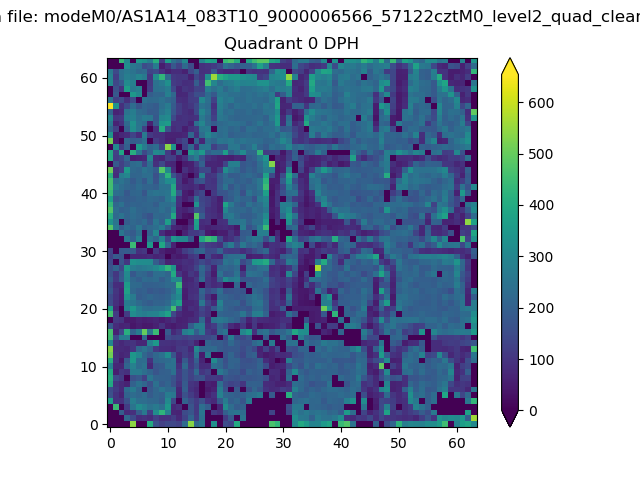 |
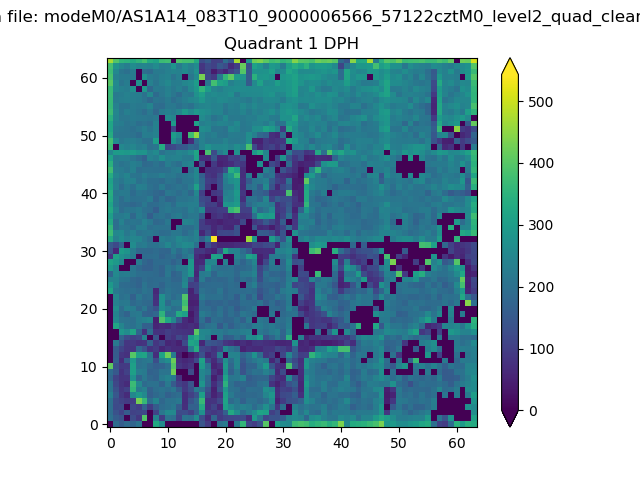 |
Quadrant B |
|---|---|---|---|
| Quadrant D | 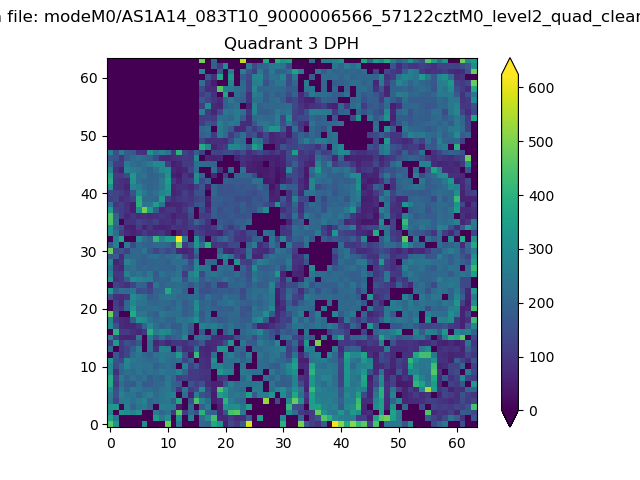 |
 |
Quadrant C |
| Plot type | Count rate plots | Images |
|---|---|---|
| Comparison with Poisson distribution Blue bars denote a histogram of data divided into 1 sec bins. Red curve is a Poisson curve with rate = median count rate of data. |
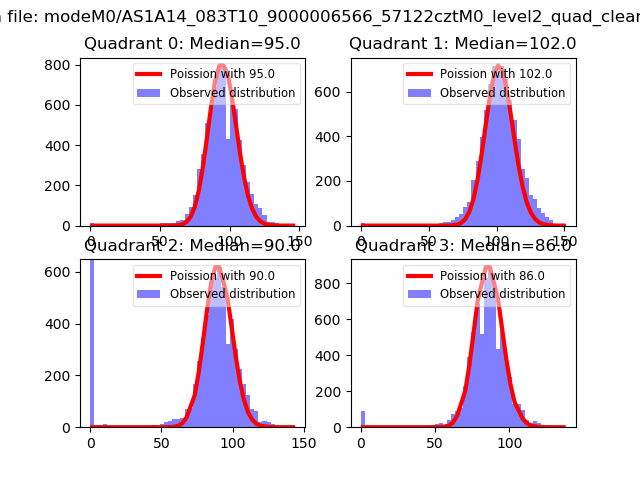 |
 |
| Quadrant-wise count rates Data is divided into 100 sec bins |
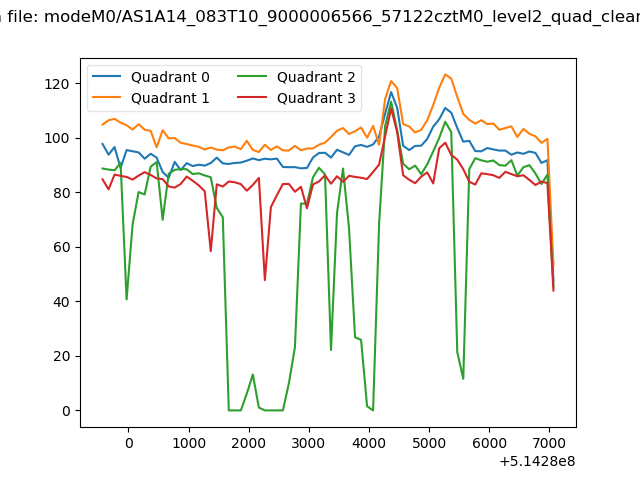 |
|
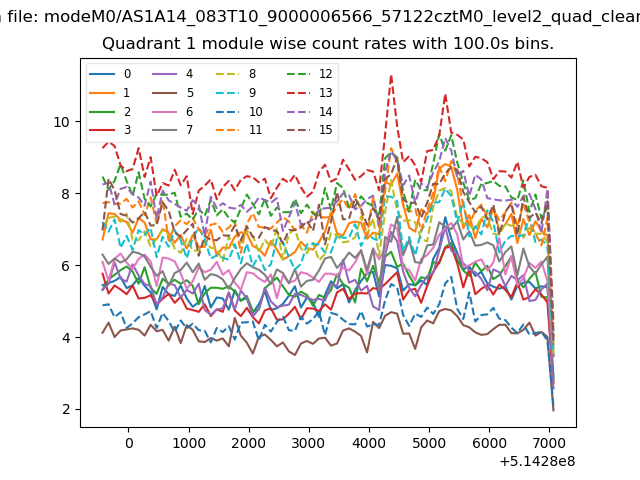
| Module-wise count rates for Quadrant A Data is divided into 100 sec bins |
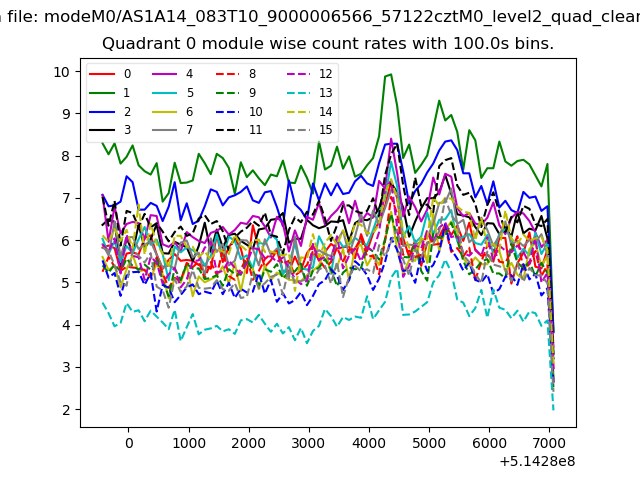 |
 |
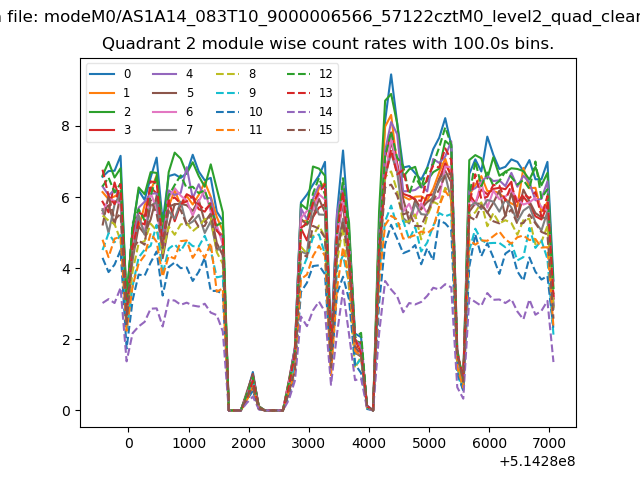
| Module-wise count rates for Quadrant B Data is divided into 100 sec bins |
 |
 |
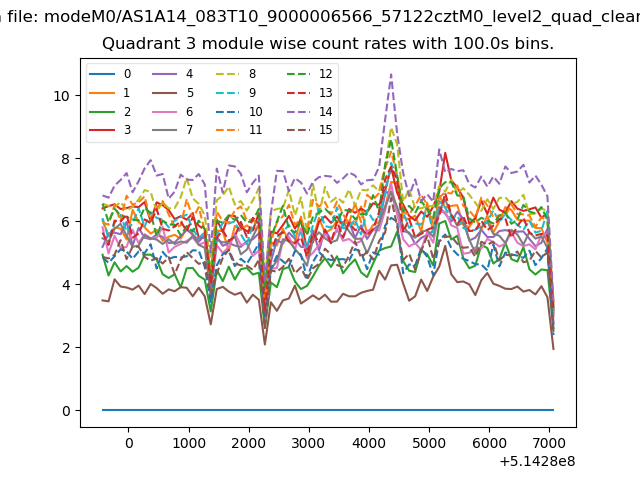
| Module-wise count rates for Quadrant C Data is divided into 100 sec bins |
 |
 |
| Module-wise count rates for Quadrant D Data is divided into 100 sec bins |
 |
 |
| Parameter | Plot |
|---|---|
| CZT HV Monitor | 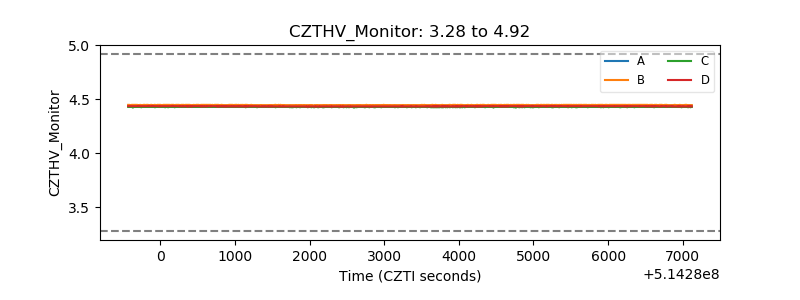 |
| D_VDD | 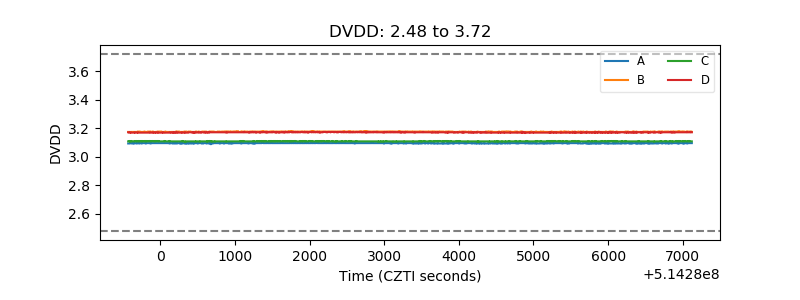 |
| Temperature 1 | 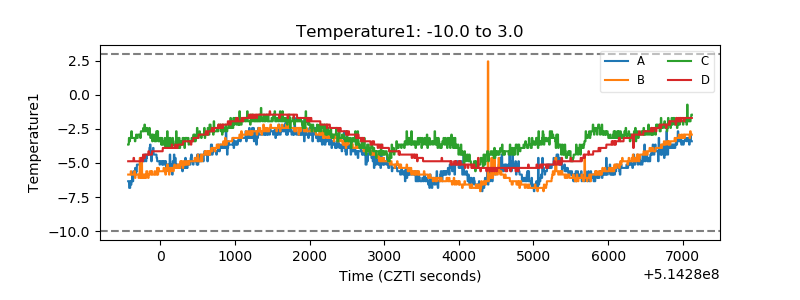 |
| Veto HV Monitor | 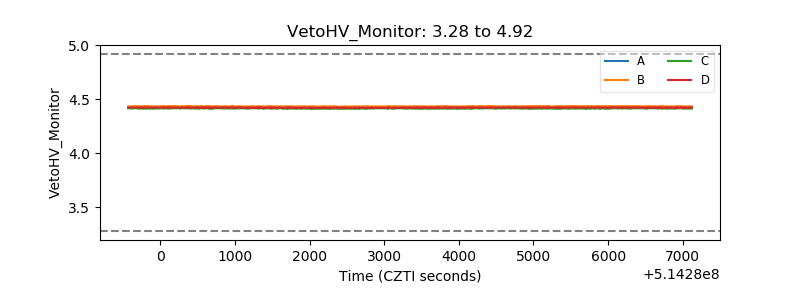 |
| Veto LLD | 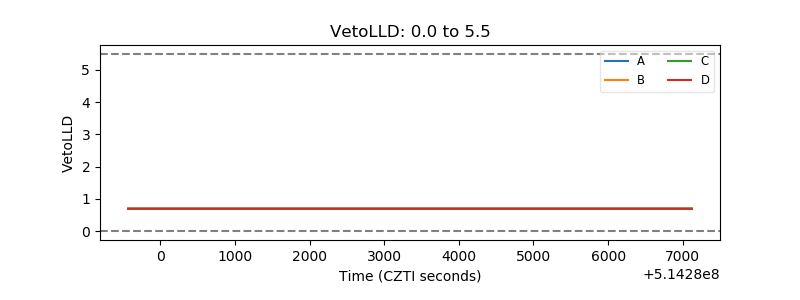 |
| Alpha Counter | 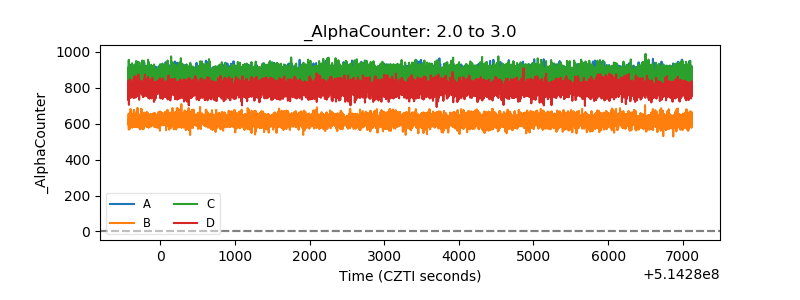 |
| _CPM_Rate | 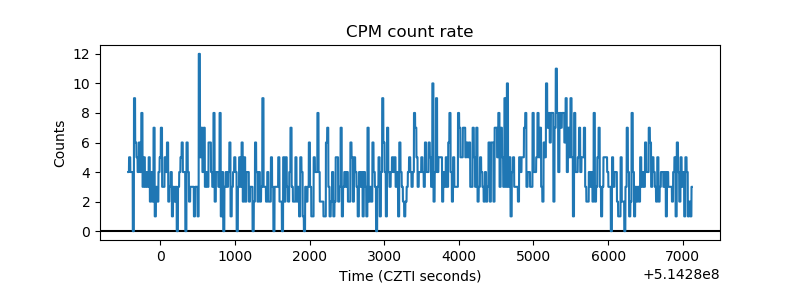 |
| CZT Counter | 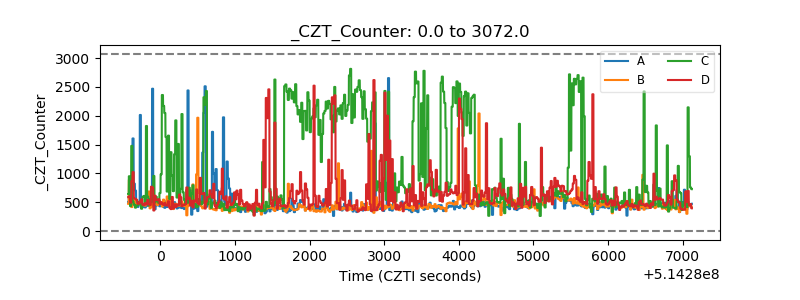 |
| +2.5 Volts monitor |  |
| +5 Volts monitor |  |
| _ROLL_ROT | 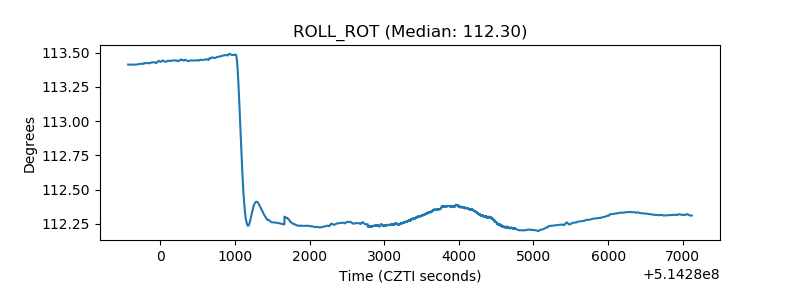 |
| _Roll_DEC | 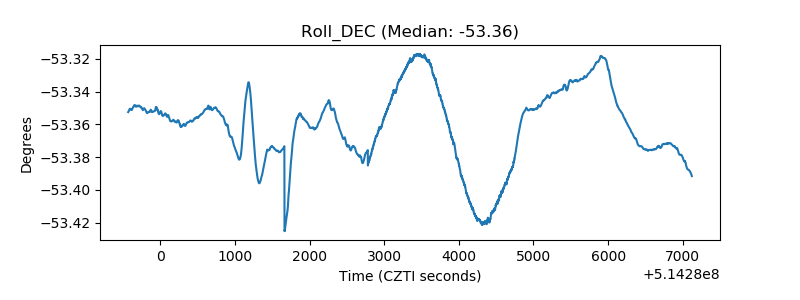 |
| _Roll_RA | 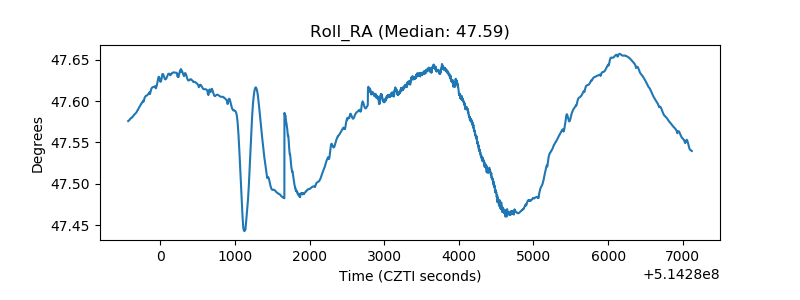 |
| Veto Counter | 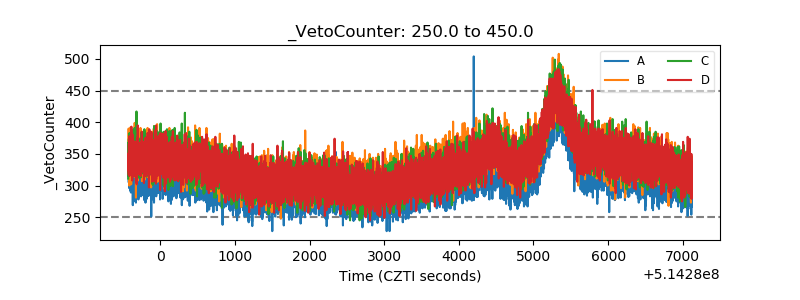 |