| Param | Original file | Final file |
|---|---|---|
| Filename | modeM0/AS1A14_083T10_9000006566_57123cztM0_level2.fits | modeM0/AS1A14_083T10_9000006566_57123cztM0_level2_quad_clean.evt |
| Size (bytes) | 522,653,760 | 101,373,120 |
| Size | 498.4 MB | 96.7 MB |
| Events in quadrant A | 3,525,768 | 698,413 |
| Events in quadrant B | 3,278,040 | 752,433 |
| Events in quadrant C | 8,206,504 | 479,379 |
| Events in quadrant D | 3,769,519 | 632,005 |
| Mode M0 | |||
|---|---|---|---|
| Quadrant | BADHDUFLAG | Total packets | Discarded packets |
| A | 0 | 15165 | 0 |
| B | 0 | 15109 | 0 |
| C | 0 | 29462 | 0 |
| D | 0 | 16299 | 0 |
| Mode SS | |||
|---|---|---|---|
| Quadrant | BADHDUFLAG | Total packets | Discarded packets |
| A | 0 | 146 | 0 |
| B | 0 | 146 | 0 |
| C | 0 | 146 | 0 |
| D | 0 | 146 | 0 |
| Quadrant | Total seconds | Saturated seconds | Saturation percentage |
|---|---|---|---|
| A | 7288 | 28 | 0.384193% |
| B | 7288 | 36 | 0.493963% |
| C | 7288 | 2128 | 29.198683% |
| D | 7288 | 65 | 0.891877% |
Noise dominated data is calculated using 1-second bins in cleaned event files. If a bin has >2000 counts, and if more than 50% of those come from <1% of pixels, then it is considered to be noise-dominated and hence unusable.
| Quadrant | # 1 sec bins | Bins with >0 counts | Bins with >2000 counts | High rate bins dominated by noise | Noise dominated (total time) | Noise dominated (detector-on time) | Marked lightcurve |
|---|---|---|---|---|---|---|---|
| A | 7288 | 7288 | 0 | 0 | 0.00% | 0.00% | 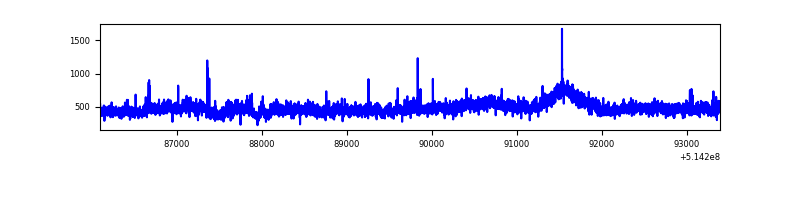 |
| B | 7288 | 7288 | 6 | 6 | 0.08% | 0.08% | 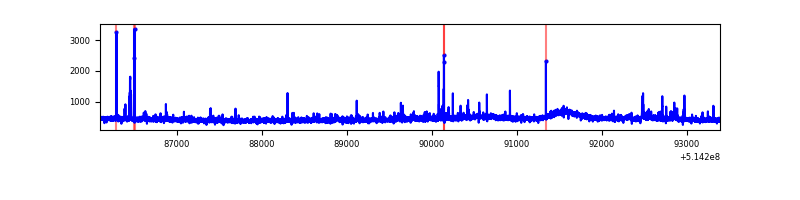 |
| C | 7288 | 7288 | 1905 | 1905 | 26.14% | 26.14% | 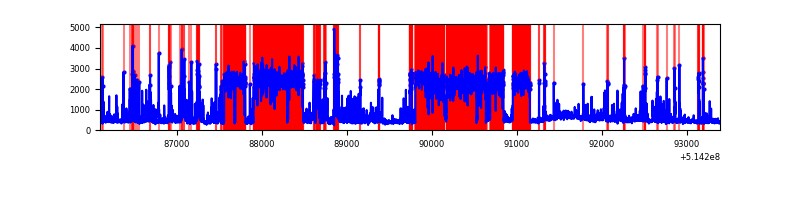 |
| D | 7288 | 7288 | 59 | 59 | 0.81% | 0.81% | 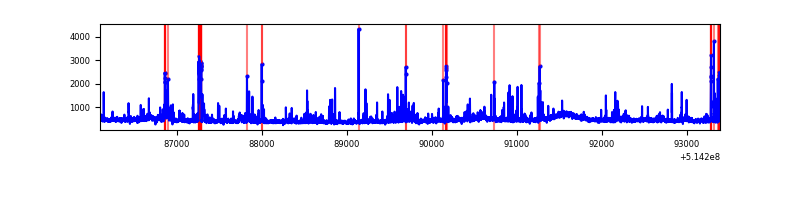 |
Top three noisy pixels from each quadrant. If the there are fewer than three noisy pixels in the level2.evt file, extra rows are filled as -1
| Pixel properties | Quadrant properties | ||||||
|---|---|---|---|---|---|---|---|
| Quadrant | DetID | PixID | Counts | Sigma | Mean | Median | Sigma |
| A | 3 | 14 | 413204 | 2082.12 | 798 | 778 | 198.1 |
| A | 10 | 251 | 14702 | 70.29 | 798 | 778 | 198.1 |
| A | 13 | 254 | 9942 | 46.26 | 798 | 778 | 198.1 |
| B | 0 | 213 | 41223 | 240.69 | 783 | 753 | 168.1 |
| B | 10 | 247 | 27060 | 156.46 | 783 | 753 | 168.1 |
| B | 0 | 245 | 25700 | 148.37 | 783 | 753 | 168.1 |
| C | 15 | 198 | 4307281 | 24694.23 | 638 | 632 | 174.4 |
| C | 12 | 254 | 668094 | 3827.21 | 638 | 632 | 174.4 |
| C | 12 | 252 | 410189 | 2348.39 | 638 | 632 | 174.4 |
| D | 3 | 12 | 204661 | 935.73 | 775 | 740 | 217.9 |
| D | 2 | 249 | 145129 | 662.55 | 775 | 740 | 217.9 |
| D | 15 | 142 | 77675 | 353.03 | 775 | 740 | 217.9 |
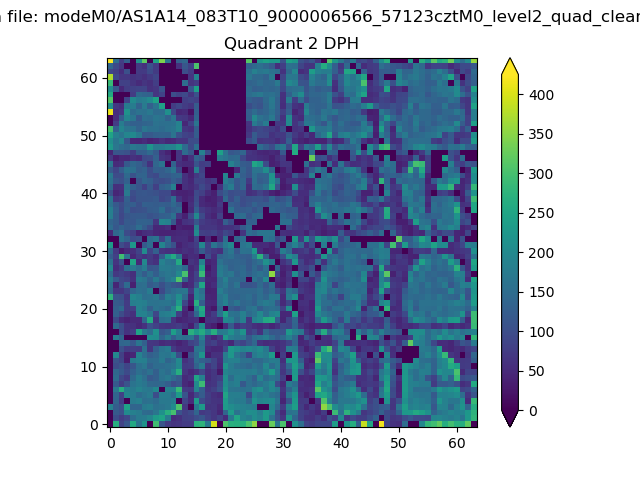
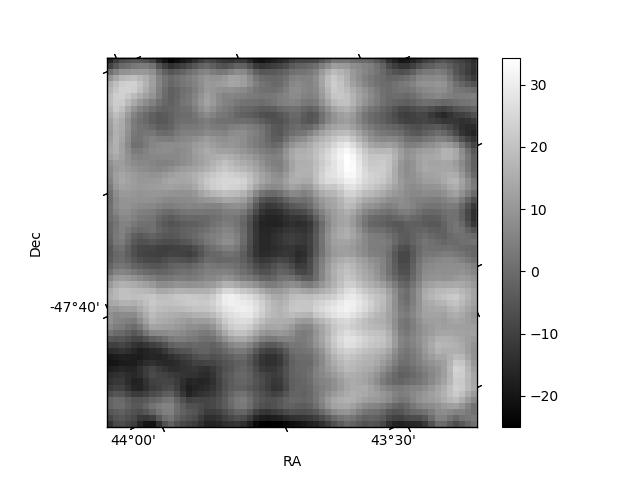
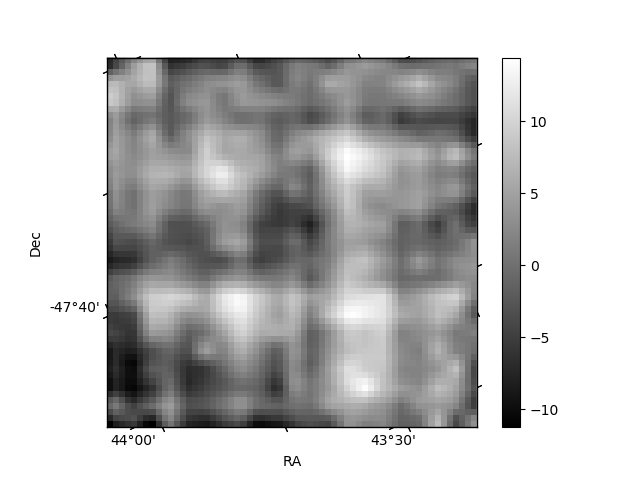
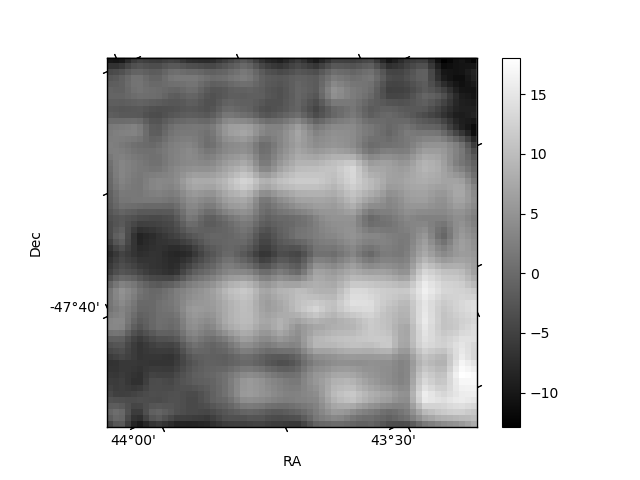
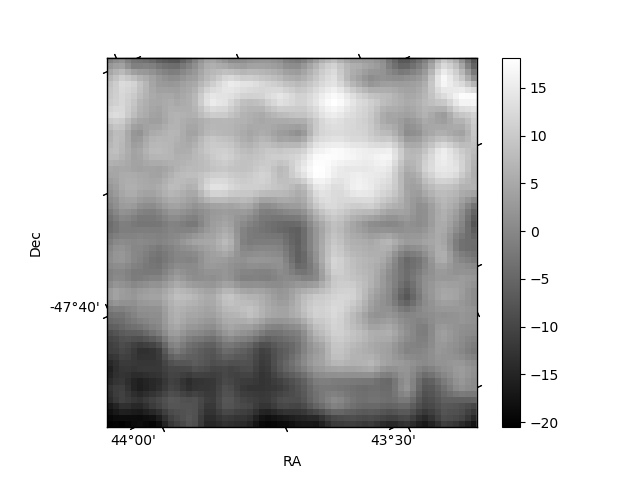
Histogram calculated using DETX and DETY for each event in the final _common_clean file
| Quadrant A | 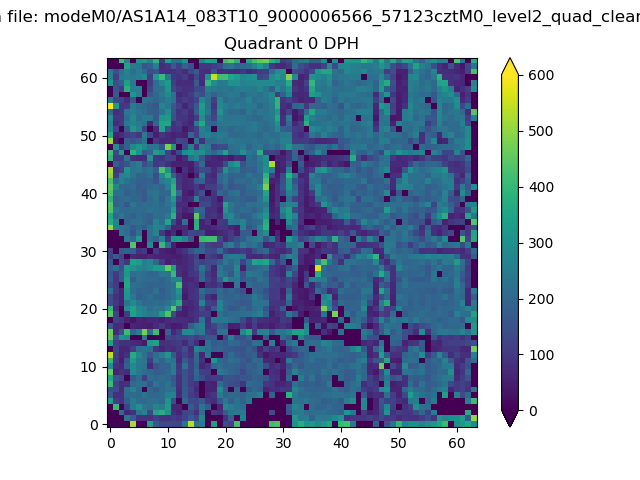 |
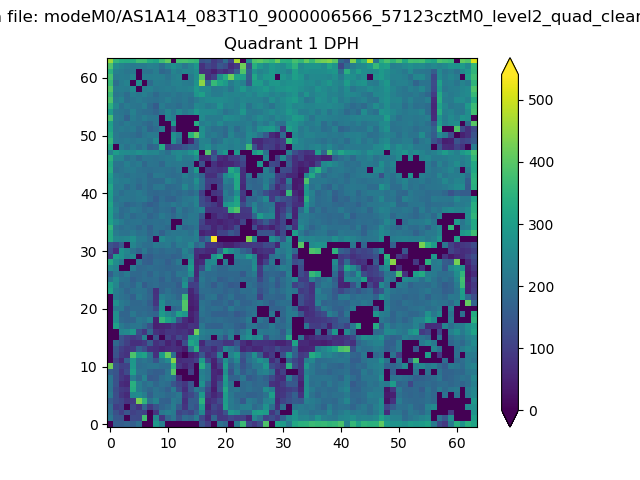 |
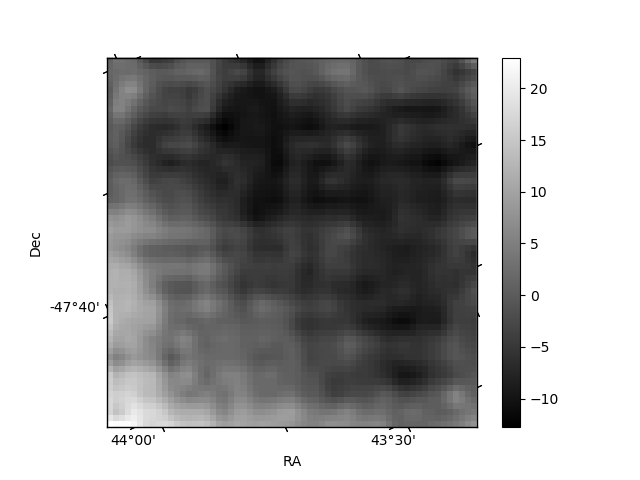
Quadrant B |
|---|---|---|---|
| Quadrant D | 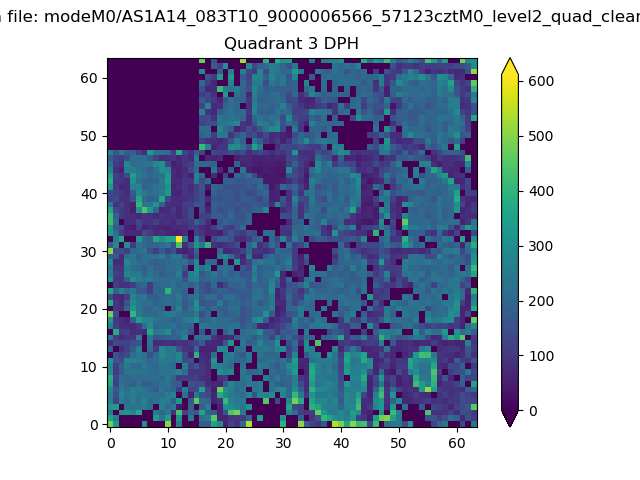 |
 |
Quadrant C |
| Plot type | Count rate plots | Images |
|---|---|---|
| Comparison with Poisson distribution Blue bars denote a histogram of data divided into 1 sec bins. Red curve is a Poisson curve with rate = median count rate of data. |
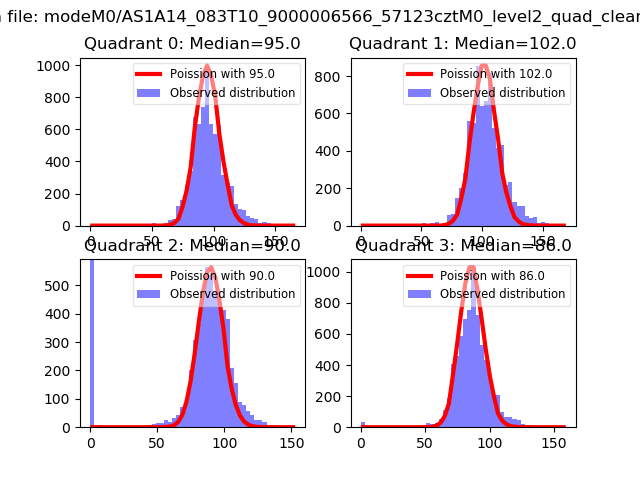 |
 |
| Quadrant-wise count rates Data is divided into 100 sec bins |
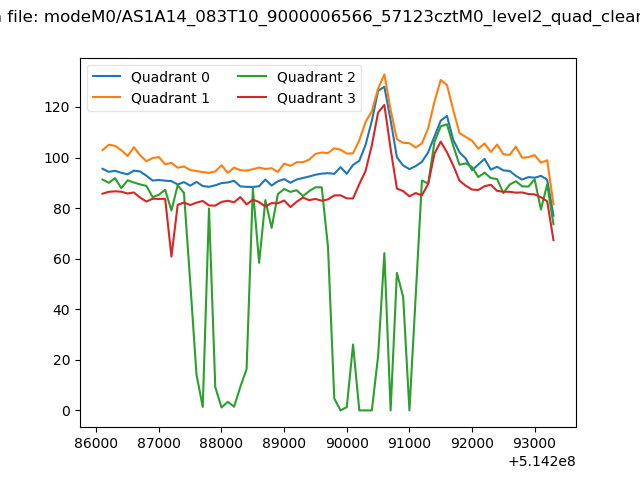 |
|
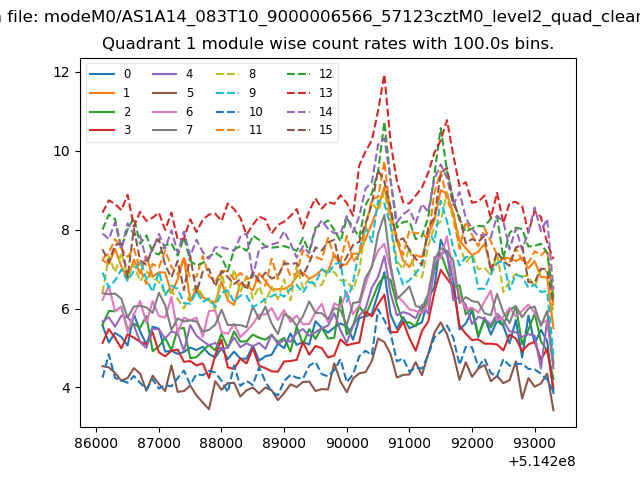
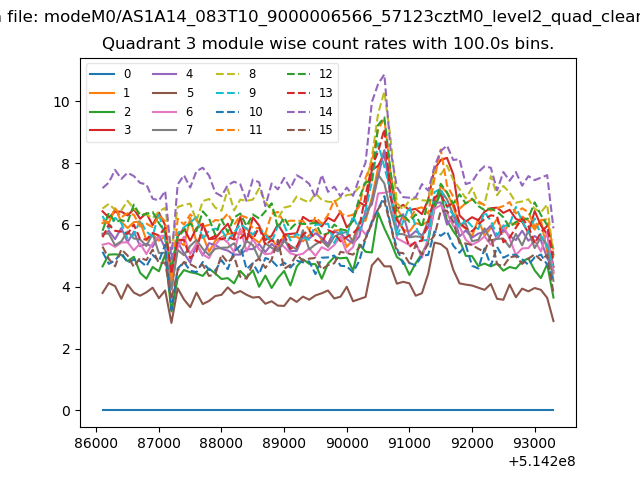
| Module-wise count rates for Quadrant A Data is divided into 100 sec bins |
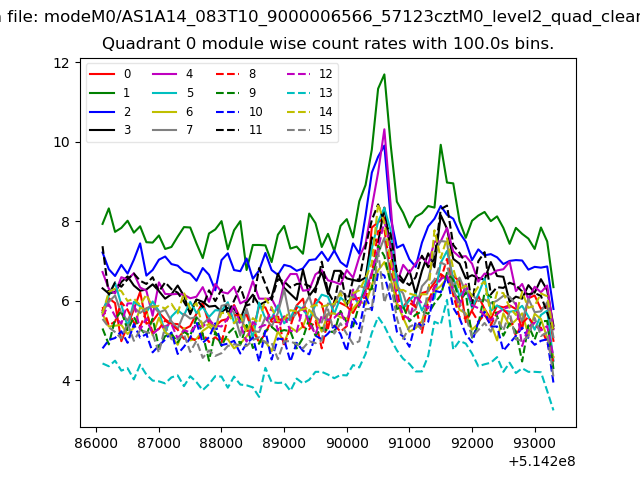 |
 |
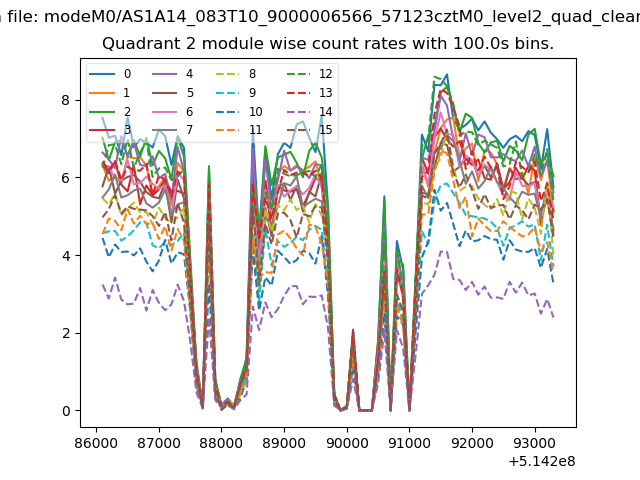
| Module-wise count rates for Quadrant B Data is divided into 100 sec bins |
 |
 |
| Module-wise count rates for Quadrant C Data is divided into 100 sec bins |
 |
 |
| Module-wise count rates for Quadrant D Data is divided into 100 sec bins |
 |
 |
| Parameter | Plot |
|---|---|
| CZT HV Monitor | 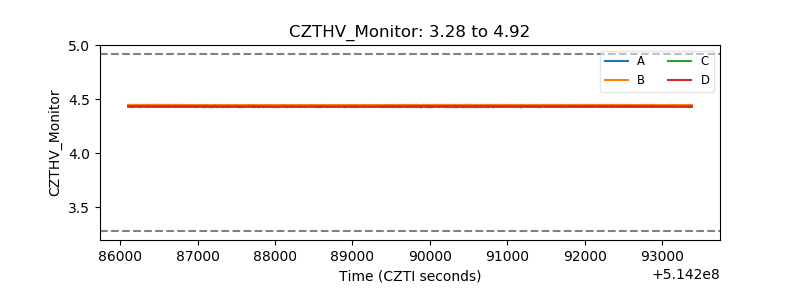 |
| D_VDD | 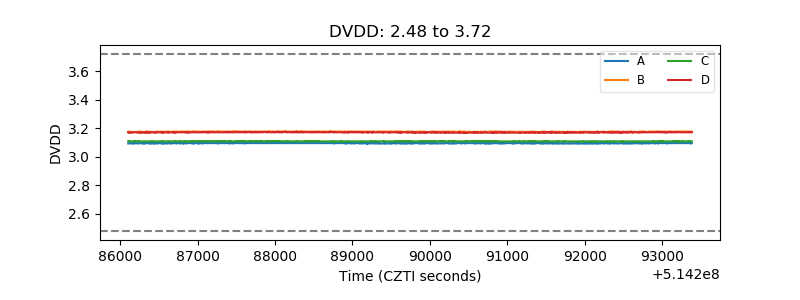 |
| Temperature 1 | 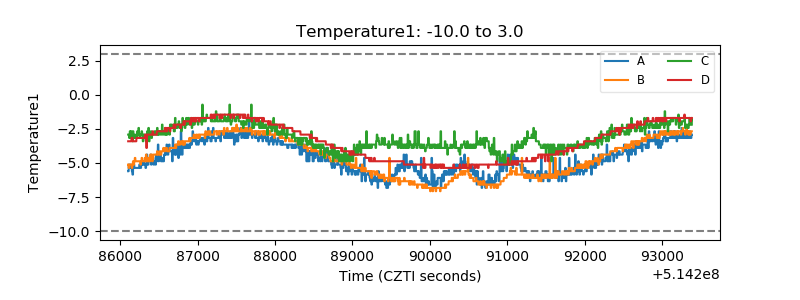 |
| Veto HV Monitor |  |
| Veto LLD | 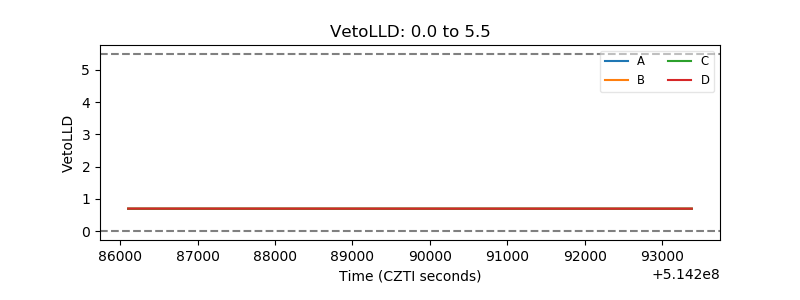 |
| Alpha Counter | 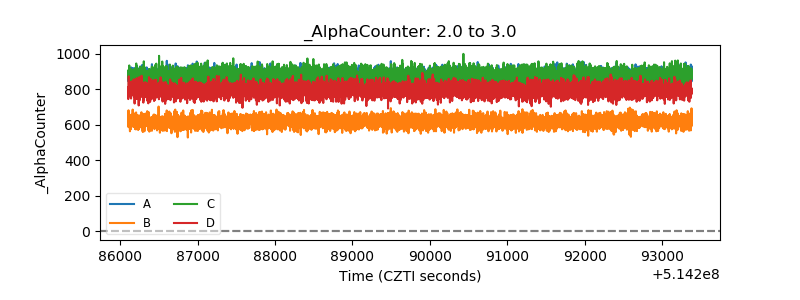 |
| _CPM_Rate | 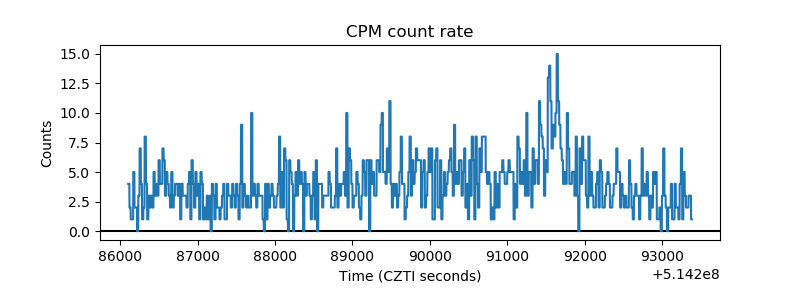 |
| CZT Counter | 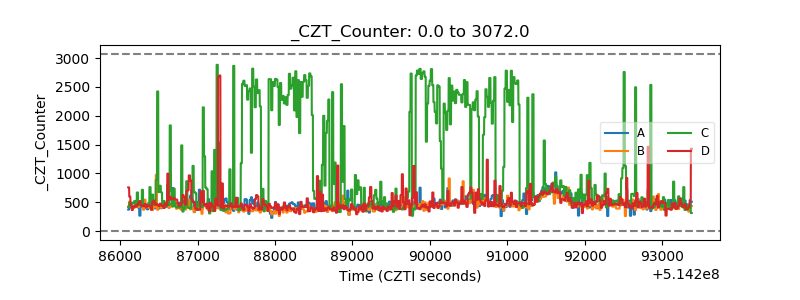 |
| +2.5 Volts monitor | 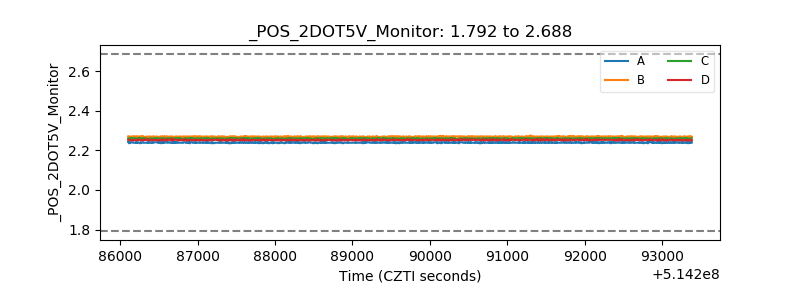 |
| +5 Volts monitor | 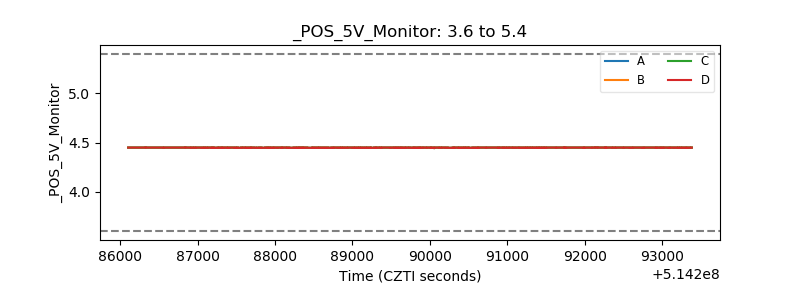 |
| _ROLL_ROT | 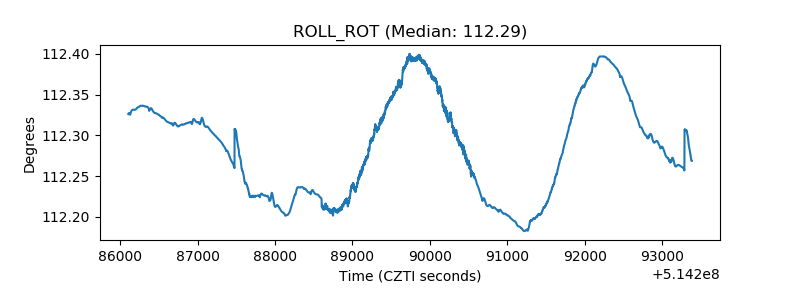 |
| _Roll_DEC | 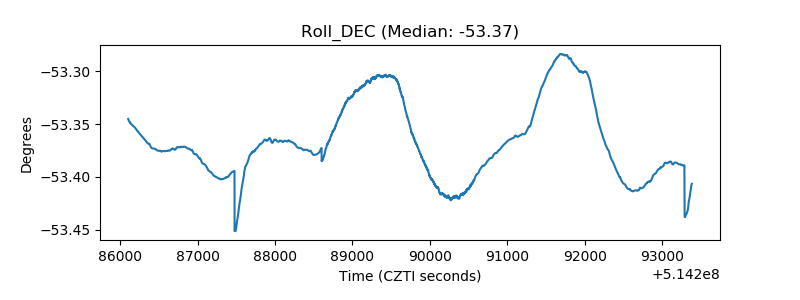 |
| _Roll_RA | 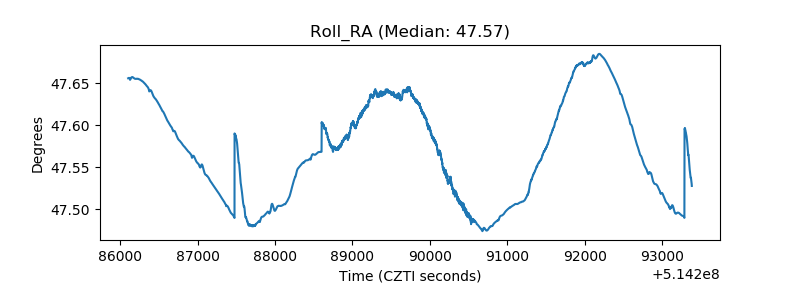 |
| Veto Counter | 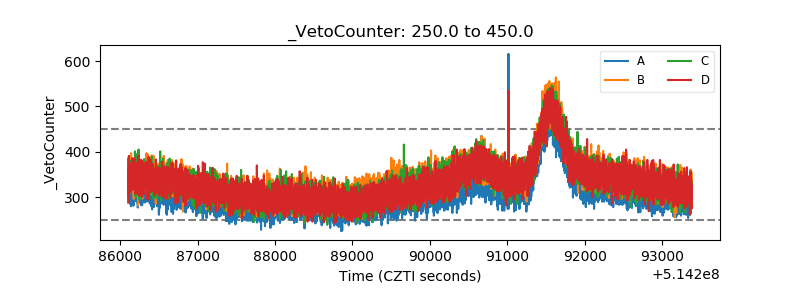 |