| Param | Original file | Final file |
|---|---|---|
| Filename | modeM0/AS1A14_083T10_9000006566_57127cztM0_level2.fits | modeM0/AS1A14_083T10_9000006566_57127cztM0_level2_quad_clean.evt |
| Size (bytes) | 1,989,512,640 | 308,393,280 |
| Size | 1.9 GB | 294.1 MB |
| Events in quadrant A | 10,775,742 | 2,250,194 |
| Events in quadrant B | 13,937,974 | 2,292,866 |
| Events in quadrant C | 29,712,347 | 1,205,106 |
| Events in quadrant D | 17,403,692 | 1,975,469 |
| Mode M9 | |||
|---|---|---|---|
| Quadrant | BADHDUFLAG | Total packets | Discarded packets |
| A | 0 | 23 | 0 |
| B | 0 | 23 | 0 |
| C | 0 | 23 | 0 |
| D | 0 | 23 | 0 |
| Mode M0 | |||
|---|---|---|---|
| Quadrant | BADHDUFLAG | Total packets | Discarded packets |
| A | 0 | 48454 | 4 |
| B | 0 | 58096 | 4 |
| C | 0 | 104391 | 5 |
| D | 0 | 68185 | 4 |
| Mode SS | |||
|---|---|---|---|
| Quadrant | BADHDUFLAG | Total packets | Discarded packets |
| A | 0 | 476 | 0 |
| B | 0 | 476 | 0 |
| C | 0 | 476 | 0 |
| D | 0 | 476 | 0 |
| Quadrant | Total seconds | Saturated seconds | Saturation percentage |
|---|---|---|---|
| A | 23448 | 192 | 0.818833% |
| B | 23449 | 1259 | 5.369099% |
| C | 23448 | 9898 | 42.212555% |
| D | 23448 | 1129 | 4.814910% |
Noise dominated data is calculated using 1-second bins in cleaned event files. If a bin has >2000 counts, and if more than 50% of those come from <1% of pixels, then it is considered to be noise-dominated and hence unusable.
| Quadrant | # 1 sec bins | Bins with >0 counts | Bins with >2000 counts | High rate bins dominated by noise | Noise dominated (total time) | Noise dominated (detector-on time) | Marked lightcurve |
|---|---|---|---|---|---|---|---|
| A | 25693 | 23453 | 13 | 13 | 0.05% | 0.06% | 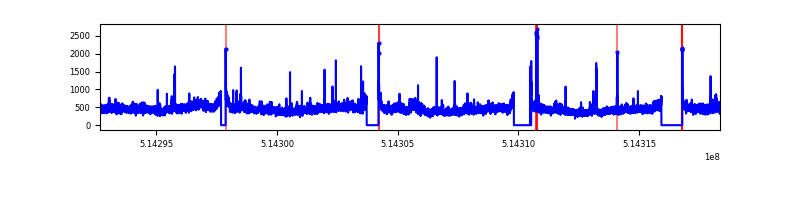 |
| B | 25694 | 23453 | 879 | 879 | 3.42% | 3.75% | 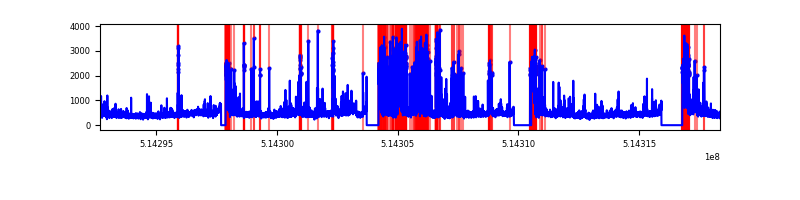 |
| C | 25693 | 23452 | 7601 | 7601 | 29.58% | 32.41% | 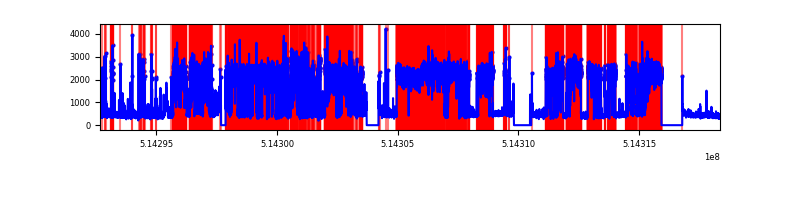 |
| D | 25693 | 23453 | 1124 | 1124 | 4.37% | 4.79% | 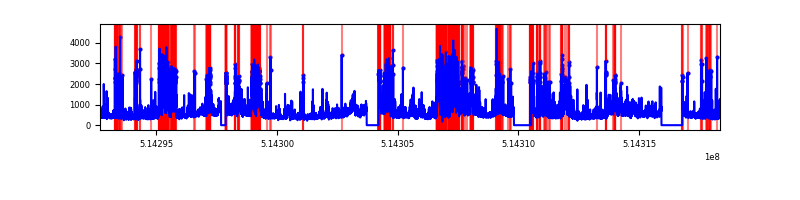 |
Top three noisy pixels from each quadrant. If the there are fewer than three noisy pixels in the level2.evt file, extra rows are filled as -1
| Pixel properties | Quadrant properties | ||||||
|---|---|---|---|---|---|---|---|
| Quadrant | DetID | PixID | Counts | Sigma | Mean | Median | Sigma |
| A | 3 | 14 | 798541 | 1274.3 | 2540 | 2480 | 624.7 |
| A | 10 | 251 | 44530 | 67.31 | 2540 | 2480 | 624.7 |
| A | 5 | 113 | 33488 | 49.64 | 2540 | 2480 | 624.7 |
| B | 10 | 16 | 3602627 | 6906.61 | 2422 | 2327 | 521.3 |
| B | 5 | 172 | 222404 | 422.18 | 2422 | 2327 | 521.3 |
| B | 0 | 213 | 103228 | 193.56 | 2422 | 2327 | 521.3 |
| C | 15 | 198 | 19117180 | 40451.52 | 1730 | 1715 | 472.6 |
| C | 13 | 3 | 1375032 | 2906.17 | 1730 | 1715 | 472.6 |
| C | 12 | 252 | 1180919 | 2495.39 | 1730 | 1715 | 472.6 |
| D | 15 | 142 | 4499081 | 6583.49 | 2410 | 2298 | 683.0 |
| D | 2 | 120 | 1177465 | 1720.5 | 2410 | 2298 | 683.0 |
| D | 2 | 249 | 508593 | 741.24 | 2410 | 2298 | 683.0 |
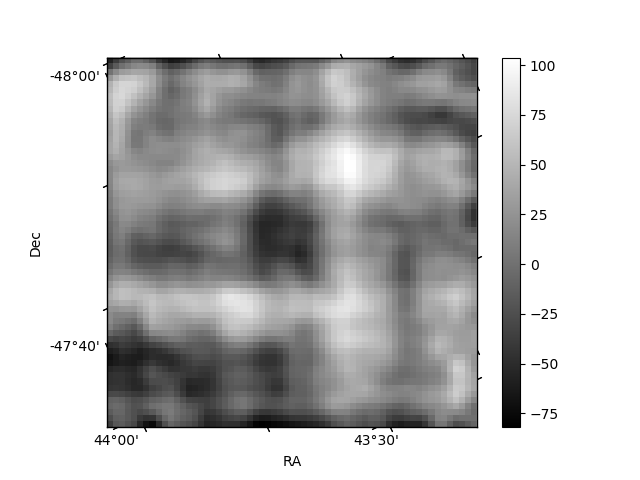
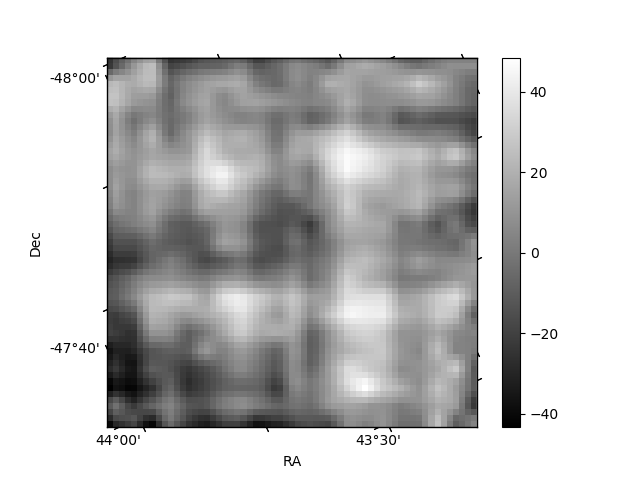
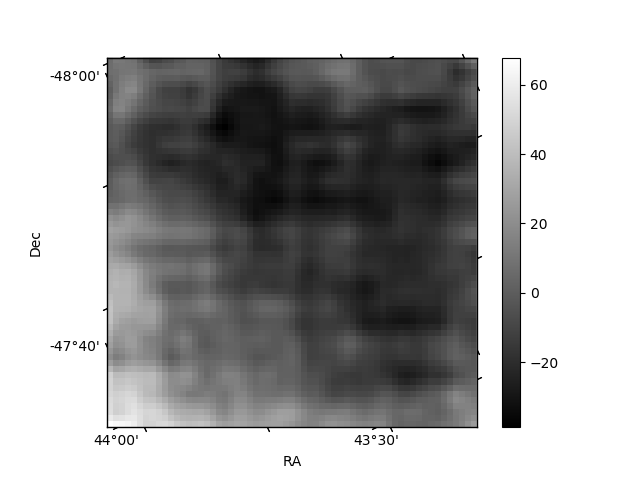
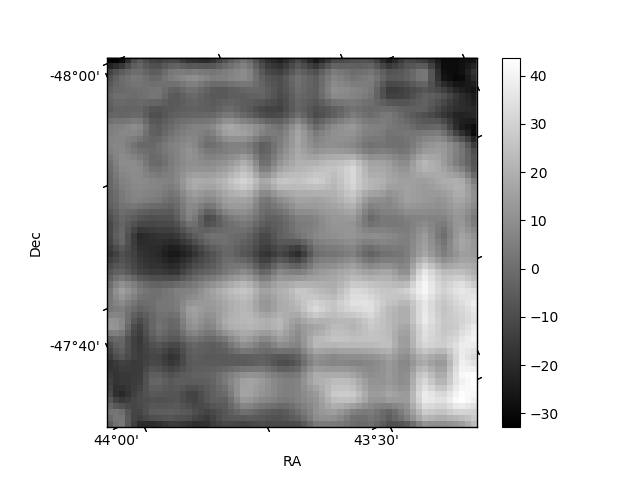
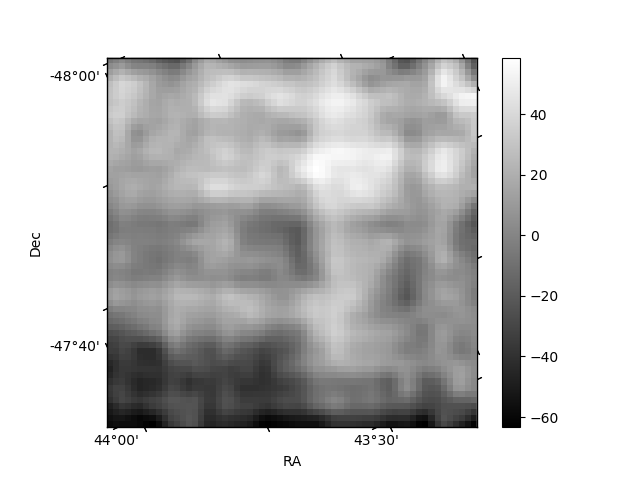
Histogram calculated using DETX and DETY for each event in the final _common_clean file
| Quadrant A | 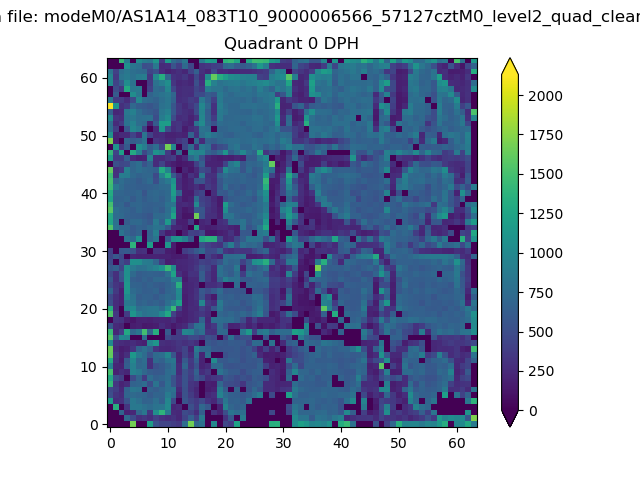 |
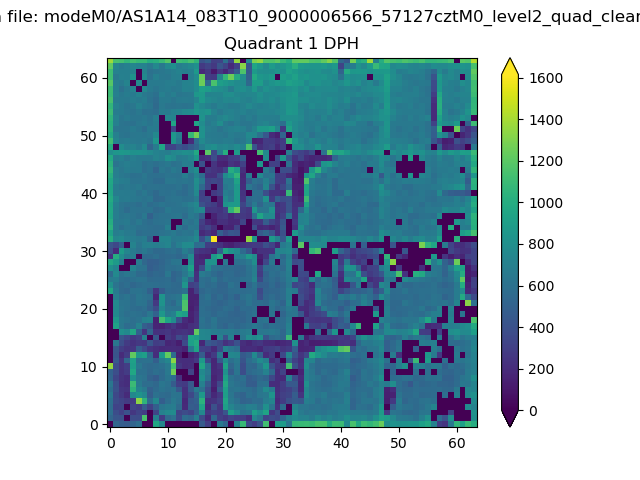 |
Quadrant B |
|---|---|---|---|
| Quadrant D | 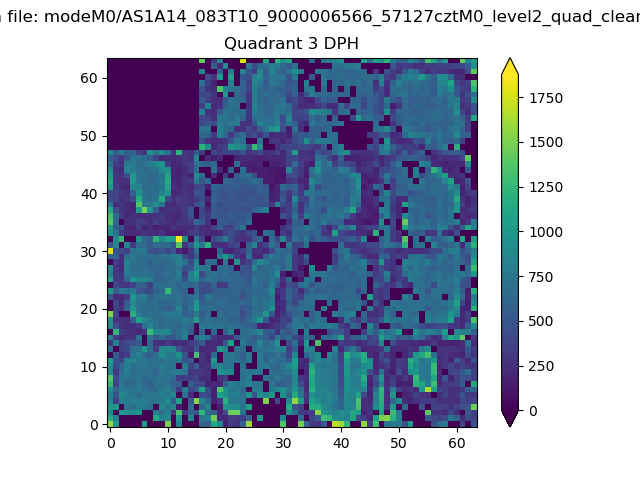 |
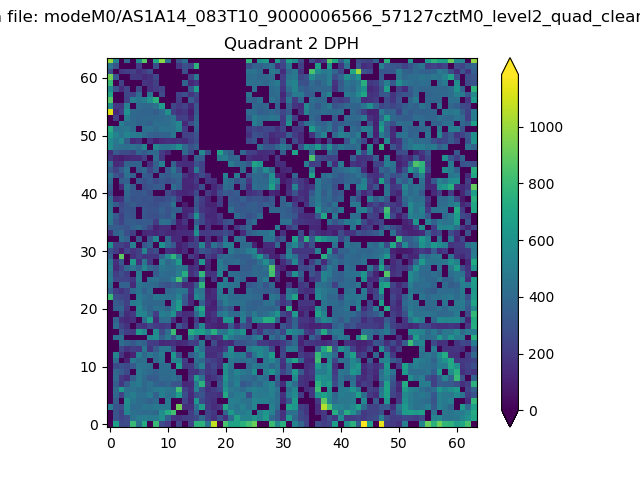 |
Quadrant C |
| Plot type | Count rate plots | Images |
|---|---|---|
| Comparison with Poisson distribution Blue bars denote a histogram of data divided into 1 sec bins. Red curve is a Poisson curve with rate = median count rate of data. |
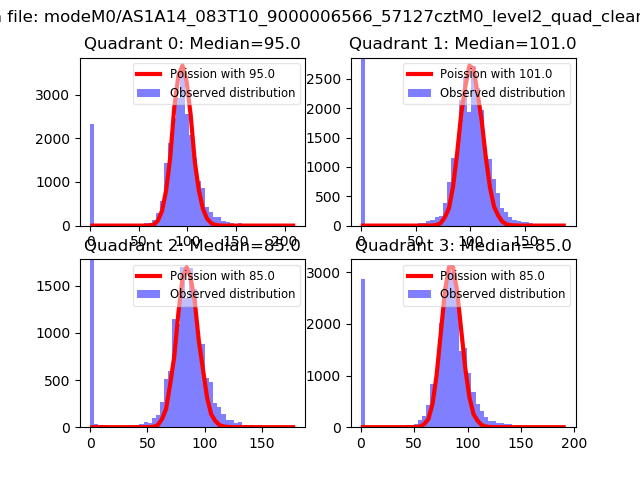 |
 |
| Quadrant-wise count rates Data is divided into 100 sec bins |
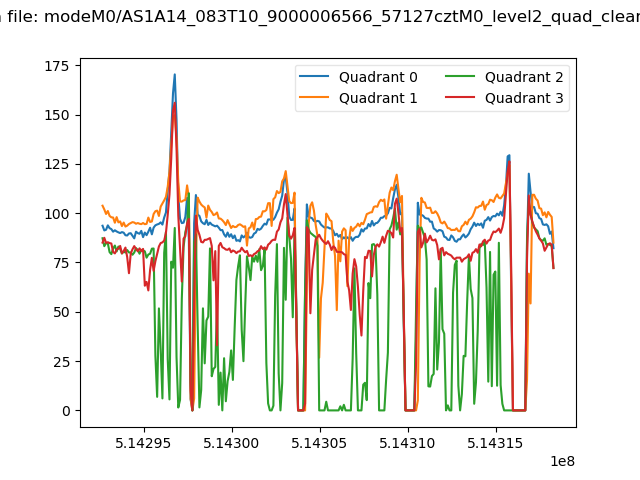 |
|
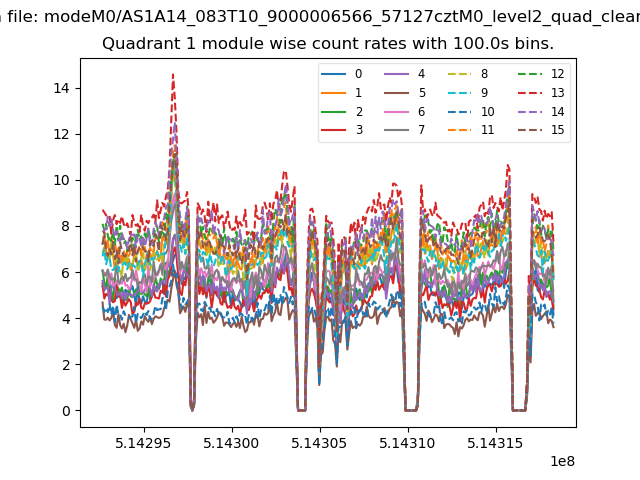
| Module-wise count rates for Quadrant A Data is divided into 100 sec bins |
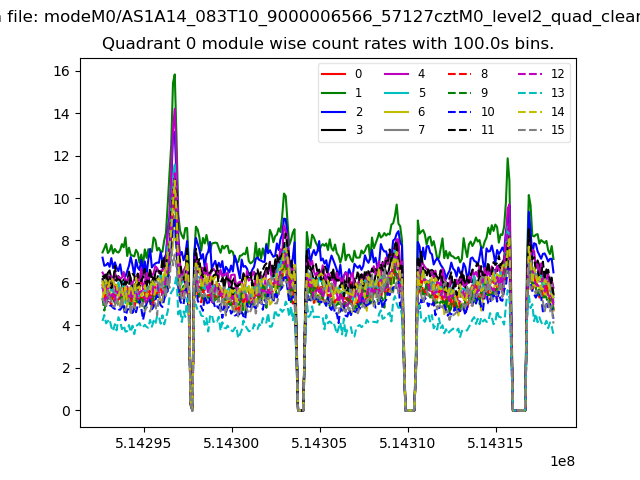 |
 |
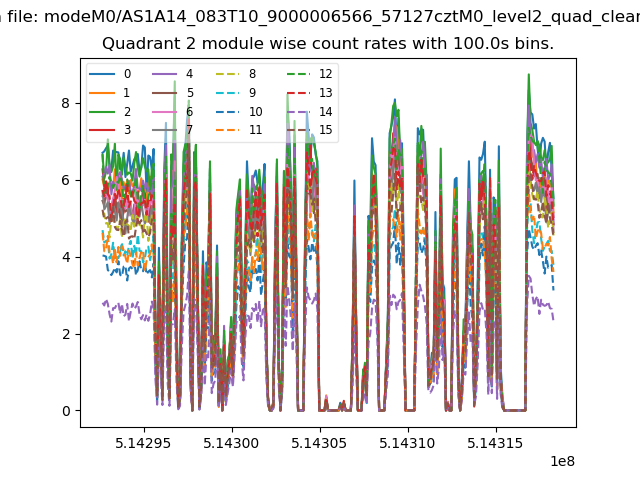
| Module-wise count rates for Quadrant B Data is divided into 100 sec bins |
 |
 |
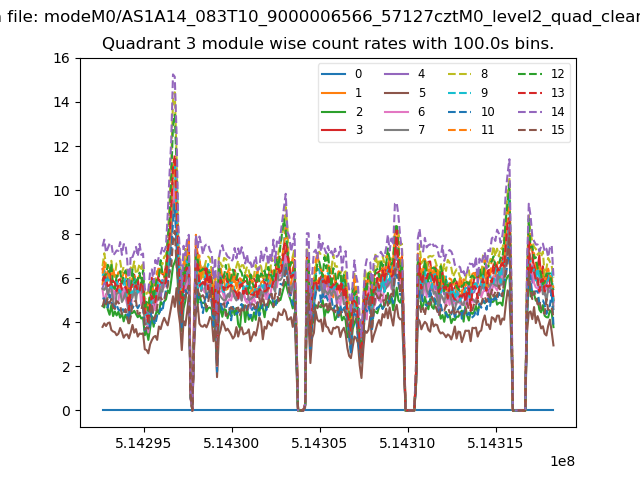
| Module-wise count rates for Quadrant C Data is divided into 100 sec bins |
 |
 |
| Module-wise count rates for Quadrant D Data is divided into 100 sec bins |
 |
 |
| Parameter | Plot |
|---|---|
| CZT HV Monitor | 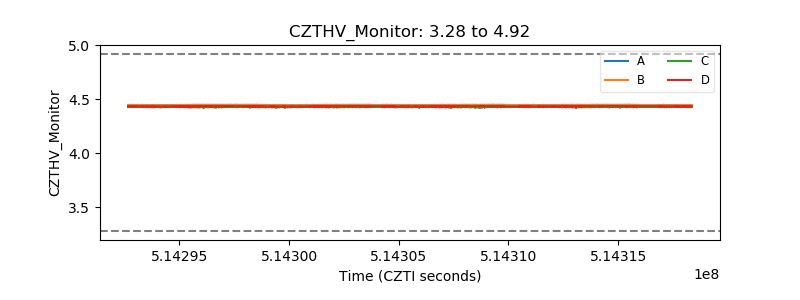 |
| D_VDD | 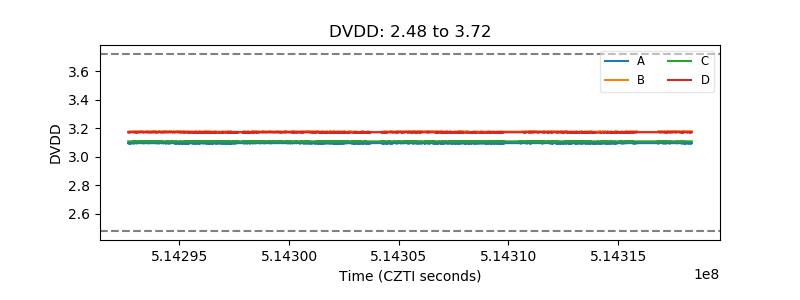 |
| Temperature 1 | 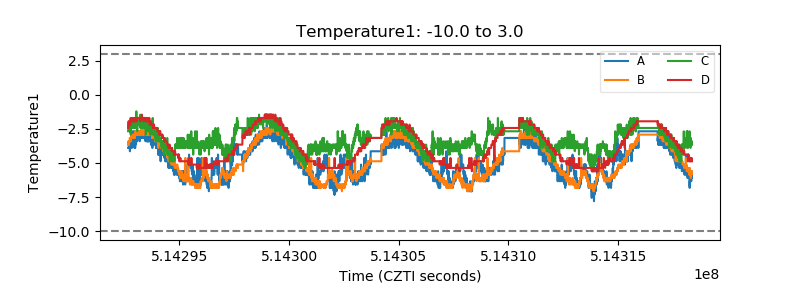 |
| Veto HV Monitor | 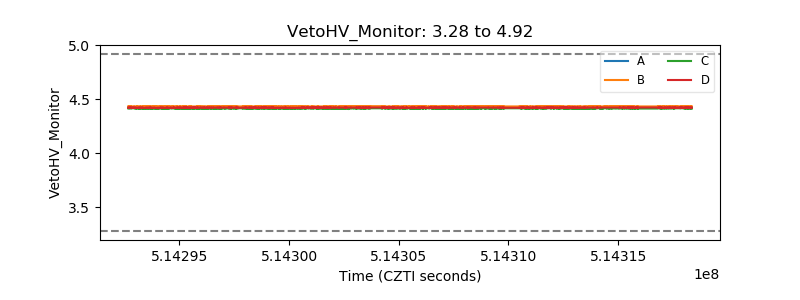 |
| Veto LLD | 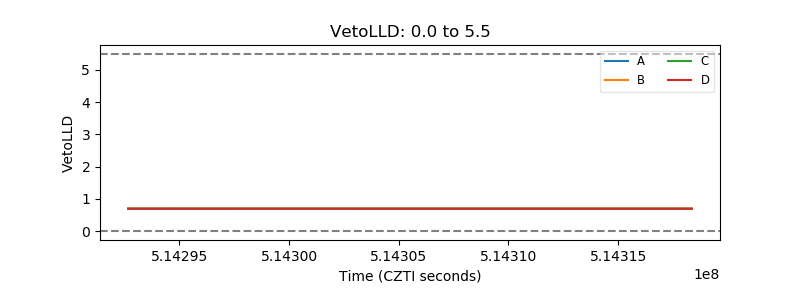 |
| Alpha Counter | 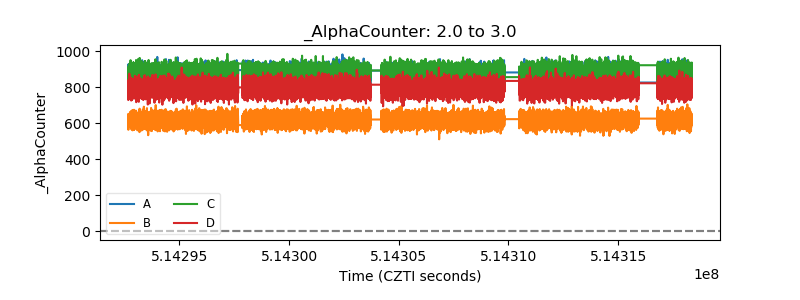 |
| _CPM_Rate | 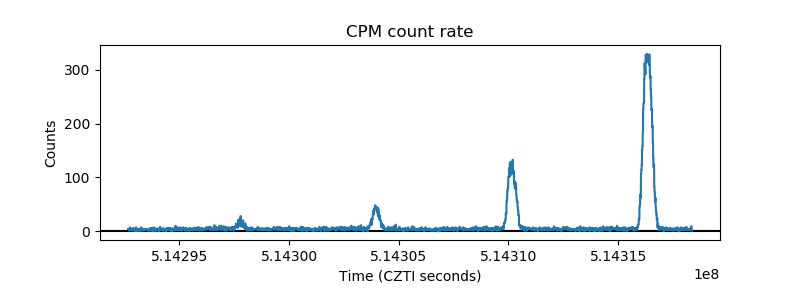 |
| CZT Counter | 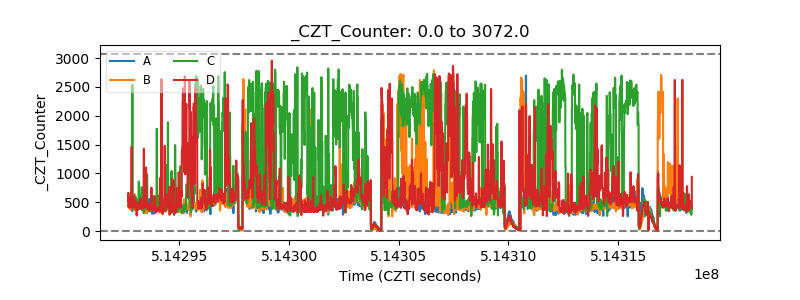 |
| +2.5 Volts monitor | 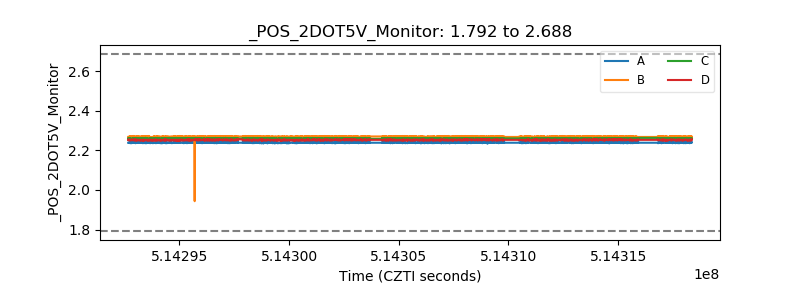 |
| +5 Volts monitor |  |
| _ROLL_ROT | 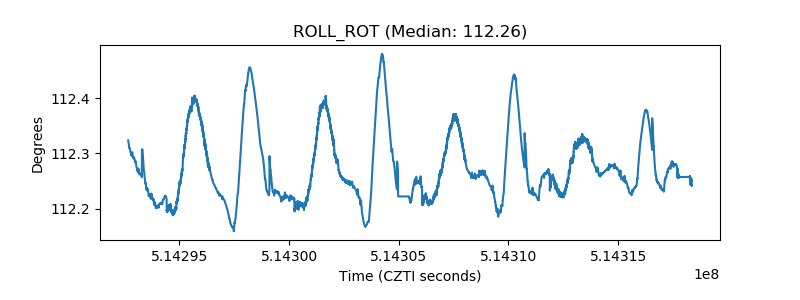 |
| _Roll_DEC | 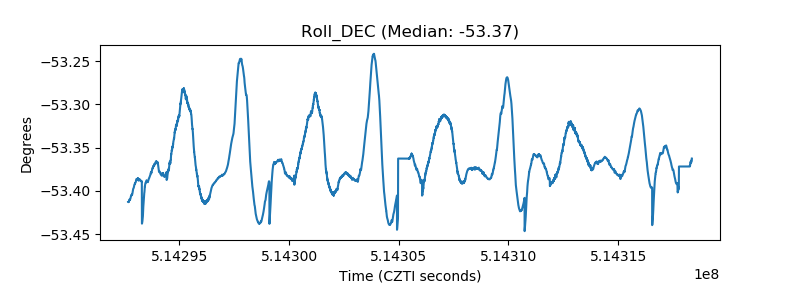 |
| _Roll_RA | 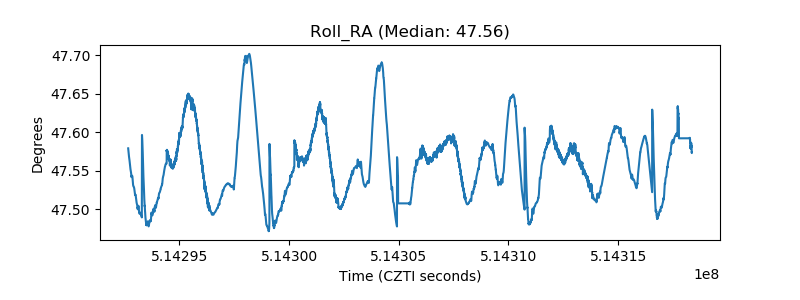 |
| Veto Counter | 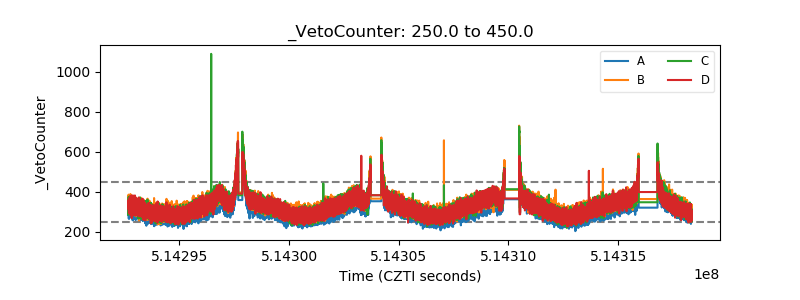 |