| Param | Original file | Final file |
|---|---|---|
| Filename | modeM0/AS1A14_083T10_9000006566_57129cztM0_level2.fits | modeM0/AS1A14_083T10_9000006566_57129cztM0_level2_quad_clean.evt |
| Size (bytes) | 559,143,360 | 89,976,960 |
| Size | 533.2 MB | 85.8 MB |
| Events in quadrant A | 3,159,671 | 646,417 |
| Events in quadrant B | 4,734,019 | 622,889 |
| Events in quadrant C | 7,334,679 | 420,166 |
| Events in quadrant D | 4,955,211 | 574,153 |
| Mode M9 | |||
|---|---|---|---|
| Quadrant | BADHDUFLAG | Total packets | Discarded packets |
| A | 0 | 16 | 0 |
| B | 0 | 17 | 0 |
| C | 0 | 17 | 0 |
| D | 0 | 17 | 0 |
| Mode M0 | |||
|---|---|---|---|
| Quadrant | BADHDUFLAG | Total packets | Discarded packets |
| A | 0 | 13943 | 2 |
| B | 0 | 18684 | 2 |
| C | 0 | 26391 | 7 |
| D | 0 | 19269 | 2 |
| Mode SS | |||
|---|---|---|---|
| Quadrant | BADHDUFLAG | Total packets | Discarded packets |
| A | 0 | 134 | 0 |
| B | 0 | 134 | 0 |
| C | 0 | 134 | 0 |
| D | 0 | 134 | 0 |
| Quadrant | Total seconds | Saturated seconds | Saturation percentage |
|---|---|---|---|
| A | 6611 | 40 | 0.605052% |
| B | 6611 | 695 | 10.512782% |
| C | 6610 | 2279 | 34.478064% |
| D | 6610 | 137 | 2.072617% |
Noise dominated data is calculated using 1-second bins in cleaned event files. If a bin has >2000 counts, and if more than 50% of those come from <1% of pixels, then it is considered to be noise-dominated and hence unusable.
| Quadrant | # 1 sec bins | Bins with >0 counts | Bins with >2000 counts | High rate bins dominated by noise | Noise dominated (total time) | Noise dominated (detector-on time) | Marked lightcurve |
|---|---|---|---|---|---|---|---|
| A | 7636 | 6612 | 14 | 14 | 0.18% | 0.21% | 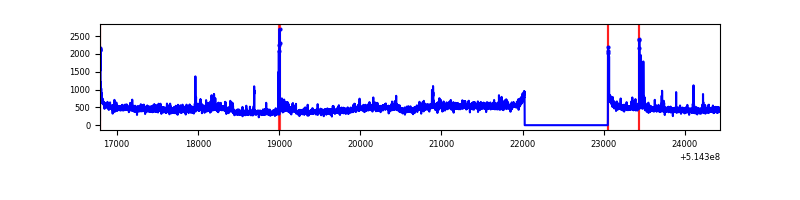 |
| B | 7636 | 6612 | 584 | 584 | 7.65% | 8.83% | 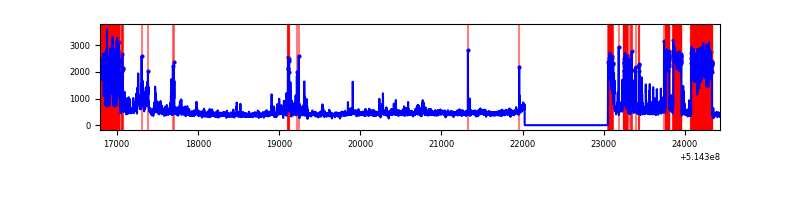 |
| C | 7635 | 6610 | 1470 | 1470 | 19.25% | 22.24% | 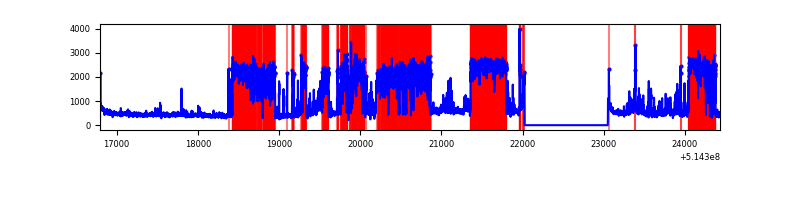 |
| D | 7635 | 6611 | 160 | 160 | 2.10% | 2.42% | 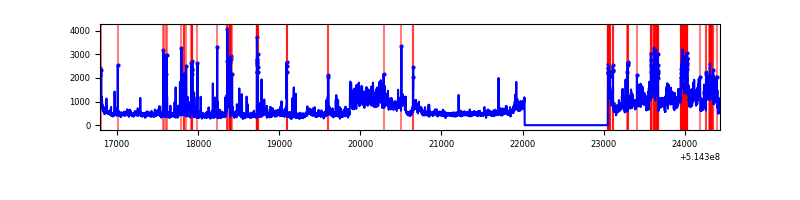 |
Top three noisy pixels from each quadrant. If the there are fewer than three noisy pixels in the level2.evt file, extra rows are filled as -1
| Pixel properties | Quadrant properties | ||||||
|---|---|---|---|---|---|---|---|
| Quadrant | DetID | PixID | Counts | Sigma | Mean | Median | Sigma |
| A | 3 | 14 | 256627 | 1445.45 | 716 | 698 | 177.1 |
| A | 10 | 251 | 50669 | 282.23 | 716 | 698 | 177.1 |
| A | 5 | 113 | 31398 | 173.39 | 716 | 698 | 177.1 |
| B | 10 | 16 | 1092187 | 7466.95 | 674 | 648 | 146.2 |
| B | 5 | 172 | 822383 | 5621.29 | 674 | 648 | 146.2 |
| B | 10 | 247 | 42796 | 288.32 | 674 | 648 | 146.2 |
| C | 15 | 198 | 4142136 | 28742.0 | 521 | 516 | 144.1 |
| C | 12 | 252 | 793283 | 5501.64 | 521 | 516 | 144.1 |
| C | 14 | 67 | 187607 | 1298.37 | 521 | 516 | 144.1 |
| D | 15 | 142 | 1716254 | 8966.23 | 679 | 650 | 191.3 |
| D | 2 | 249 | 139575 | 726.06 | 679 | 650 | 191.3 |
| D | 3 | 160 | 117781 | 612.16 | 679 | 650 | 191.3 |
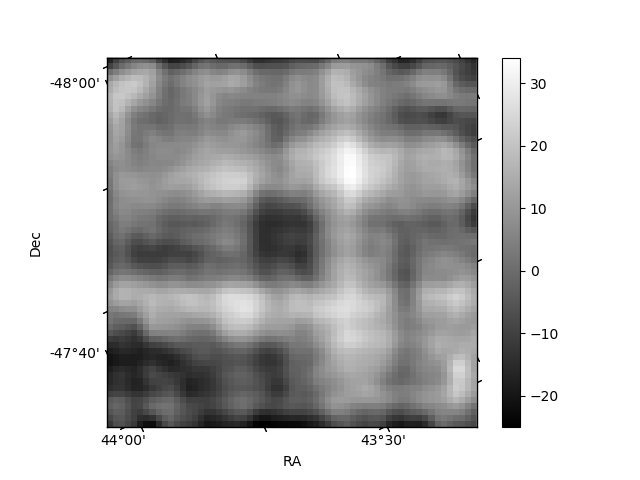
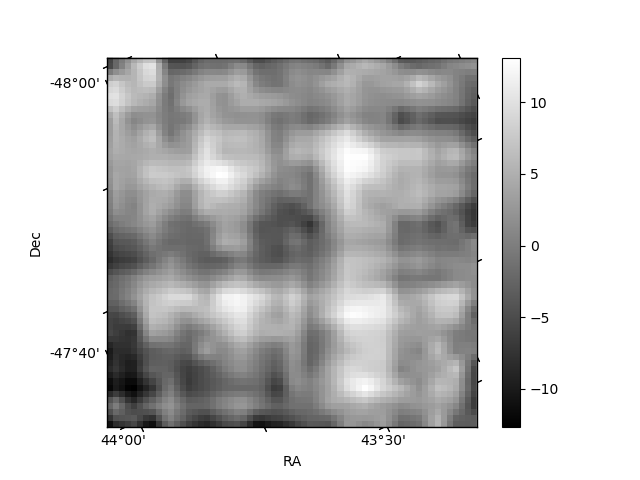
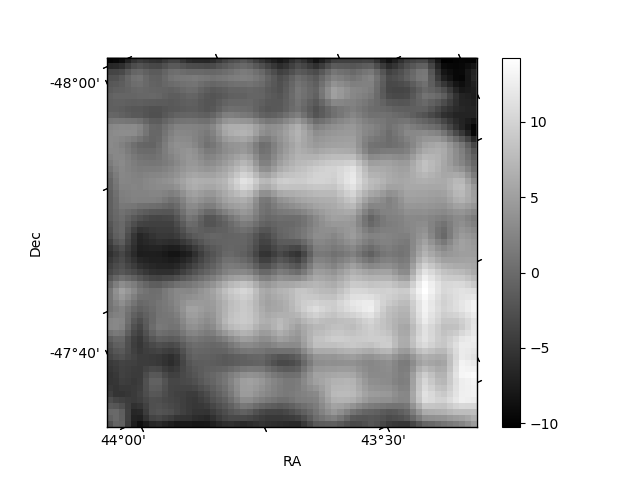
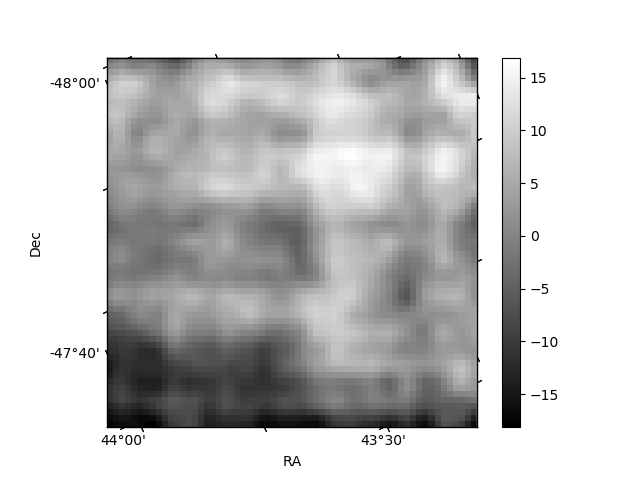
Histogram calculated using DETX and DETY for each event in the final _common_clean file
| Quadrant A | 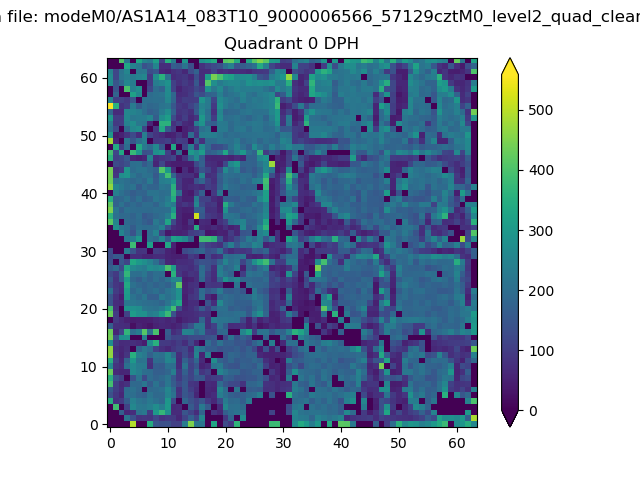 |
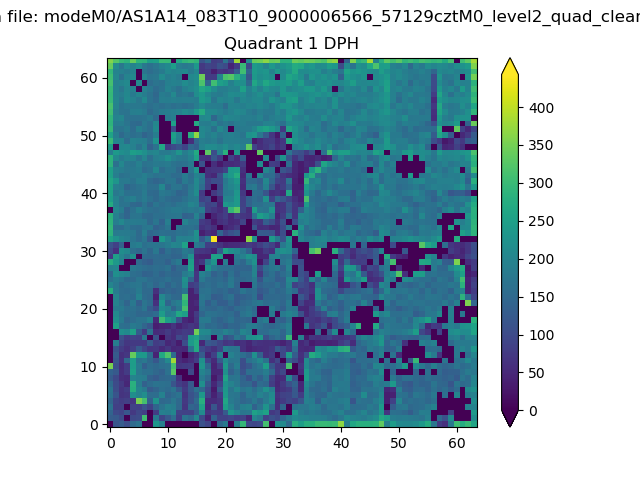 |
Quadrant B |
|---|---|---|---|
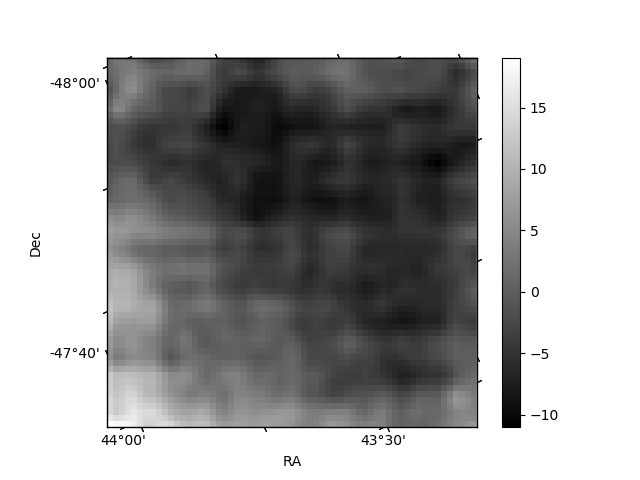
| Quadrant D | 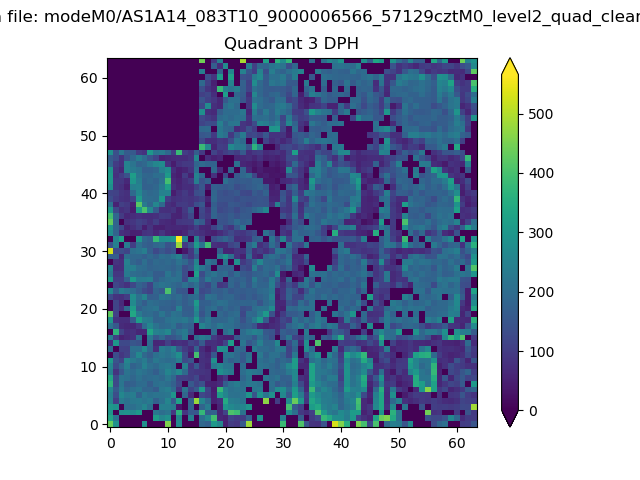 |
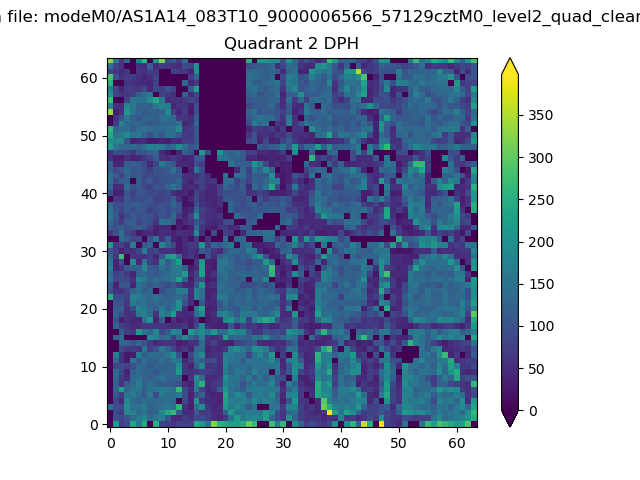 |
Quadrant C |
| Plot type | Count rate plots | Images |
|---|---|---|
| Comparison with Poisson distribution Blue bars denote a histogram of data divided into 1 sec bins. Red curve is a Poisson curve with rate = median count rate of data. |
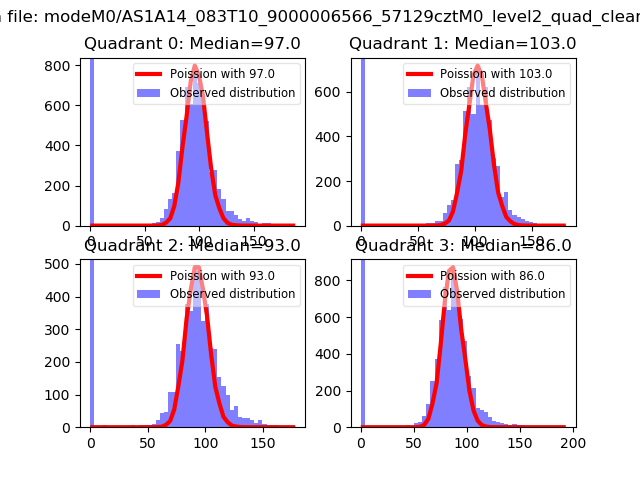 |
 |
| Quadrant-wise count rates Data is divided into 100 sec bins |
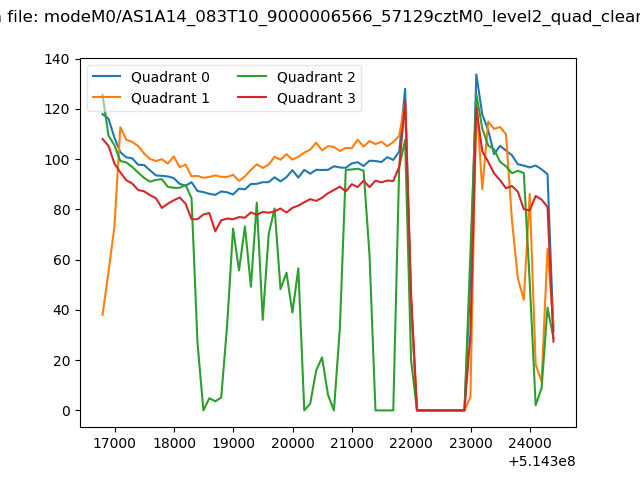 |
|
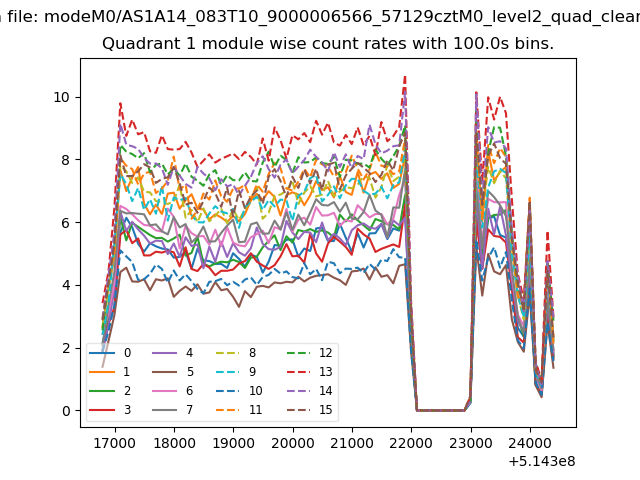
| Module-wise count rates for Quadrant A Data is divided into 100 sec bins |
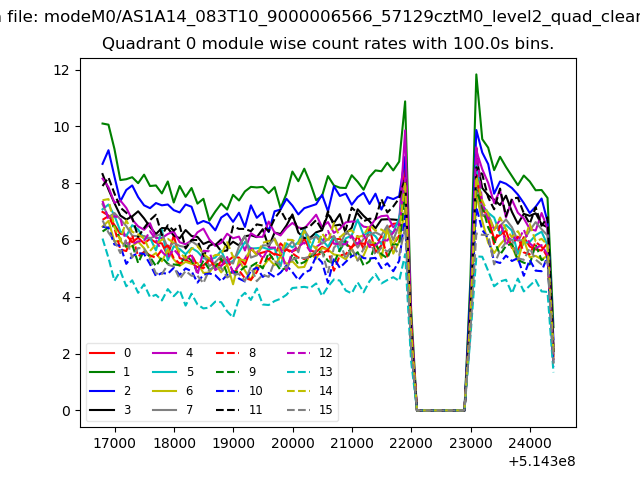 |
 |
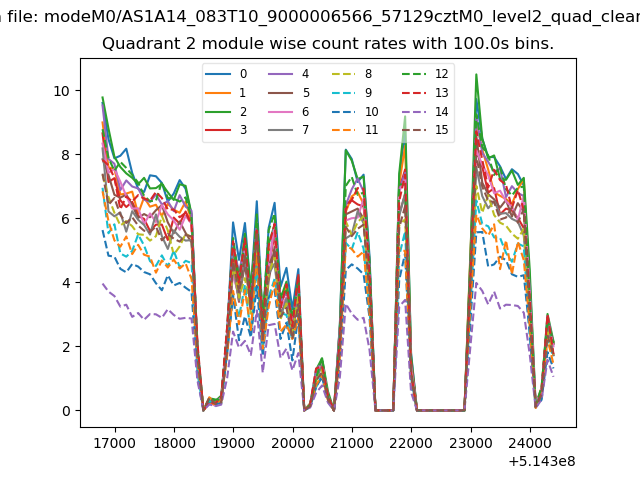
| Module-wise count rates for Quadrant B Data is divided into 100 sec bins |
 |
 |
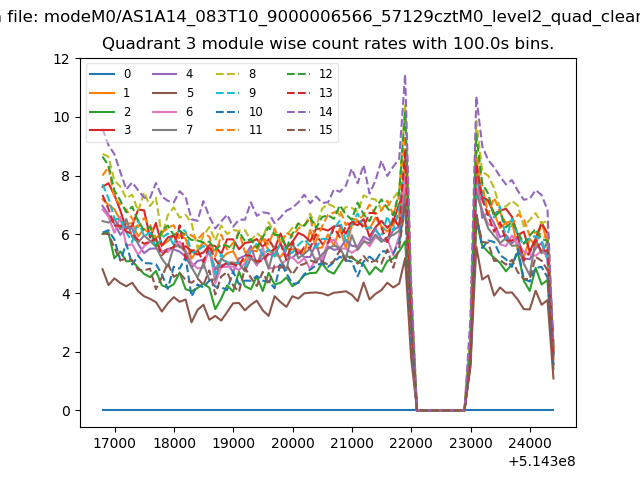
| Module-wise count rates for Quadrant C Data is divided into 100 sec bins |
 |
 |
| Module-wise count rates for Quadrant D Data is divided into 100 sec bins |
 |
 |
| Parameter | Plot |
|---|---|
| CZT HV Monitor | 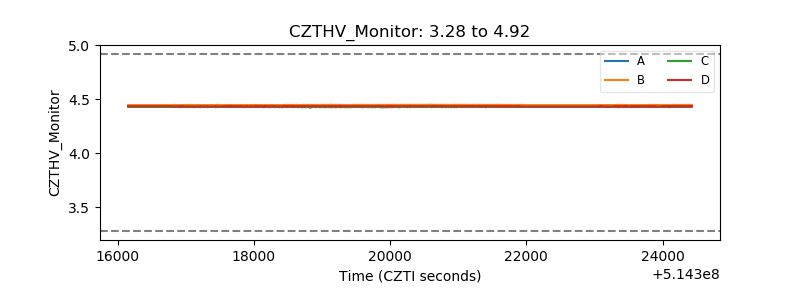 |
| D_VDD | 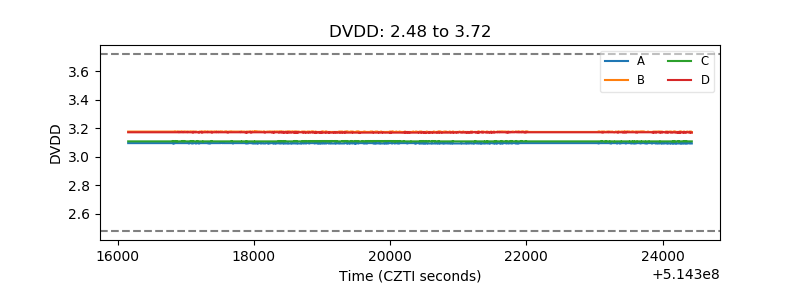 |
| Temperature 1 | 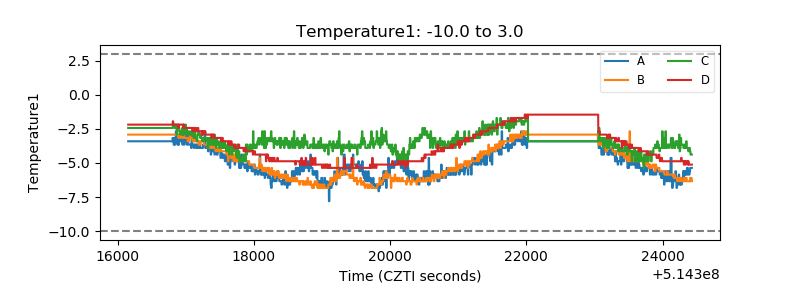 |
| Veto HV Monitor | 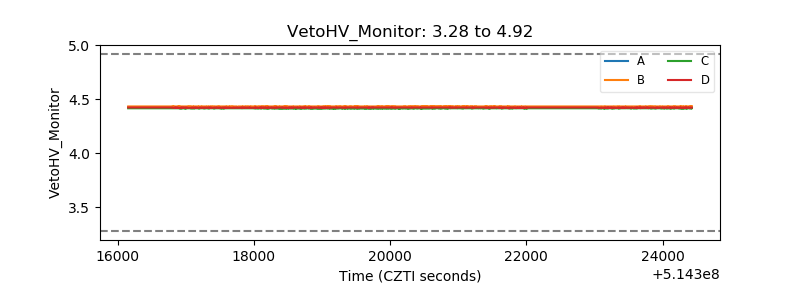 |
| Veto LLD | 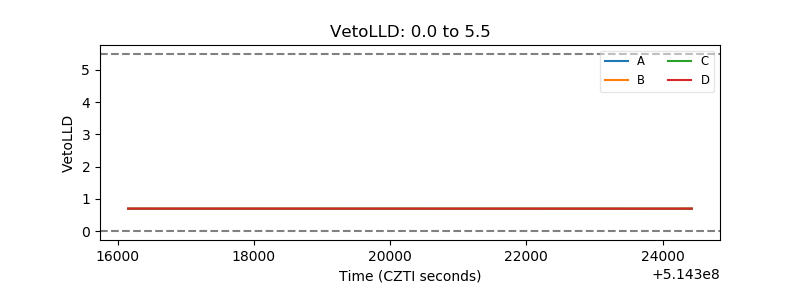 |
| Alpha Counter | 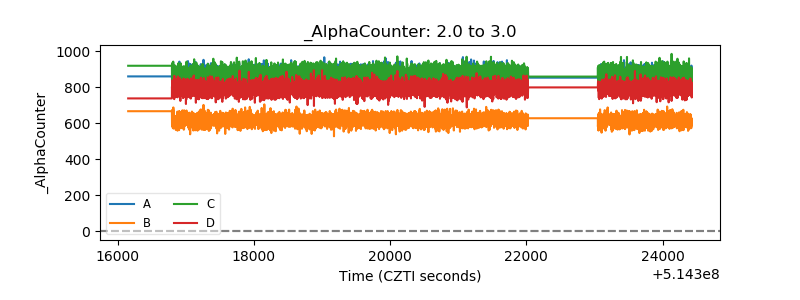 |
| _CPM_Rate | 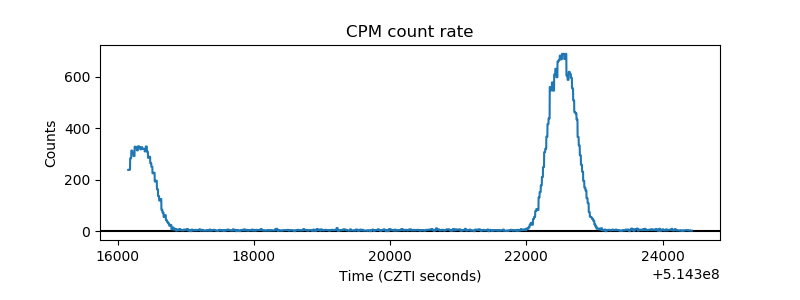 |
| CZT Counter | 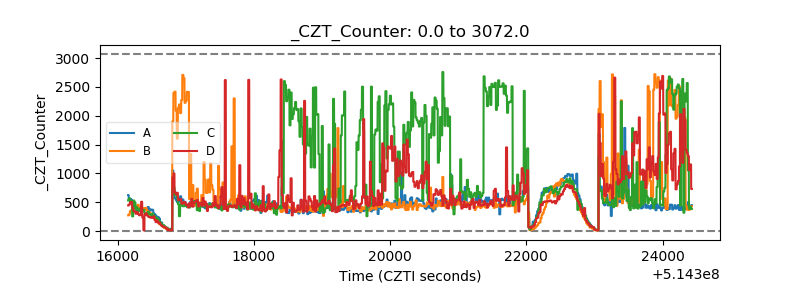 |
| +2.5 Volts monitor | 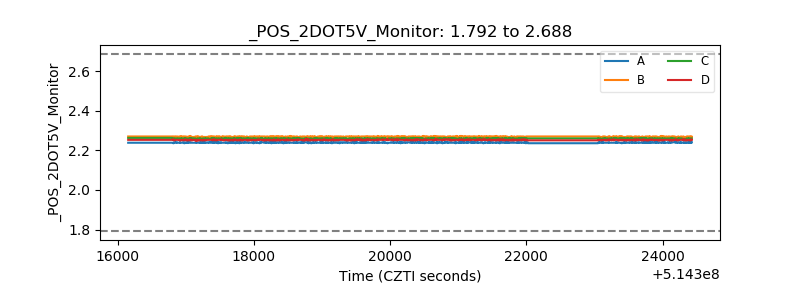 |
| +5 Volts monitor |  |
| _ROLL_ROT | 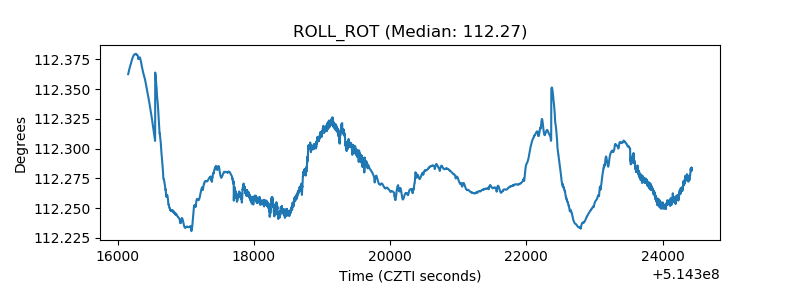 |
| _Roll_DEC | 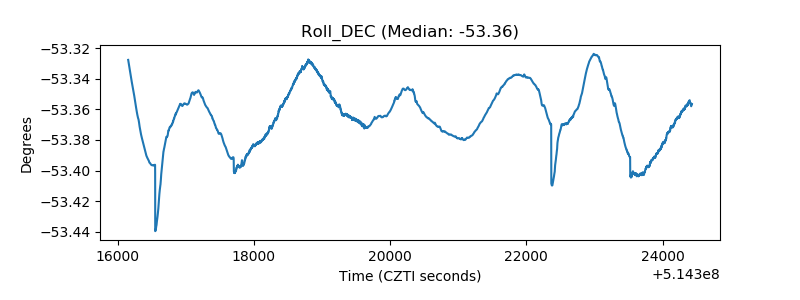 |
| _Roll_RA | 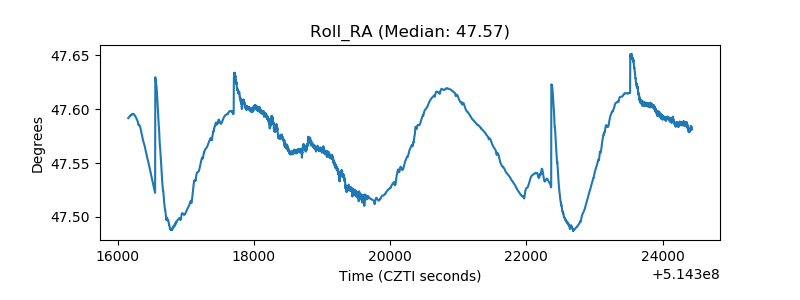 |
| Veto Counter | 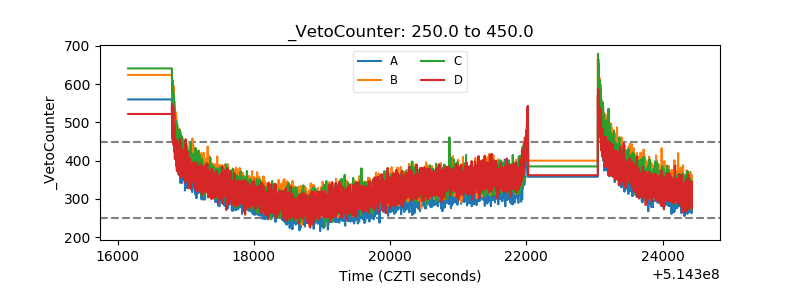 |