| Param | Original file | Final file |
|---|---|---|
| Filename | modeM0/AS1A14_083T10_9000006566_57130cztM0_level2.fits | modeM0/AS1A14_083T10_9000006566_57130cztM0_level2_quad_clean.evt |
| Size (bytes) | 764,815,680 | 79,850,880 |
| Size | 729.4 MB | 76.2 MB |
| Events in quadrant A | 2,880,454 | 632,265 |
| Events in quadrant B | 8,440,733 | 516,563 |
| Events in quadrant C | 9,558,226 | 289,916 |
| Events in quadrant D | 6,935,694 | 532,002 |
| Mode M9 | |||
|---|---|---|---|
| Quadrant | BADHDUFLAG | Total packets | Discarded packets |
| A | 0 | 11 | 0 |
| B | 0 | 11 | 0 |
| C | 0 | 11 | 0 |
| D | 0 | 11 | 0 |
| Mode M0 | |||
|---|---|---|---|
| Quadrant | BADHDUFLAG | Total packets | Discarded packets |
| A | 0 | 13178 | 1 |
| B | 0 | 29455 | 1 |
| C | 0 | 32794 | 2 |
| D | 0 | 24969 | 1 |
| Mode SS | |||
|---|---|---|---|
| Quadrant | BADHDUFLAG | Total packets | Discarded packets |
| A | 0 | 132 | 0 |
| B | 0 | 132 | 0 |
| C | 0 | 132 | 0 |
| D | 0 | 132 | 0 |
| Quadrant | Total seconds | Saturated seconds | Saturation percentage |
|---|---|---|---|
| A | 6399 | 21 | 0.328176% |
| B | 6400 | 2068 | 32.312500% |
| C | 6399 | 3446 | 53.852164% |
| D | 6399 | 441 | 6.891702% |
Noise dominated data is calculated using 1-second bins in cleaned event files. If a bin has >2000 counts, and if more than 50% of those come from <1% of pixels, then it is considered to be noise-dominated and hence unusable.
| Quadrant | # 1 sec bins | Bins with >0 counts | Bins with >2000 counts | High rate bins dominated by noise | Noise dominated (total time) | Noise dominated (detector-on time) | Marked lightcurve |
|---|---|---|---|---|---|---|---|
| A | 7534 | 6399 | 9 | 9 | 0.12% | 0.14% | 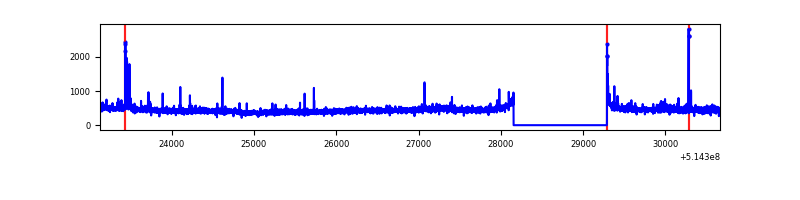 |
| B | 7535 | 6400 | 1718 | 1718 | 22.80% | 26.84% | 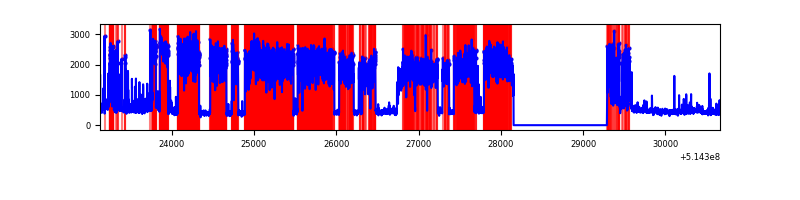 |
| C | 7534 | 6399 | 3004 | 3004 | 39.87% | 46.94% | 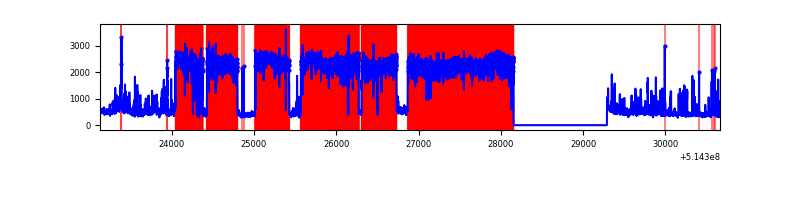 |
| D | 7534 | 6400 | 594 | 594 | 7.88% | 9.28% | 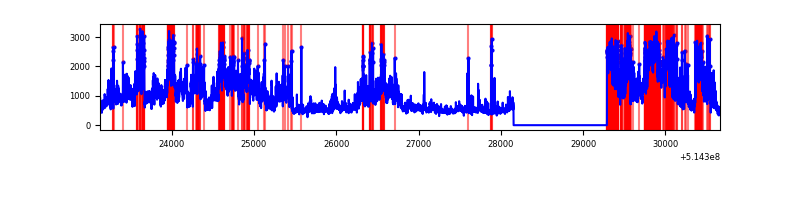 |
Top three noisy pixels from each quadrant. If the there are fewer than three noisy pixels in the level2.evt file, extra rows are filled as -1
| Pixel properties | Quadrant properties | ||||||
|---|---|---|---|---|---|---|---|
| Quadrant | DetID | PixID | Counts | Sigma | Mean | Median | Sigma |
| A | 3 | 14 | 94566 | 546.55 | 695 | 676 | 171.8 |
| A | 10 | 251 | 54331 | 312.34 | 695 | 676 | 171.8 |
| A | 5 | 113 | 23982 | 135.67 | 695 | 676 | 171.8 |
| B | 5 | 172 | 5203479 | 37569.55 | 642 | 619 | 138.5 |
| B | 10 | 16 | 434602 | 3133.77 | 642 | 619 | 138.5 |
| B | 0 | 213 | 97684 | 700.9 | 642 | 619 | 138.5 |
| C | 15 | 198 | 7361587 | 64715.31 | 411 | 407 | 113.7 |
| C | 12 | 252 | 303623 | 2665.7 | 411 | 407 | 113.7 |
| C | 6 | 223 | 134470 | 1178.61 | 411 | 407 | 113.7 |
| D | 15 | 142 | 3808674 | 20680.01 | 649 | 619 | 184.1 |
| D | 2 | 249 | 170145 | 920.63 | 649 | 619 | 184.1 |
| D | 12 | 33 | 86636 | 467.12 | 649 | 619 | 184.1 |
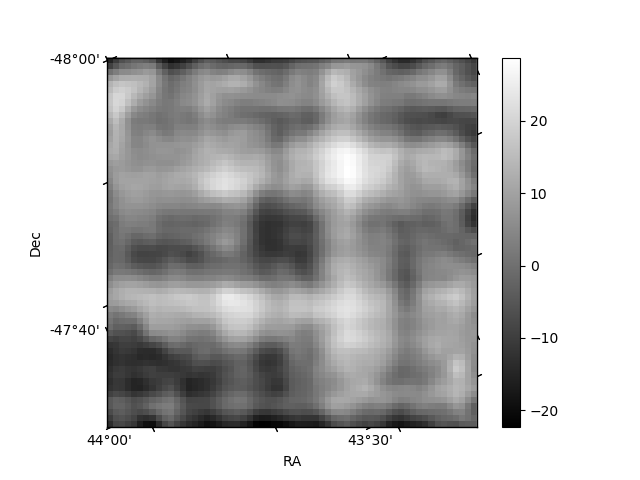
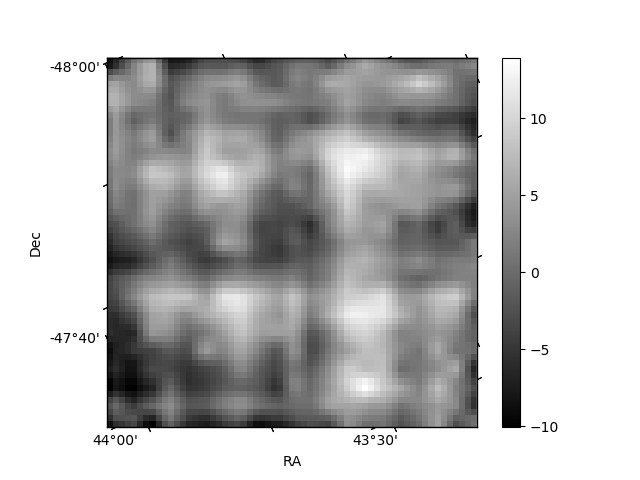
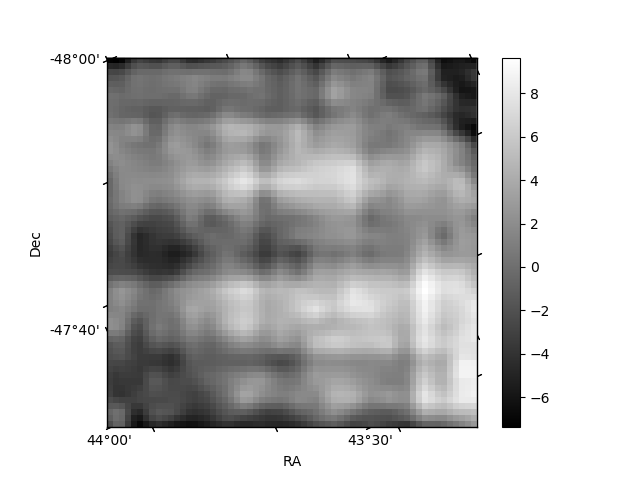
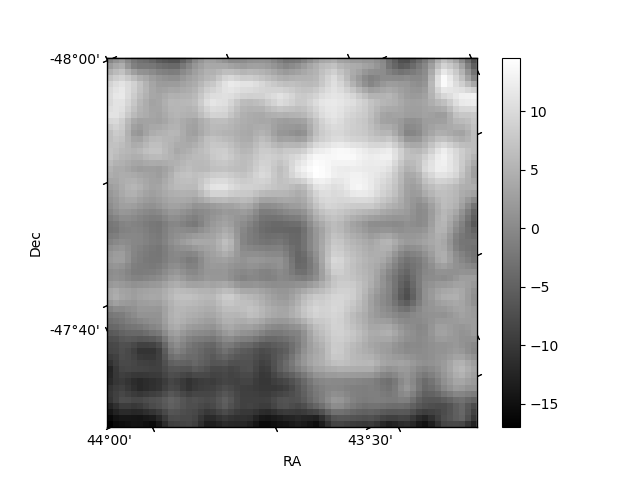
Histogram calculated using DETX and DETY for each event in the final _common_clean file
| Quadrant A | 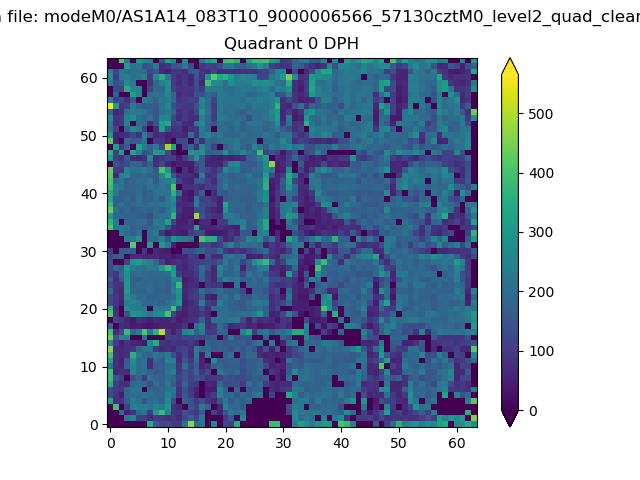 |
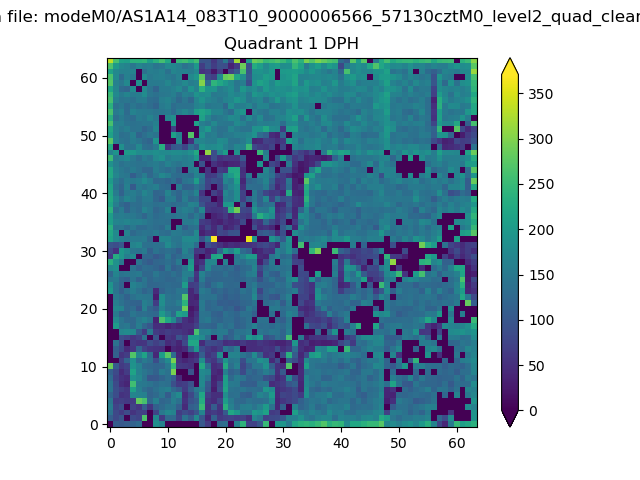 |
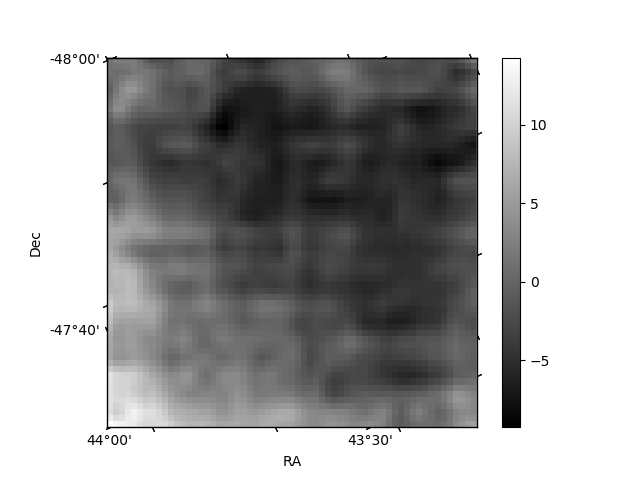
Quadrant B |
|---|---|---|---|
| Quadrant D | 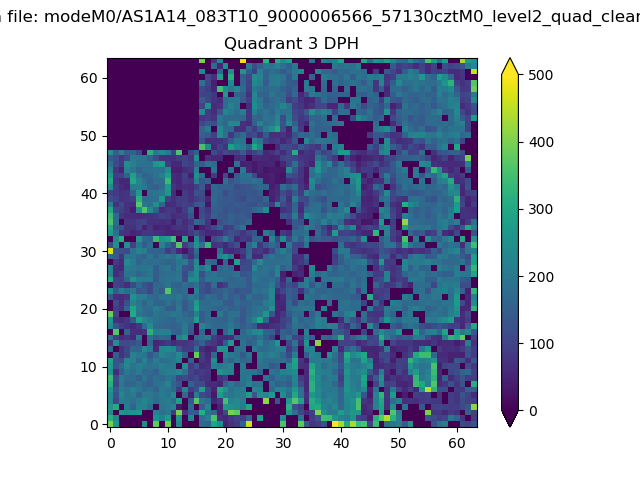 |
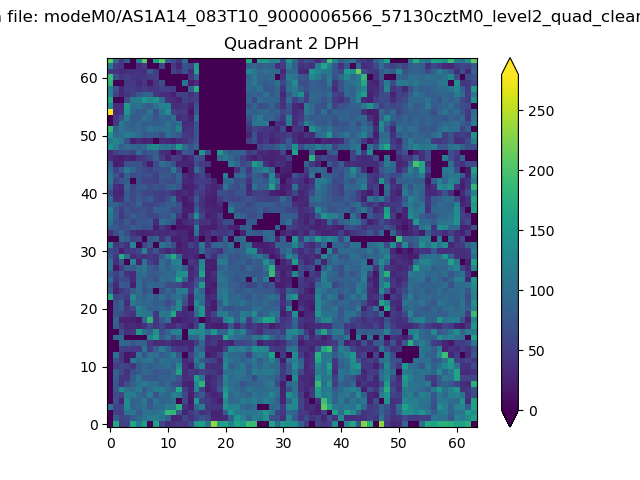 |
Quadrant C |
| Plot type | Count rate plots | Images |
|---|---|---|
| Comparison with Poisson distribution Blue bars denote a histogram of data divided into 1 sec bins. Red curve is a Poisson curve with rate = median count rate of data. |
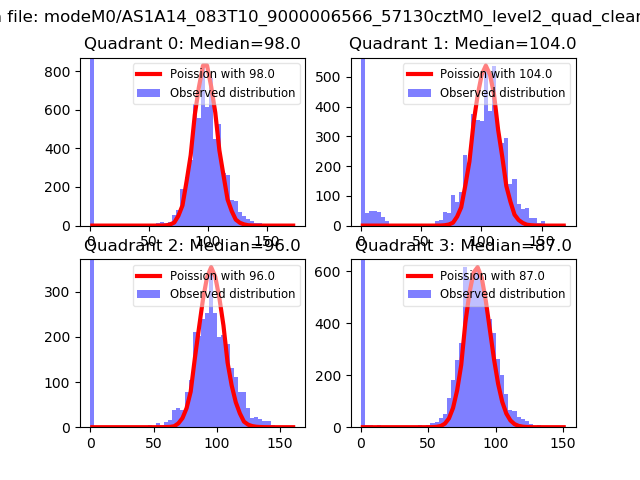 |
 |
| Quadrant-wise count rates Data is divided into 100 sec bins |
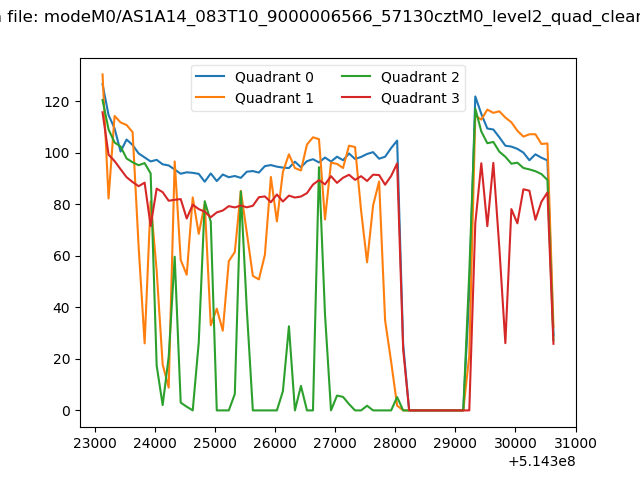 |
|
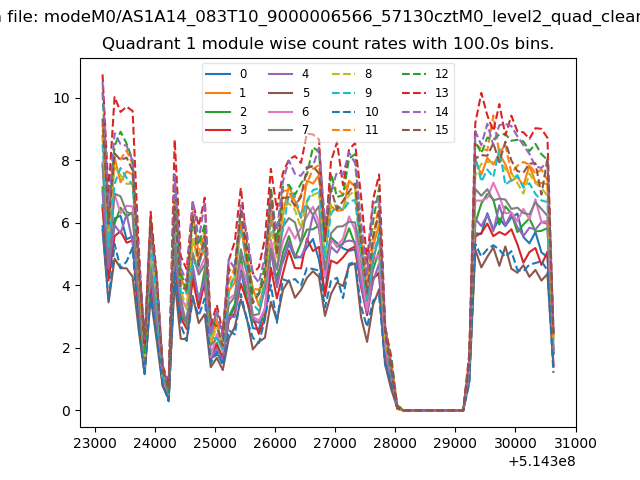
| Module-wise count rates for Quadrant A Data is divided into 100 sec bins |
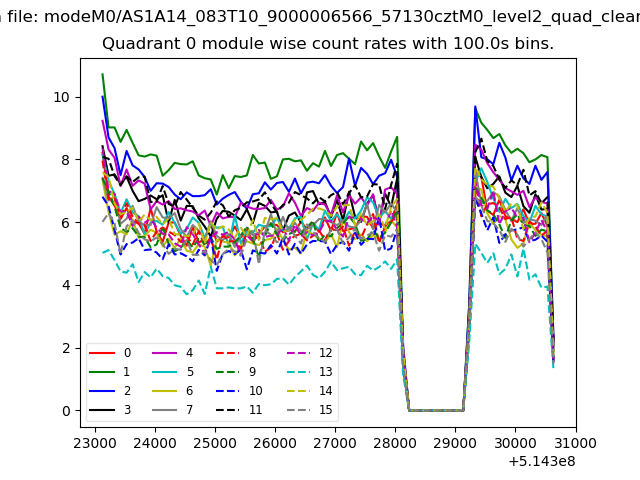 |
 |
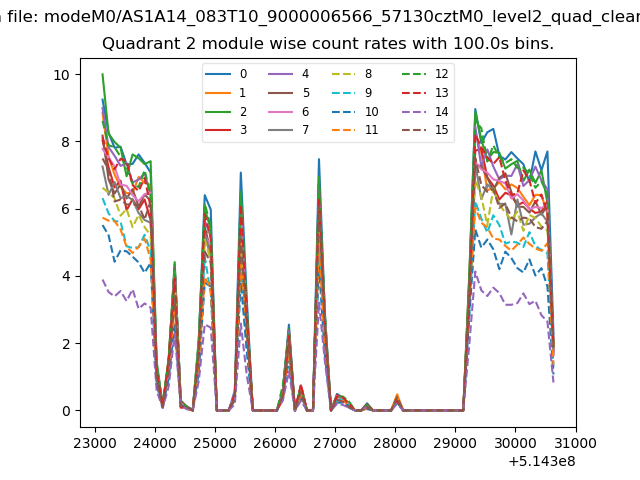
| Module-wise count rates for Quadrant B Data is divided into 100 sec bins |
 |
 |
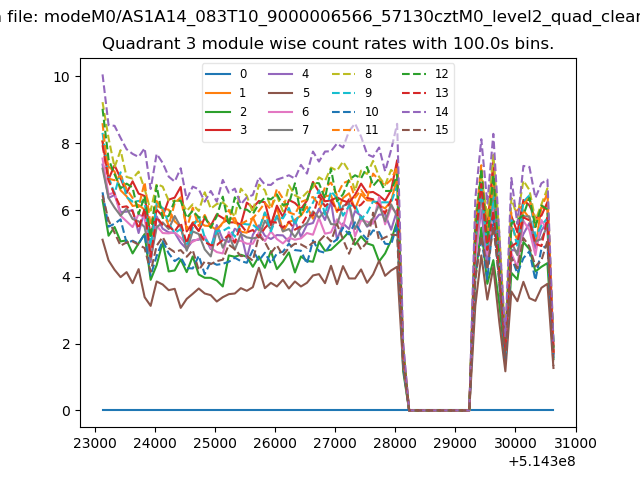
| Module-wise count rates for Quadrant C Data is divided into 100 sec bins |
 |
 |
| Module-wise count rates for Quadrant D Data is divided into 100 sec bins |
 |
 |
| Parameter | Plot |
|---|---|
| CZT HV Monitor | 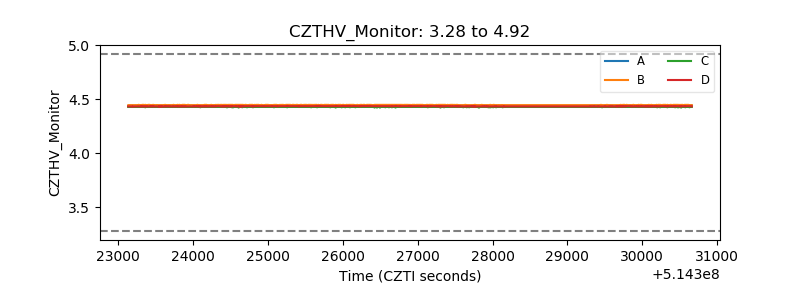 |
| D_VDD | 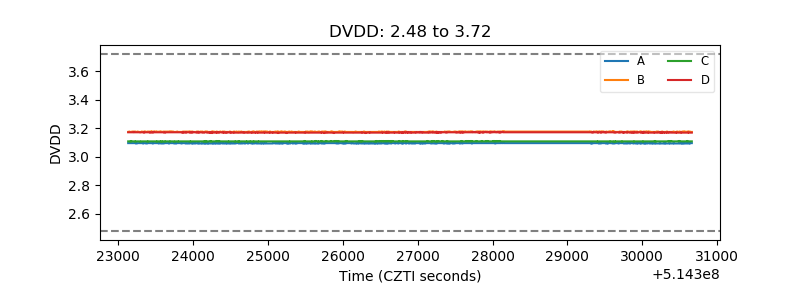 |
| Temperature 1 | 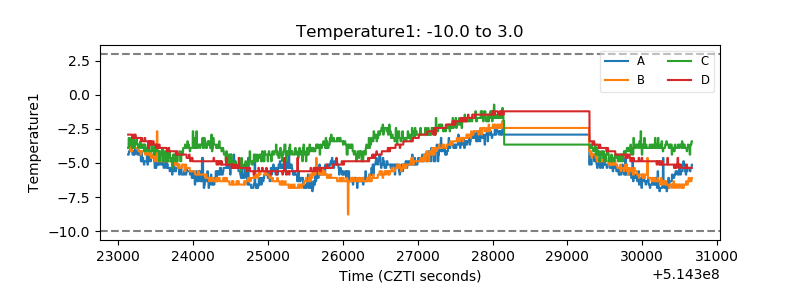 |
| Veto HV Monitor | 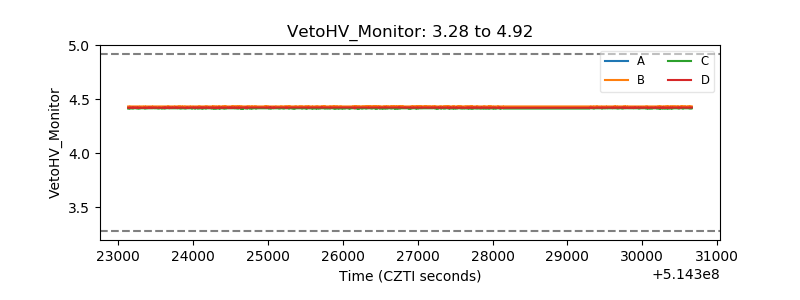 |
| Veto LLD | 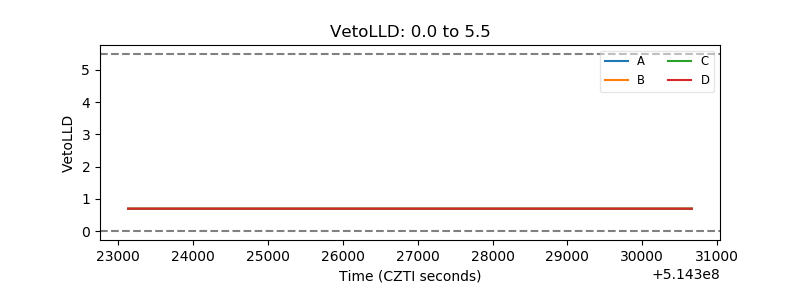 |
| Alpha Counter | 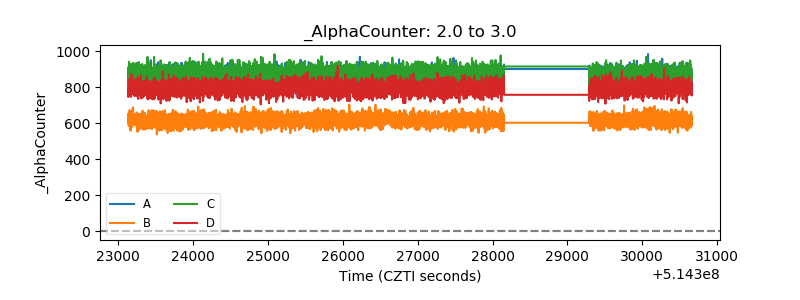 |
| _CPM_Rate | 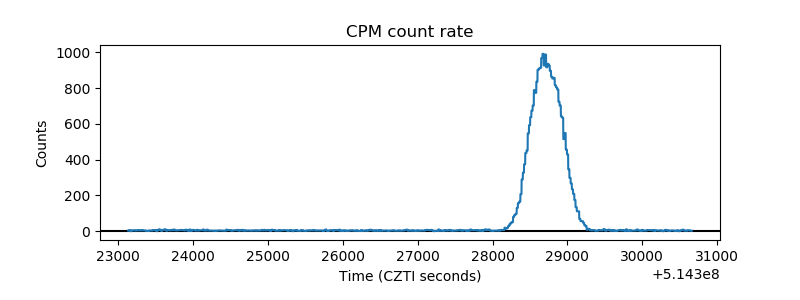 |
| CZT Counter | 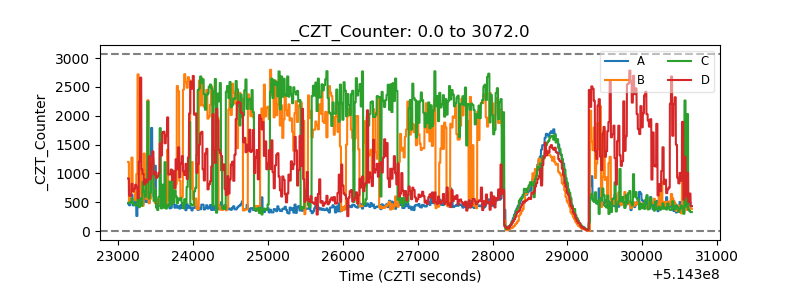 |
| +2.5 Volts monitor | 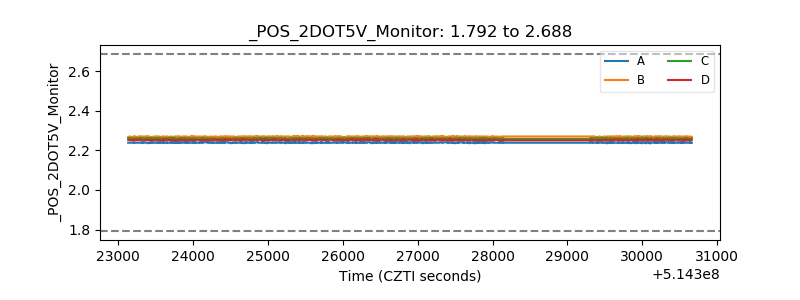 |
| +5 Volts monitor |  |
| _ROLL_ROT | 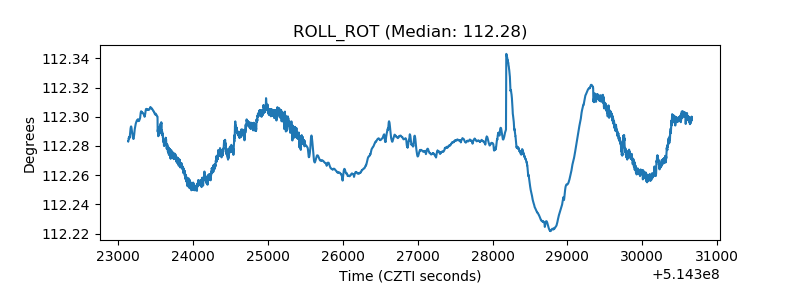 |
| _Roll_DEC | 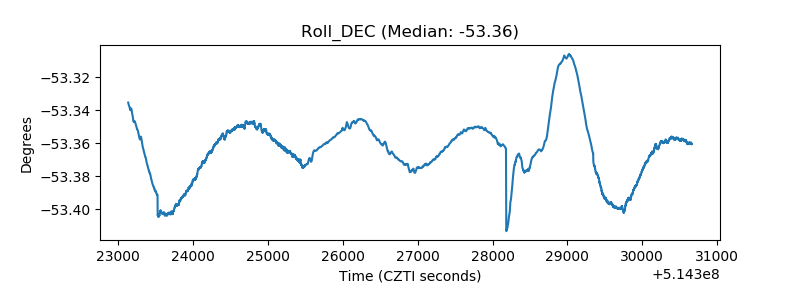 |
| _Roll_RA | 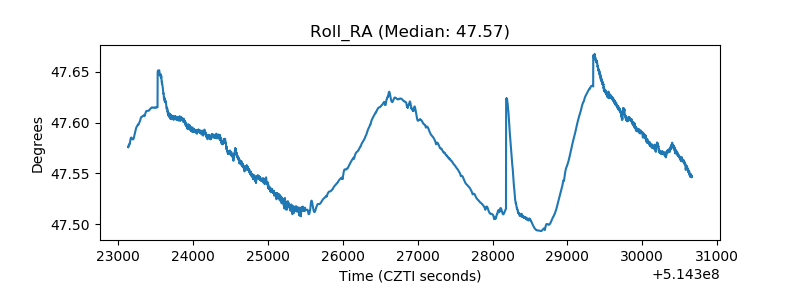 |
| Veto Counter | 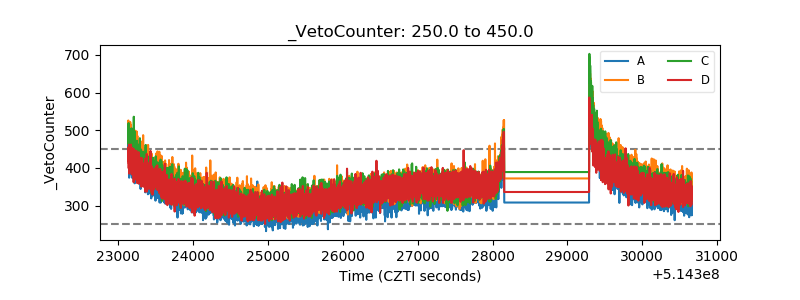 |