| Param | Original file | Final file |
|---|---|---|
| Filename | modeM0/AS1A14_083T10_9000006566_57132cztM0_level2.fits | modeM0/AS1A14_083T10_9000006566_57132cztM0_level2_quad_clean.evt |
| Size (bytes) | 585,017,280 | 88,277,760 |
| Size | 557.9 MB | 84.2 MB |
| Events in quadrant A | 3,062,928 | 652,986 |
| Events in quadrant B | 3,774,820 | 678,488 |
| Events in quadrant C | 6,291,429 | 435,668 |
| Events in quadrant D | 8,022,911 | 454,240 |
| Mode M9 | |||
|---|---|---|---|
| Quadrant | BADHDUFLAG | Total packets | Discarded packets |
| A | 0 | 24 | 0 |
| B | 0 | 24 | 0 |
| C | 0 | 24 | 0 |
| D | 0 | 24 | 0 |
| Mode M0 | |||
|---|---|---|---|
| Quadrant | BADHDUFLAG | Total packets | Discarded packets |
| A | 0 | 13840 | 2 |
| B | 0 | 15647 | 3 |
| C | 0 | 23181 | 2 |
| D | 0 | 28385 | 2 |
| Mode SS | |||
|---|---|---|---|
| Quadrant | BADHDUFLAG | Total packets | Discarded packets |
| A | 0 | 134 | 0 |
| B | 0 | 134 | 0 |
| C | 0 | 134 | 0 |
| D | 0 | 134 | 0 |
| Quadrant | Total seconds | Saturated seconds | Saturation percentage |
|---|---|---|---|
| A | 6472 | 58 | 0.896168% |
| B | 6471 | 313 | 4.836965% |
| C | 6471 | 1991 | 30.768042% |
| D | 6471 | 1589 | 24.555710% |
Noise dominated data is calculated using 1-second bins in cleaned event files. If a bin has >2000 counts, and if more than 50% of those come from <1% of pixels, then it is considered to be noise-dominated and hence unusable.
| Quadrant | # 1 sec bins | Bins with >0 counts | Bins with >2000 counts | High rate bins dominated by noise | Noise dominated (total time) | Noise dominated (detector-on time) | Marked lightcurve |
|---|---|---|---|---|---|---|---|
| A | 8852 | 6473 | 17 | 17 | 0.19% | 0.26% | 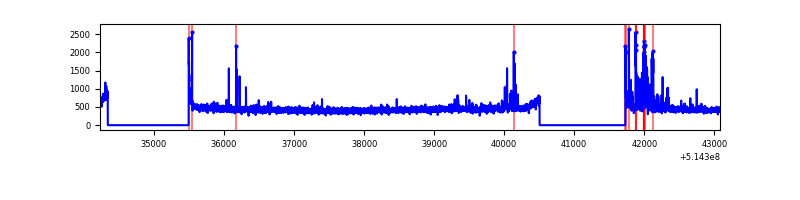 |
| B | 8851 | 6472 | 219 | 219 | 2.47% | 3.38% | 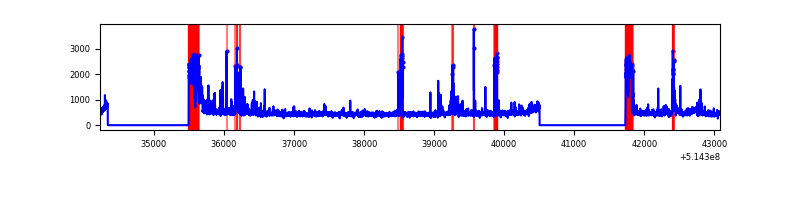 |
| C | 8850 | 6470 | 1351 | 1351 | 15.27% | 20.88% | 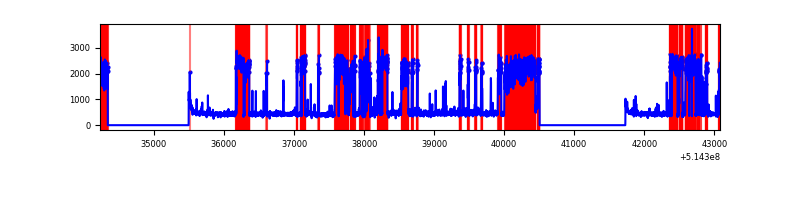 |
| D | 8851 | 6472 | 1614 | 1614 | 18.24% | 24.94% | 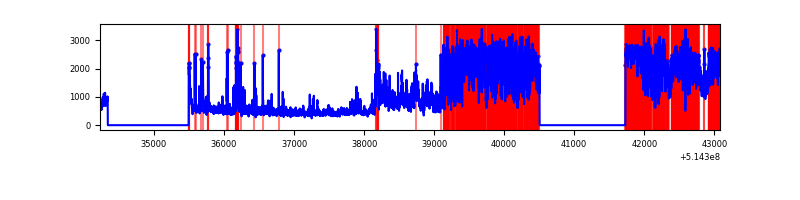 |
Top three noisy pixels from each quadrant. If the there are fewer than three noisy pixels in the level2.evt file, extra rows are filled as -1
| Pixel properties | Quadrant properties | ||||||
|---|---|---|---|---|---|---|---|
| Quadrant | DetID | PixID | Counts | Sigma | Mean | Median | Sigma |
| A | 3 | 14 | 158828 | 893.86 | 725 | 706 | 176.9 |
| A | 10 | 251 | 49766 | 277.34 | 725 | 706 | 176.9 |
| A | 5 | 113 | 18639 | 101.38 | 725 | 706 | 176.9 |
| B | 10 | 16 | 695115 | 4695.89 | 698 | 673 | 147.9 |
| B | 0 | 213 | 114193 | 767.63 | 698 | 673 | 147.9 |
| B | 5 | 185 | 68870 | 461.16 | 698 | 673 | 147.9 |
| C | 15 | 198 | 4108280 | 29479.81 | 508 | 503 | 139.3 |
| C | 12 | 252 | 105994 | 757.07 | 508 | 503 | 139.3 |
| C | 14 | 67 | 49305 | 350.23 | 508 | 503 | 139.3 |
| D | 15 | 142 | 3250634 | 18113.95 | 630 | 600 | 179.4 |
| D | 12 | 33 | 1747262 | 9734.96 | 630 | 600 | 179.4 |
| D | 2 | 249 | 223269 | 1241.04 | 630 | 600 | 179.4 |
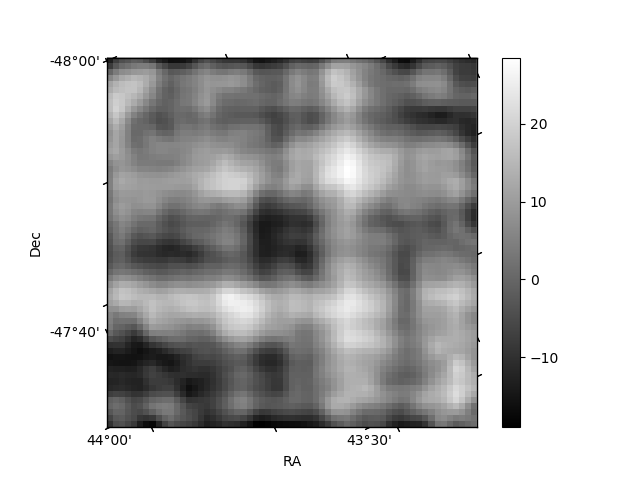
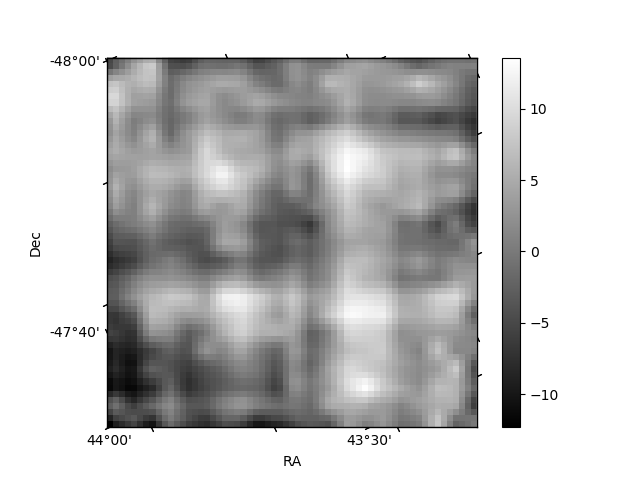
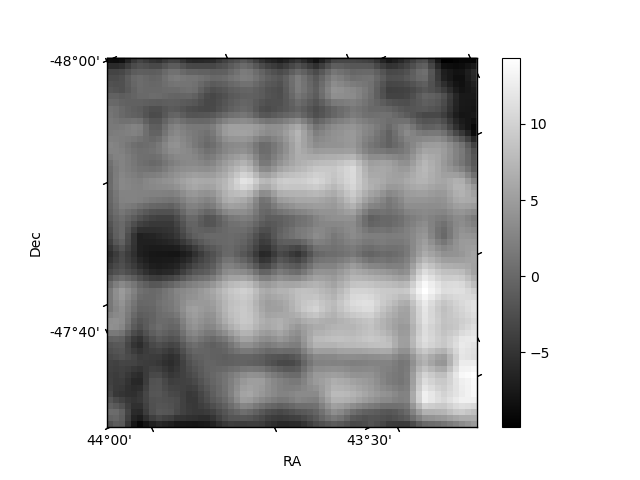
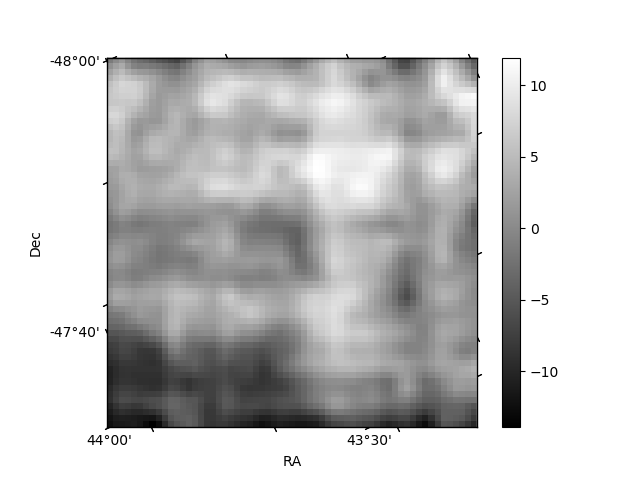
Histogram calculated using DETX and DETY for each event in the final _common_clean file
| Quadrant A | 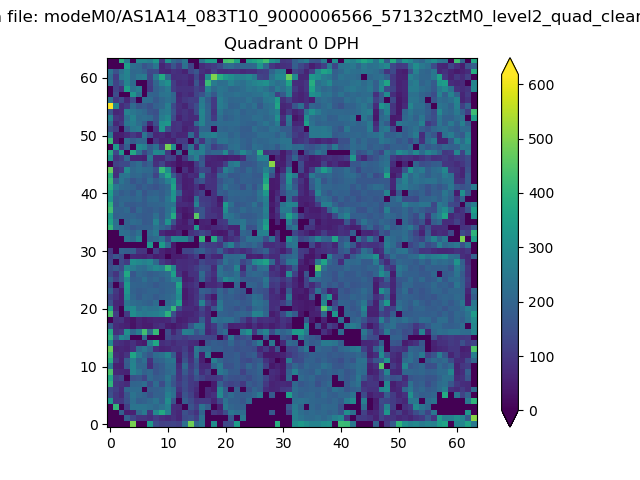 |
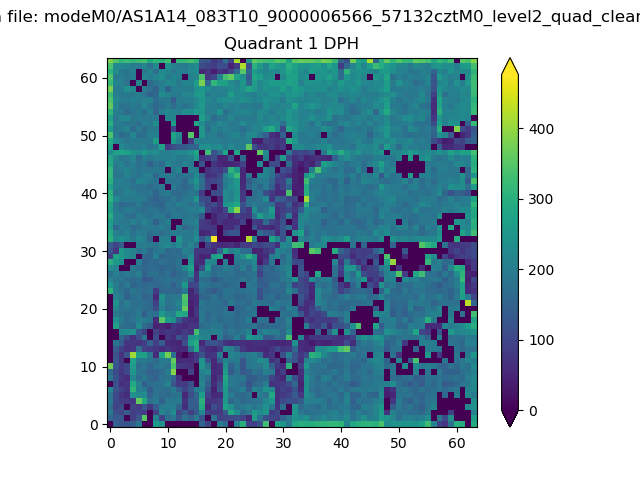 |
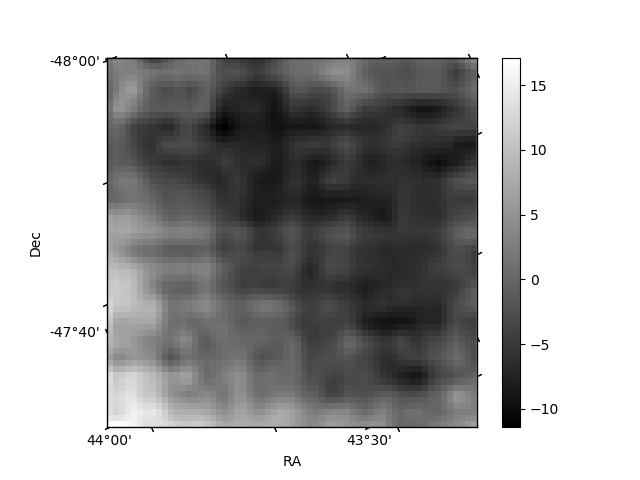
Quadrant B |
|---|---|---|---|
| Quadrant D | 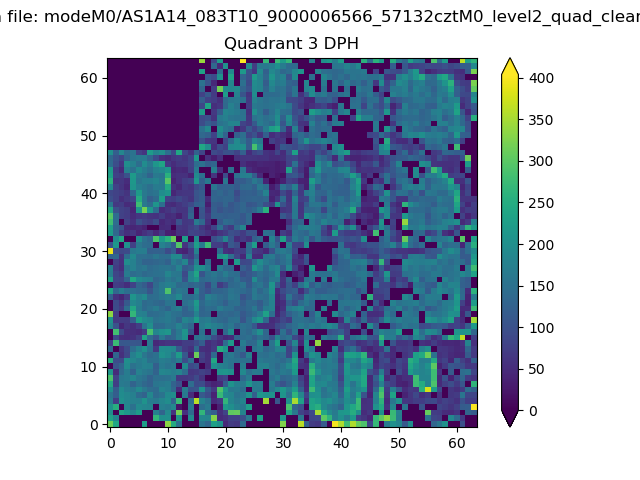 |
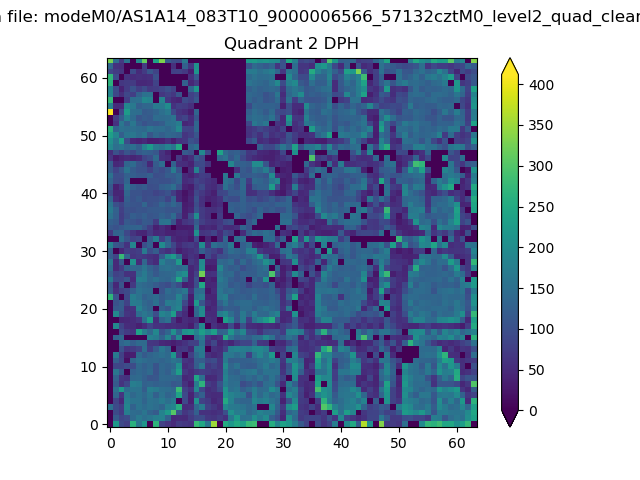 |
Quadrant C |
| Plot type | Count rate plots | Images |
|---|---|---|
| Comparison with Poisson distribution Blue bars denote a histogram of data divided into 1 sec bins. Red curve is a Poisson curve with rate = median count rate of data. |
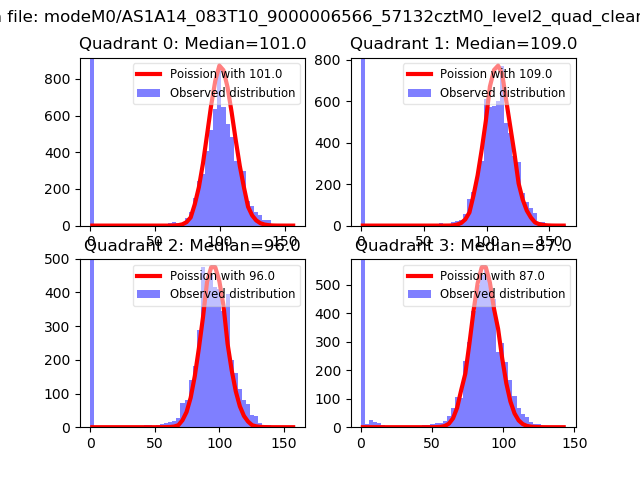 |
 |
| Quadrant-wise count rates Data is divided into 100 sec bins |
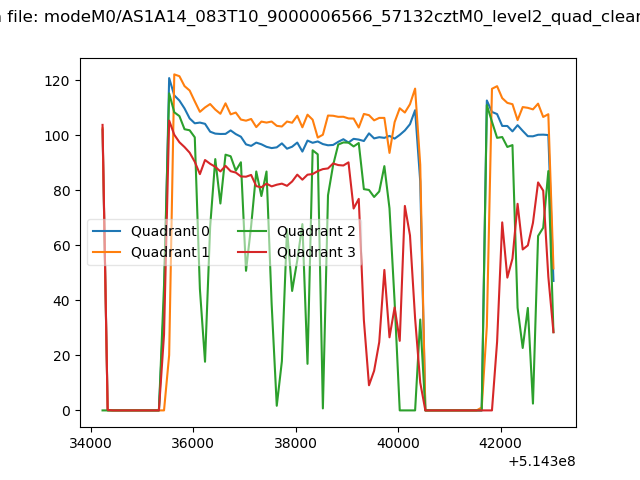 |
|
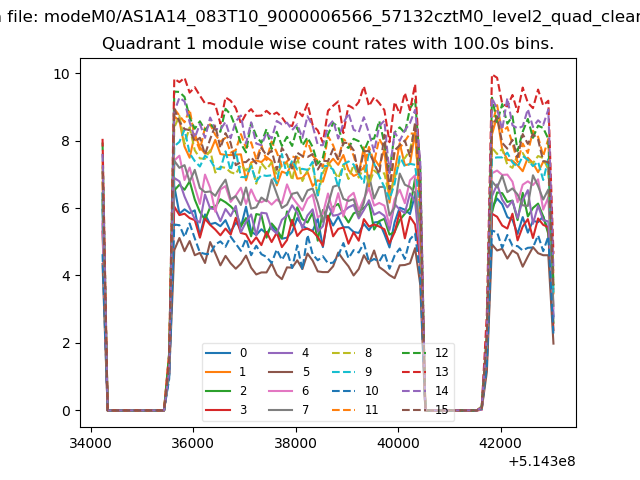
| Module-wise count rates for Quadrant A Data is divided into 100 sec bins |
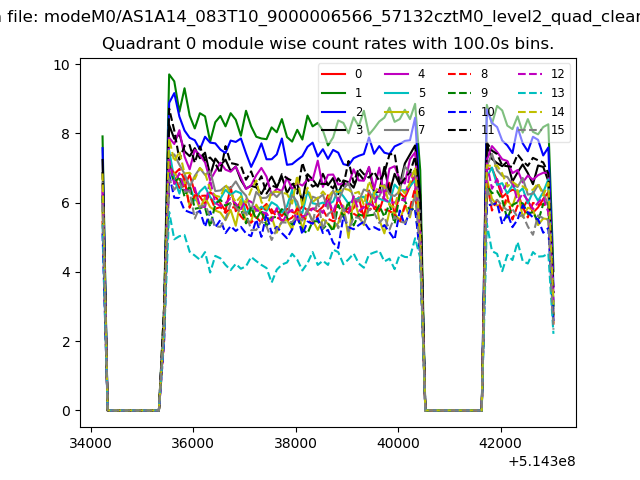 |
 |
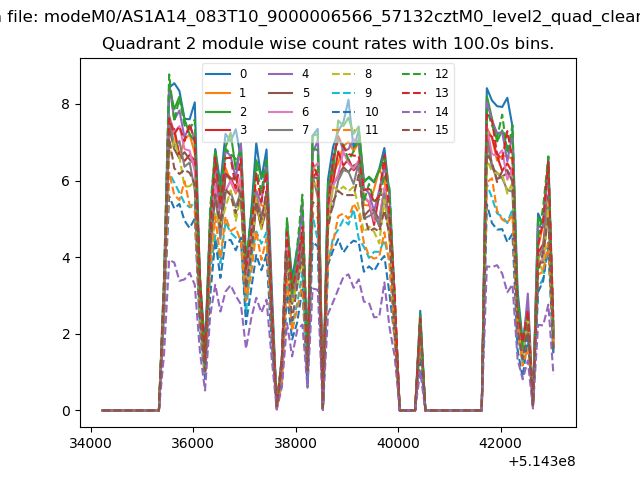
| Module-wise count rates for Quadrant B Data is divided into 100 sec bins |
 |
 |
| Module-wise count rates for Quadrant C Data is divided into 100 sec bins |
 |
 |
| Module-wise count rates for Quadrant D Data is divided into 100 sec bins |
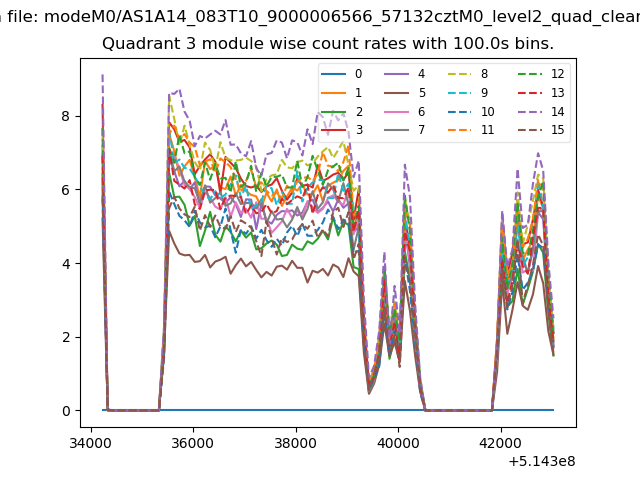 |
 |
| Parameter | Plot |
|---|---|
| CZT HV Monitor | 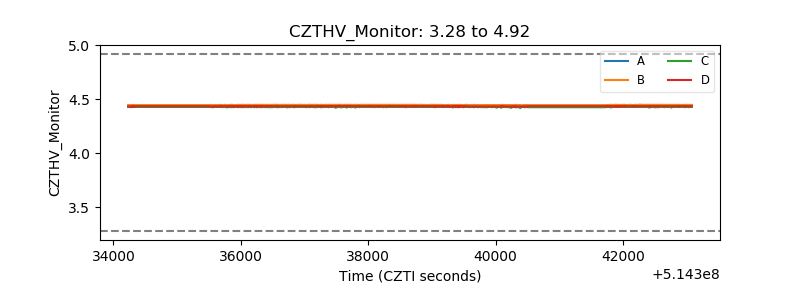 |
| D_VDD | 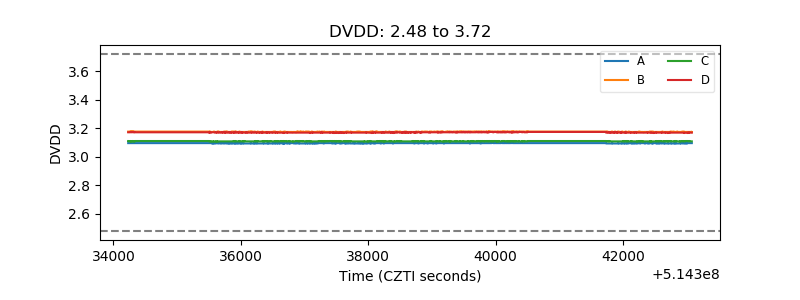 |
| Temperature 1 | 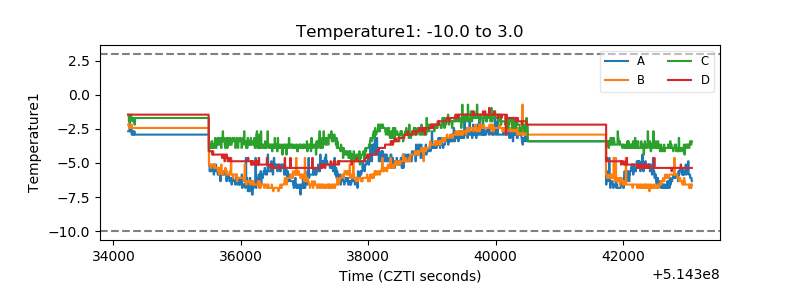 |
| Veto HV Monitor | 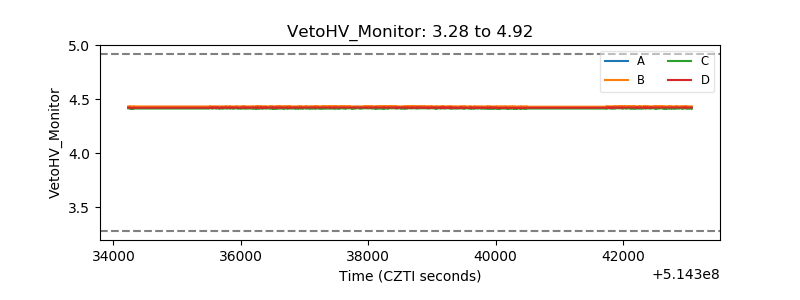 |
| Veto LLD | 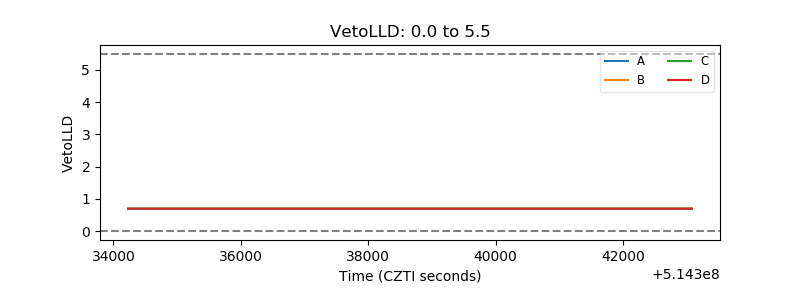 |
| Alpha Counter | 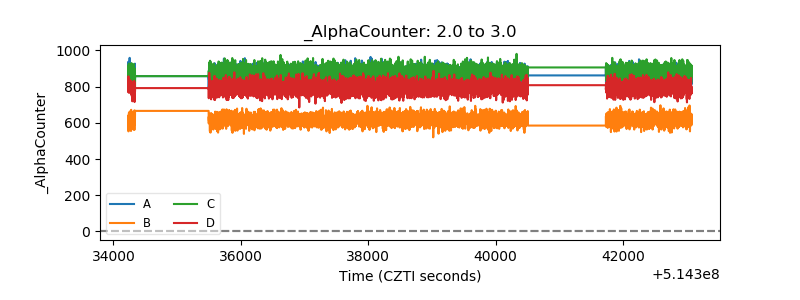 |
| _CPM_Rate | 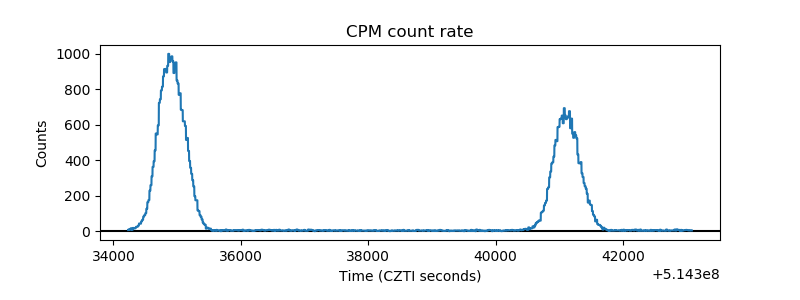 |
| CZT Counter | 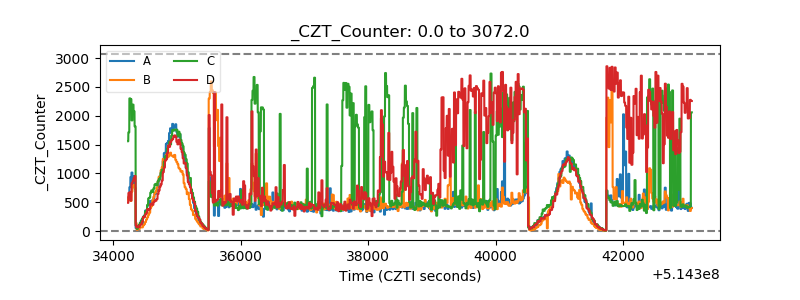 |
| +2.5 Volts monitor | 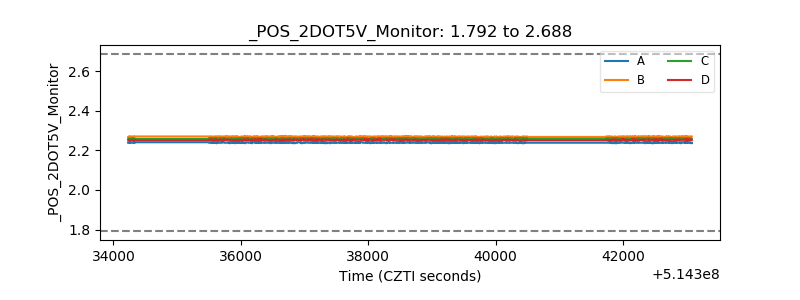 |
| +5 Volts monitor | 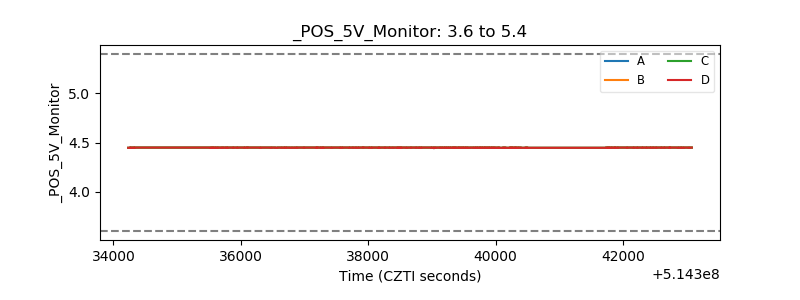 |
| _ROLL_ROT | 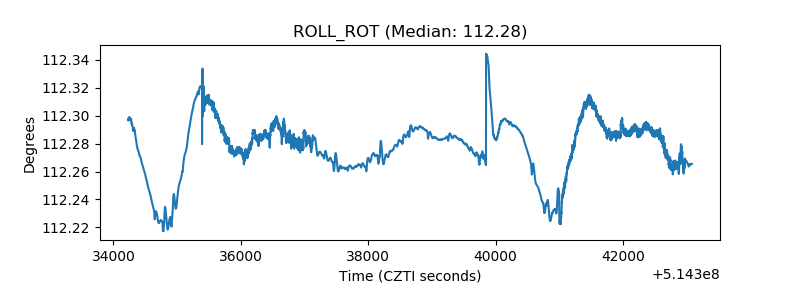 |
| _Roll_DEC | 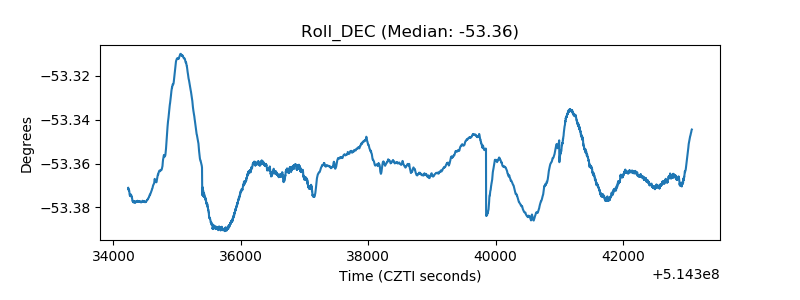 |
| _Roll_RA | 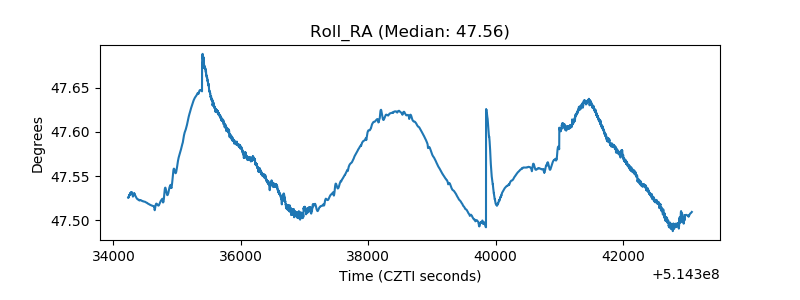 |
| Veto Counter | 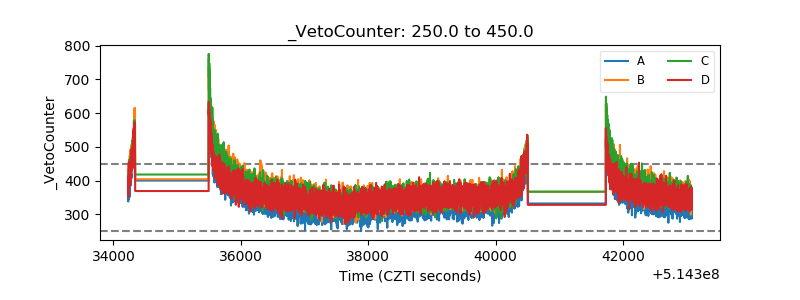 |