| Param | Original file | Final file |
|---|---|---|
| Filename | modeM0/AS1A14_083T10_9000006566_57133cztM0_level2.fits | modeM0/AS1A14_083T10_9000006566_57133cztM0_level2_quad_clean.evt |
| Size (bytes) | 577,445,760 | 89,743,680 |
| Size | 550.7 MB | 85.6 MB |
| Events in quadrant A | 3,079,817 | 640,622 |
| Events in quadrant B | 3,379,934 | 680,415 |
| Events in quadrant C | 5,054,133 | 501,805 |
| Events in quadrant D | 9,359,049 | 443,331 |
| Mode M9 | |||
|---|---|---|---|
| Quadrant | BADHDUFLAG | Total packets | Discarded packets |
| A | 0 | 13 | 0 |
| B | 0 | 14 | 0 |
| C | 0 | 14 | 0 |
| D | 0 | 14 | 0 |
| Mode M0 | |||
|---|---|---|---|
| Quadrant | BADHDUFLAG | Total packets | Discarded packets |
| A | 0 | 13867 | 2 |
| B | 0 | 14517 | 2 |
| C | 0 | 19401 | 2 |
| D | 0 | 32273 | 2 |
| Mode SS | |||
|---|---|---|---|
| Quadrant | BADHDUFLAG | Total packets | Discarded packets |
| A | 0 | 132 | 0 |
| B | 0 | 132 | 0 |
| C | 0 | 132 | 0 |
| D | 0 | 132 | 0 |
| Quadrant | Total seconds | Saturated seconds | Saturation percentage |
|---|---|---|---|
| A | 6467 | 49 | 0.757693% |
| B | 6467 | 168 | 2.597804% |
| C | 6467 | 1183 | 18.292872% |
| D | 6466 | 1715 | 26.523353% |
Noise dominated data is calculated using 1-second bins in cleaned event files. If a bin has >2000 counts, and if more than 50% of those come from <1% of pixels, then it is considered to be noise-dominated and hence unusable.
| Quadrant | # 1 sec bins | Bins with >0 counts | Bins with >2000 counts | High rate bins dominated by noise | Noise dominated (total time) | Noise dominated (detector-on time) | Marked lightcurve |
|---|---|---|---|---|---|---|---|
| A | 7577 | 6468 | 24 | 24 | 0.32% | 0.37% | 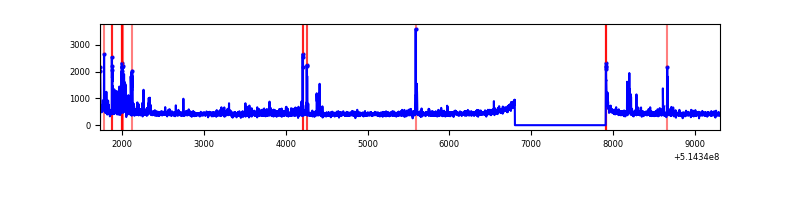 |
| B | 7577 | 6468 | 77 | 77 | 1.02% | 1.19% | 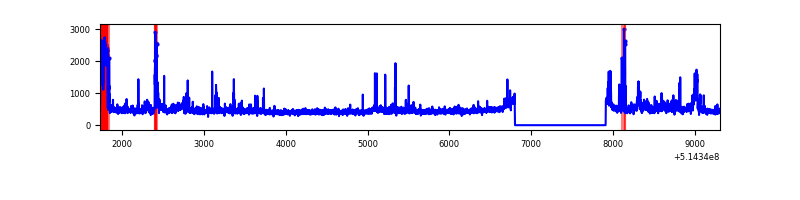 |
| C | 7577 | 6467 | 805 | 805 | 10.62% | 12.45% | 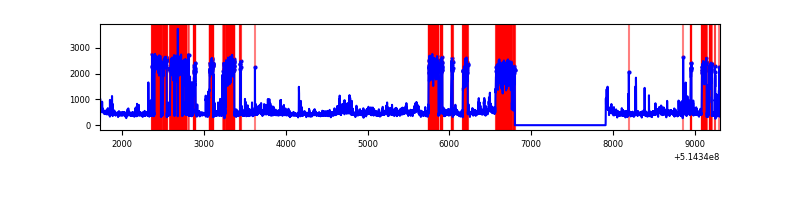 |
| D | 7576 | 6466 | 1797 | 1797 | 23.72% | 27.79% | 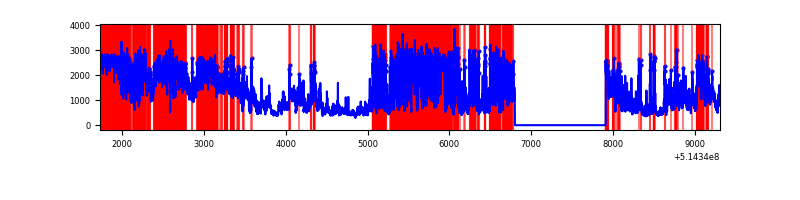 |
Top three noisy pixels from each quadrant. If the there are fewer than three noisy pixels in the level2.evt file, extra rows are filled as -1
| Pixel properties | Quadrant properties | ||||||
|---|---|---|---|---|---|---|---|
| Quadrant | DetID | PixID | Counts | Sigma | Mean | Median | Sigma |
| A | 3 | 14 | 213104 | 1206.08 | 714 | 695 | 176.1 |
| A | 10 | 251 | 35074 | 195.21 | 714 | 695 | 176.1 |
| A | 5 | 113 | 24730 | 136.47 | 714 | 695 | 176.1 |
| B | 10 | 16 | 369473 | 2510.71 | 699 | 674 | 146.9 |
| B | 5 | 185 | 101618 | 687.21 | 699 | 674 | 146.9 |
| B | 0 | 213 | 48205 | 323.58 | 699 | 674 | 146.9 |
| C | 15 | 198 | 2377058 | 14939.2 | 578 | 570 | 159.1 |
| C | 12 | 252 | 337850 | 2120.23 | 578 | 570 | 159.1 |
| C | 14 | 254 | 56514 | 351.68 | 578 | 570 | 159.1 |
| D | 15 | 142 | 3910333 | 22402.25 | 614 | 586 | 174.5 |
| D | 12 | 33 | 2542310 | 14563.69 | 614 | 586 | 174.5 |
| D | 8 | 240 | 175620 | 1002.92 | 614 | 586 | 174.5 |
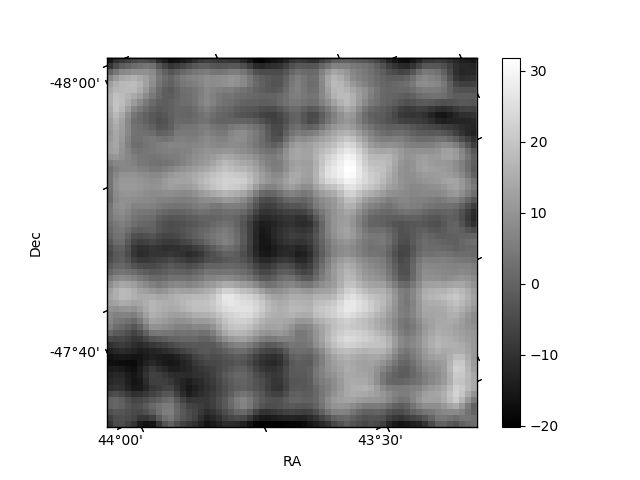
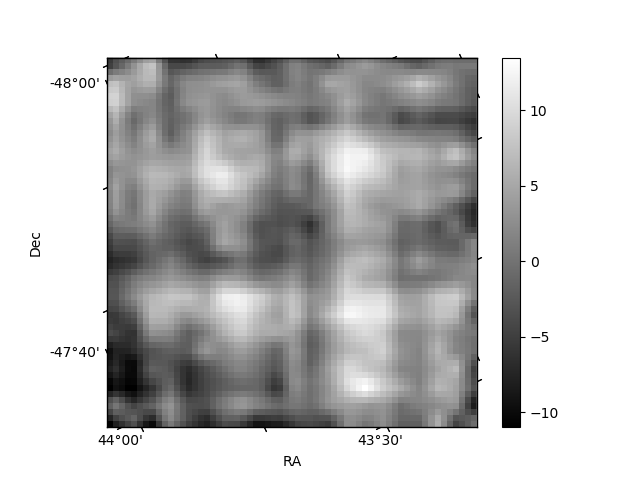
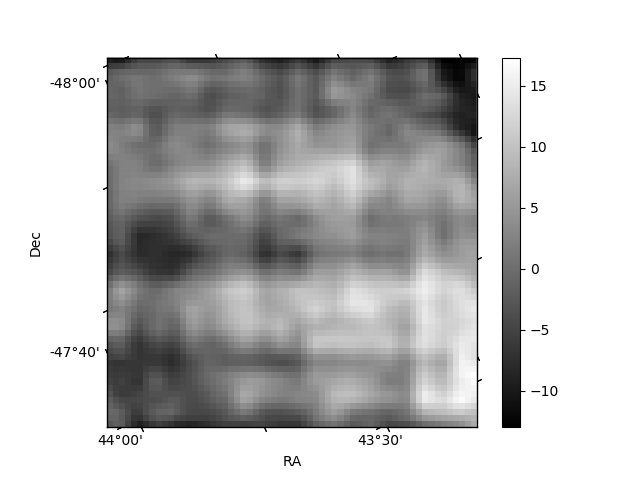
Histogram calculated using DETX and DETY for each event in the final _common_clean file
| Quadrant A | 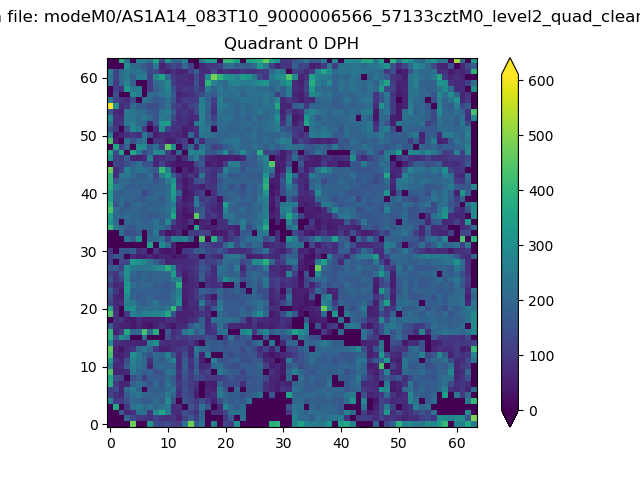 |
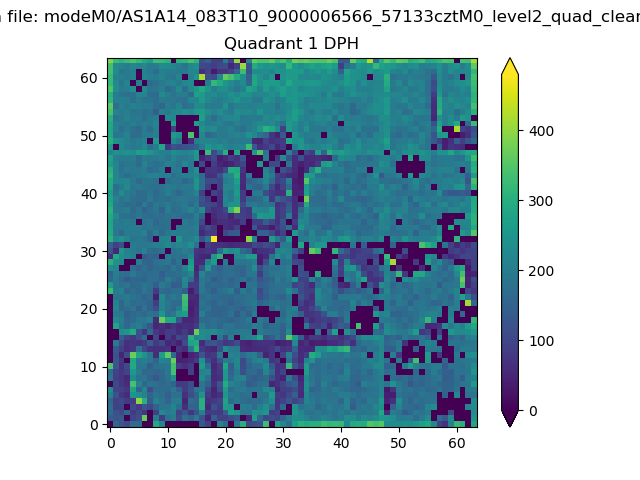 |
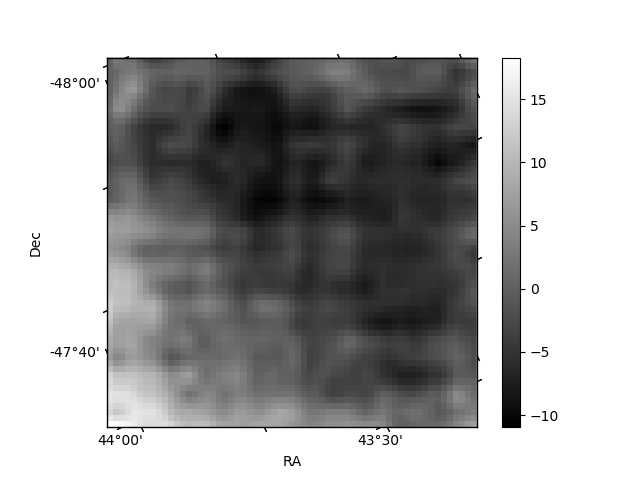
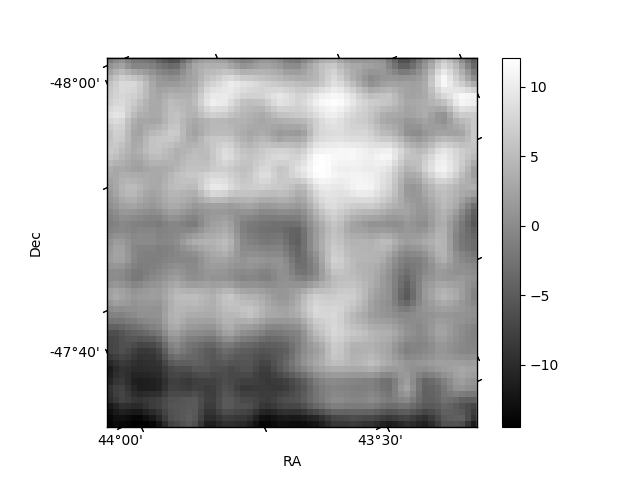
Quadrant B |
|---|---|---|---|
| Quadrant D | 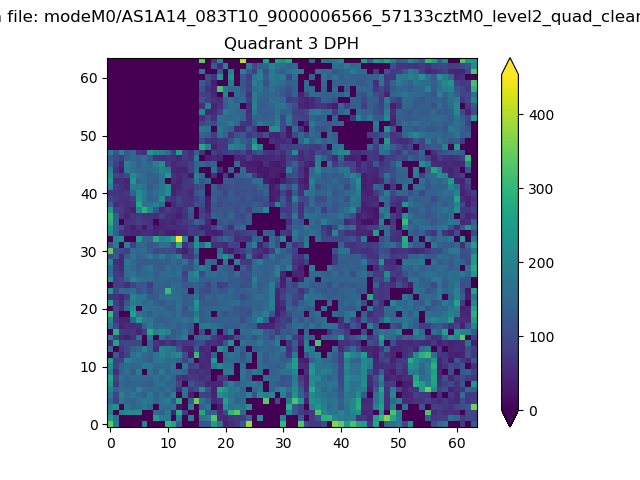 |
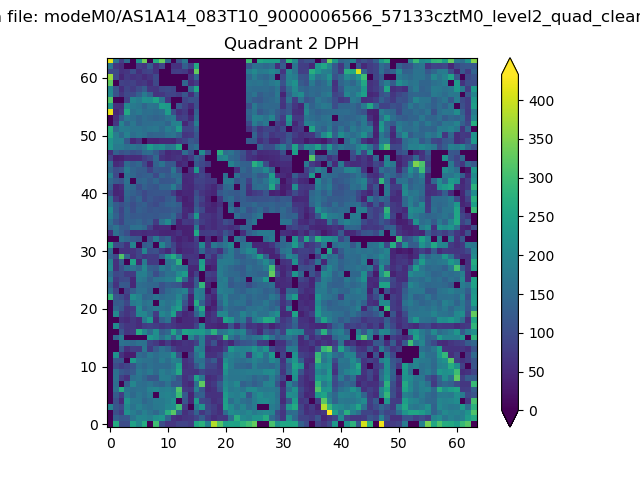 |
Quadrant C |
| Plot type | Count rate plots | Images |
|---|---|---|
| Comparison with Poisson distribution Blue bars denote a histogram of data divided into 1 sec bins. Red curve is a Poisson curve with rate = median count rate of data. |
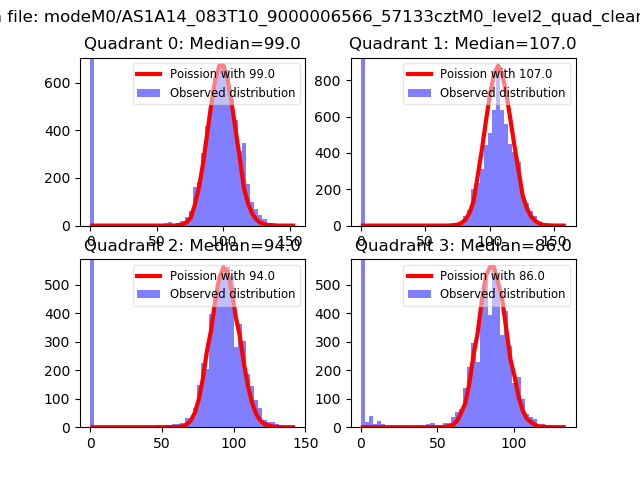 |
 |
| Quadrant-wise count rates Data is divided into 100 sec bins |
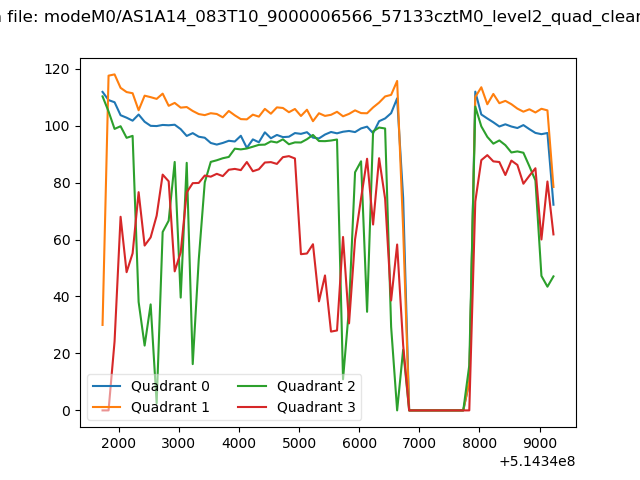 |
|
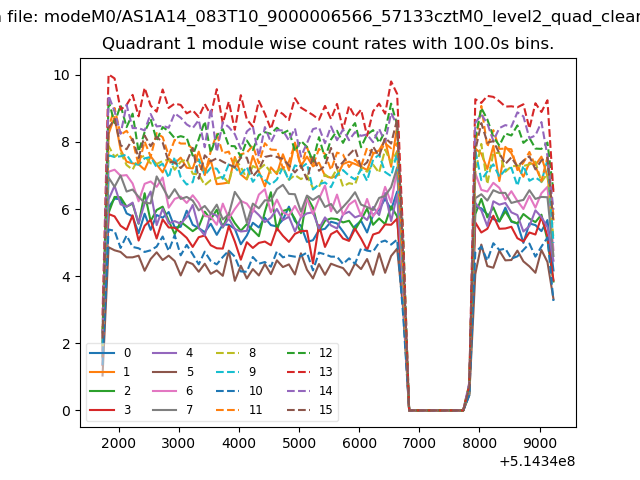
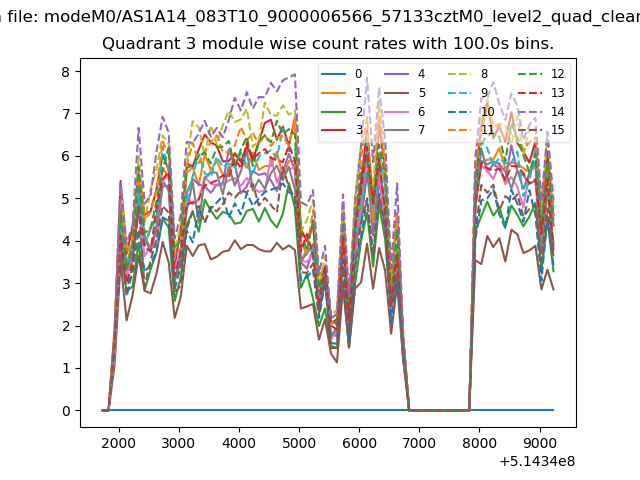
| Module-wise count rates for Quadrant A Data is divided into 100 sec bins |
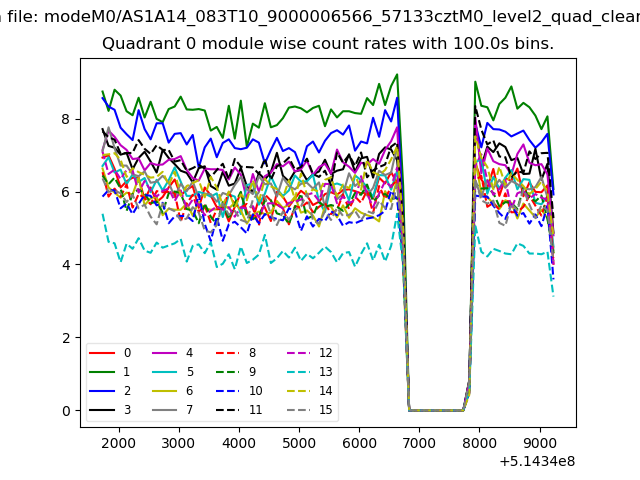 |
 |
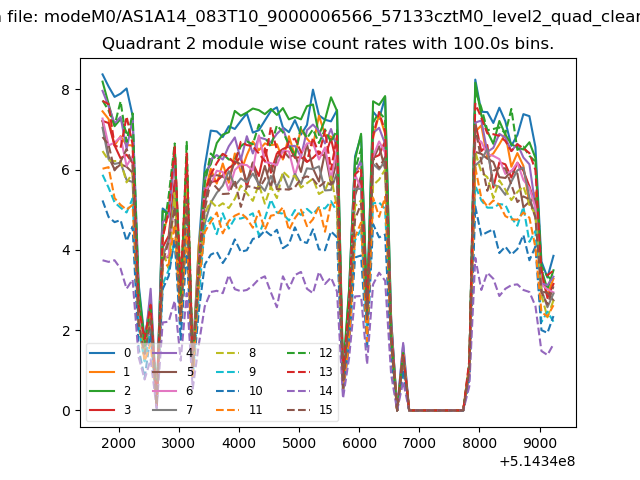
| Module-wise count rates for Quadrant B Data is divided into 100 sec bins |
 |
 |
| Module-wise count rates for Quadrant C Data is divided into 100 sec bins |
 |
 |
| Module-wise count rates for Quadrant D Data is divided into 100 sec bins |
 |
 |
| Parameter | Plot |
|---|---|
| CZT HV Monitor | 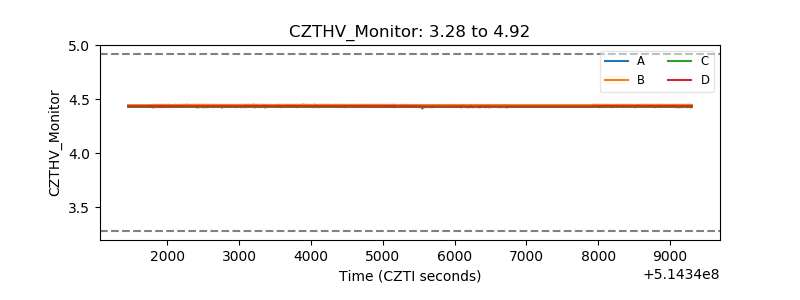 |
| D_VDD | 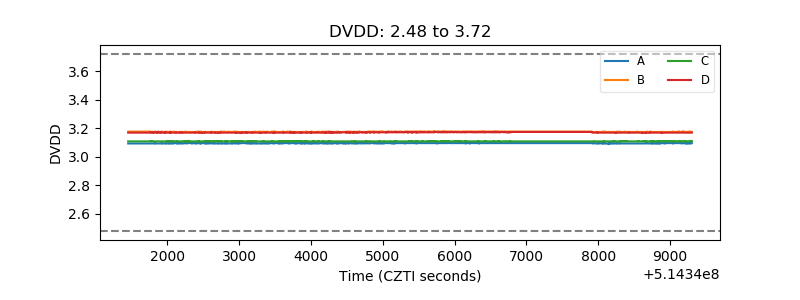 |
| Temperature 1 | 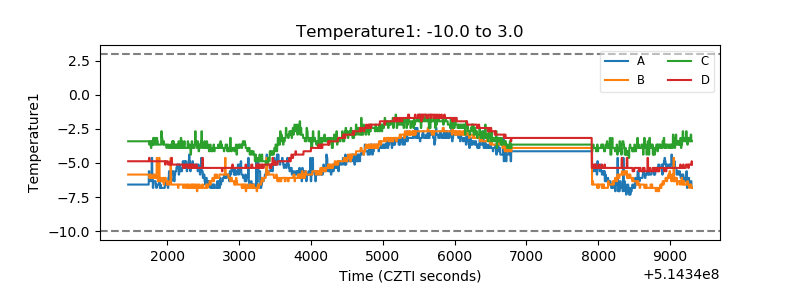 |
| Veto HV Monitor | 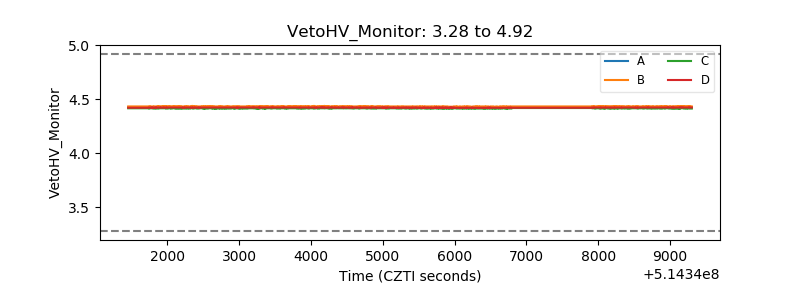 |
| Veto LLD | 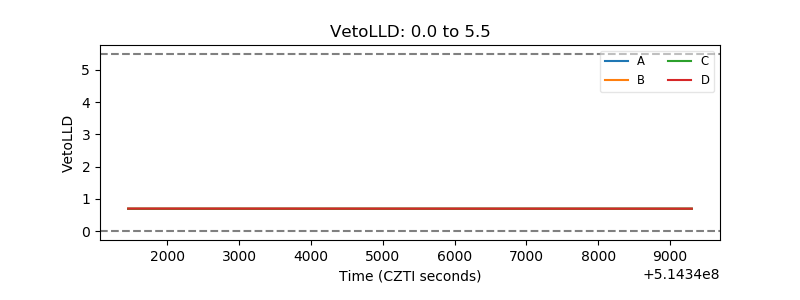 |
| Alpha Counter | 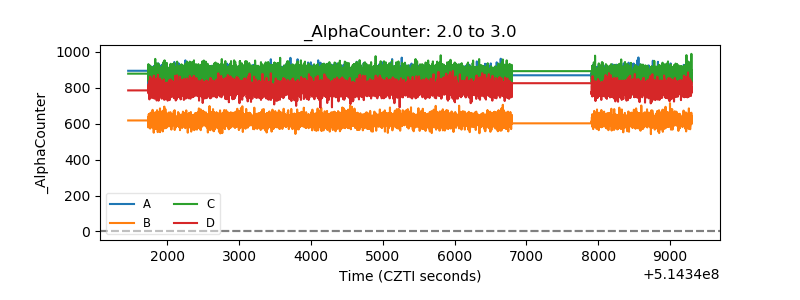 |
| _CPM_Rate | 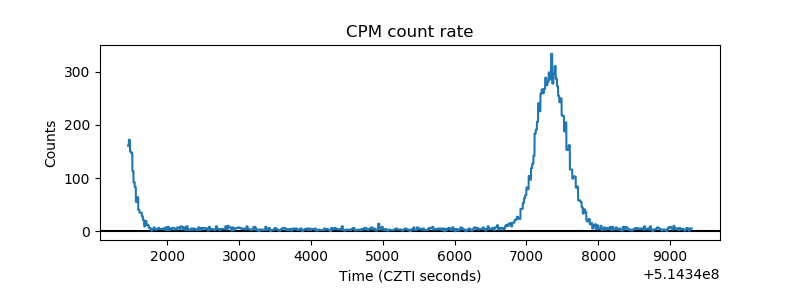 |
| CZT Counter | 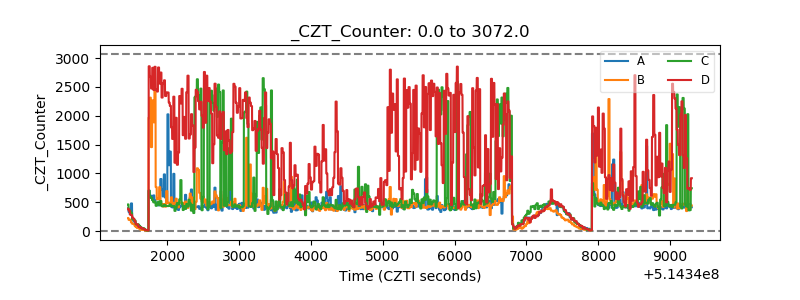 |
| +2.5 Volts monitor | 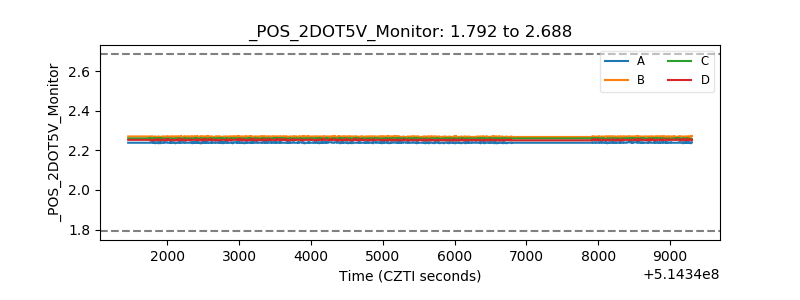 |
| +5 Volts monitor | 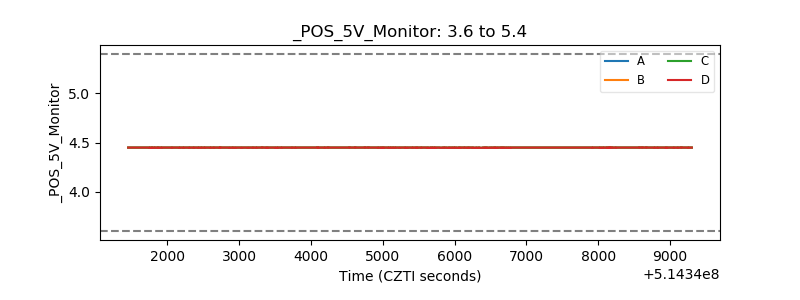 |
| _ROLL_ROT | 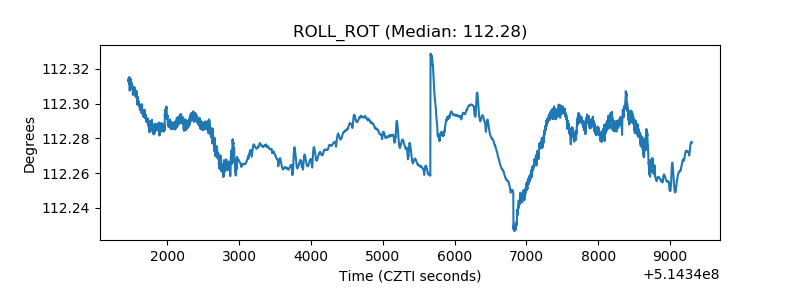 |
| _Roll_DEC | 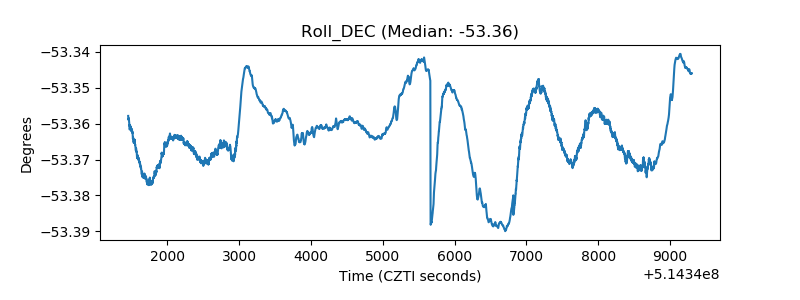 |
| _Roll_RA | 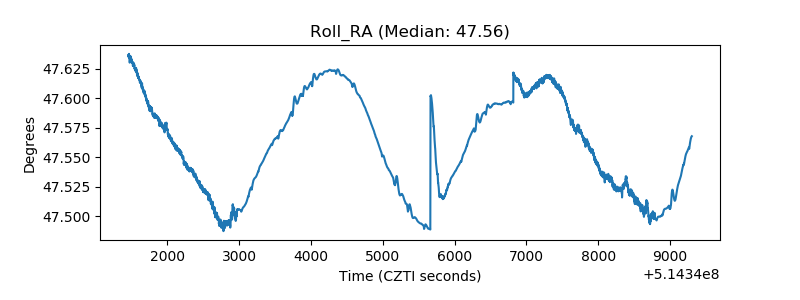 |
| Veto Counter | 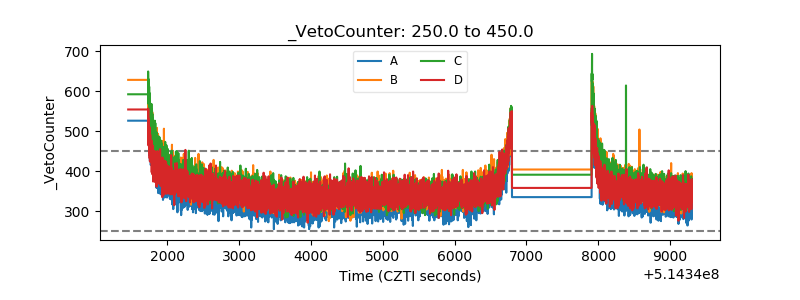 |