| Param | Original file | Final file |
|---|---|---|
| Filename | modeM0/AS1A14_083T10_9000006566_57134cztM0_level2.fits | modeM0/AS1A14_083T10_9000006566_57134cztM0_level2_quad_clean.evt |
| Size (bytes) | 773,012,160 | 81,858,240 |
| Size | 737.2 MB | 78.1 MB |
| Events in quadrant A | 3,001,133 | 657,496 |
| Events in quadrant B | 3,722,853 | 692,262 |
| Events in quadrant C | 8,167,130 | 374,821 |
| Events in quadrant D | 13,192,609 | 277,783 |
| Mode M9 | |||
|---|---|---|---|
| Quadrant | BADHDUFLAG | Total packets | Discarded packets |
| A | 0 | 20 | 0 |
| B | 0 | 20 | 0 |
| C | 0 | 20 | 0 |
| D | 0 | 20 | 0 |
| Mode M0 | |||
|---|---|---|---|
| Quadrant | BADHDUFLAG | Total packets | Discarded packets |
| A | 0 | 14111 | 2 |
| B | 0 | 15969 | 2 |
| C | 0 | 28999 | 8 |
| D | 0 | 43938 | 2 |
| Mode SS | |||
|---|---|---|---|
| Quadrant | BADHDUFLAG | Total packets | Discarded packets |
| A | 0 | 140 | 0 |
| B | 0 | 140 | 0 |
| C | 0 | 140 | 0 |
| D | 0 | 140 | 0 |
| Quadrant | Total seconds | Saturated seconds | Saturation percentage |
|---|---|---|---|
| A | 6837 | 77 | 1.126225% |
| B | 6837 | 305 | 4.461021% |
| C | 6836 | 2849 | 41.676419% |
| D | 6836 | 3813 | 55.778233% |
Noise dominated data is calculated using 1-second bins in cleaned event files. If a bin has >2000 counts, and if more than 50% of those come from <1% of pixels, then it is considered to be noise-dominated and hence unusable.
| Quadrant | # 1 sec bins | Bins with >0 counts | Bins with >2000 counts | High rate bins dominated by noise | Noise dominated (total time) | Noise dominated (detector-on time) | Marked lightcurve |
|---|---|---|---|---|---|---|---|
| A | 8807 | 6839 | 6 | 6 | 0.07% | 0.09% | 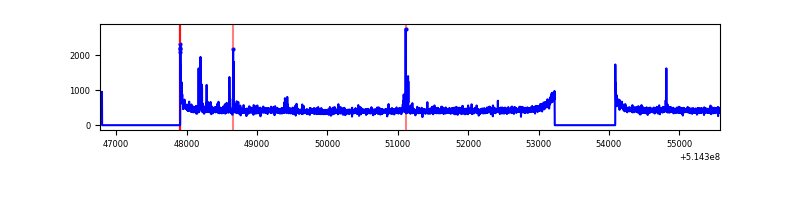 |
| B | 8807 | 6838 | 95 | 95 | 1.08% | 1.39% | 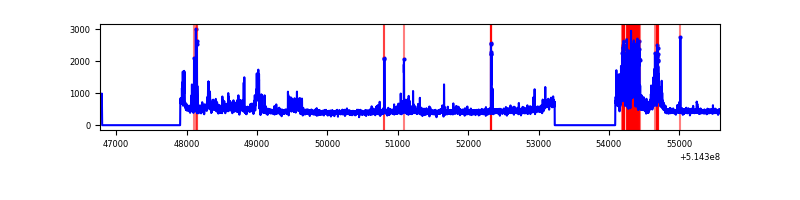 |
| C | 8805 | 6835 | 2240 | 2240 | 25.44% | 32.77% | 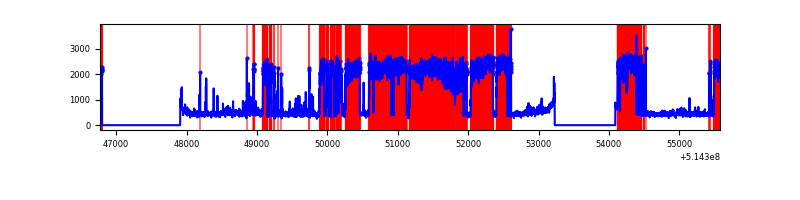 |
| D | 8805 | 6835 | 3864 | 3864 | 43.88% | 56.53% | 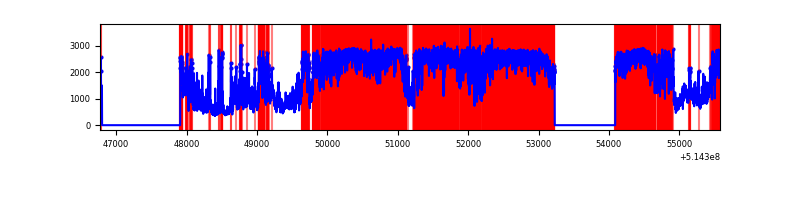 |
Top three noisy pixels from each quadrant. If the there are fewer than three noisy pixels in the level2.evt file, extra rows are filled as -1
| Pixel properties | Quadrant properties | ||||||
|---|---|---|---|---|---|---|---|
| Quadrant | DetID | PixID | Counts | Sigma | Mean | Median | Sigma |
| A | 10 | 251 | 34364 | 181.02 | 751 | 731 | 185.8 |
| A | 5 | 113 | 27969 | 146.6 | 751 | 731 | 185.8 |
| A | 13 | 248 | 14200 | 72.49 | 751 | 731 | 185.8 |
| B | 10 | 16 | 546763 | 3472.06 | 739 | 711 | 157.3 |
| B | 5 | 185 | 88023 | 555.17 | 739 | 711 | 157.3 |
| B | 0 | 213 | 33430 | 208.04 | 739 | 711 | 157.3 |
| C | 15 | 198 | 5946467 | 42532.02 | 512 | 507 | 139.8 |
| C | 12 | 252 | 125084 | 891.11 | 512 | 507 | 139.8 |
| C | 14 | 254 | 59849 | 424.48 | 512 | 507 | 139.8 |
| D | 15 | 142 | 10111480 | 63965.8 | 560 | 534 | 158.1 |
| D | 12 | 33 | 608401 | 3845.6 | 560 | 534 | 158.1 |
| D | 8 | 240 | 83748 | 526.44 | 560 | 534 | 158.1 |
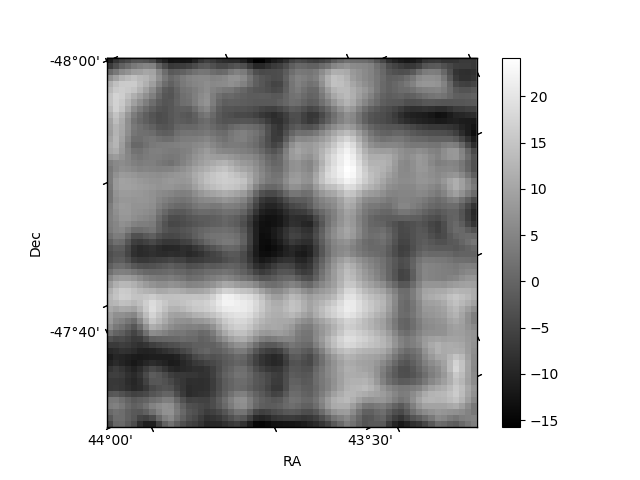
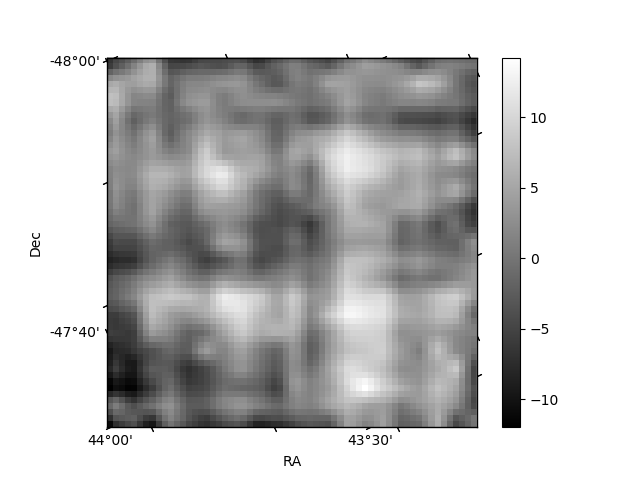
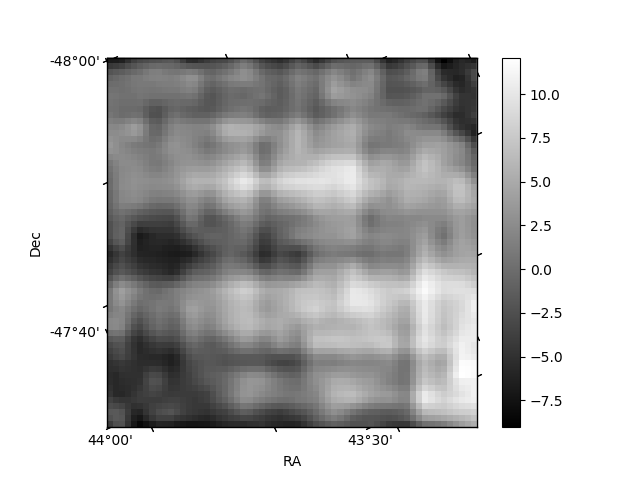
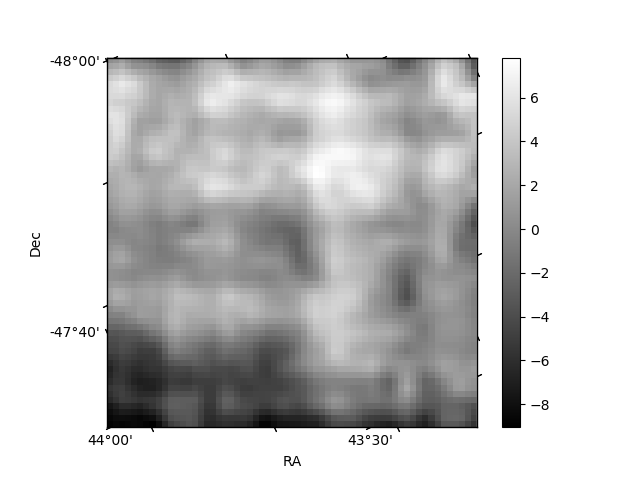
Histogram calculated using DETX and DETY for each event in the final _common_clean file
| Quadrant A | 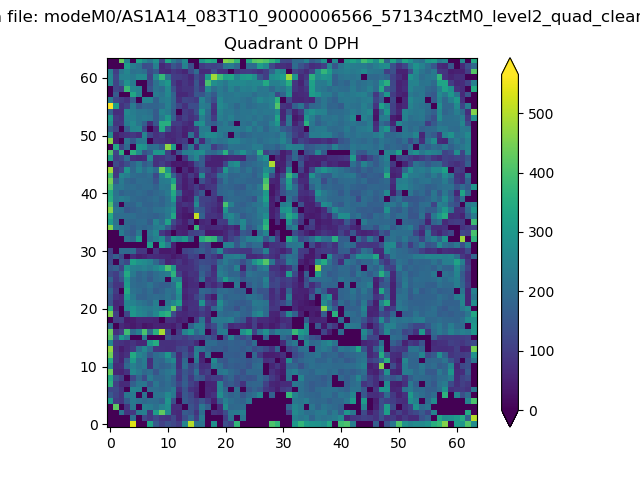 |
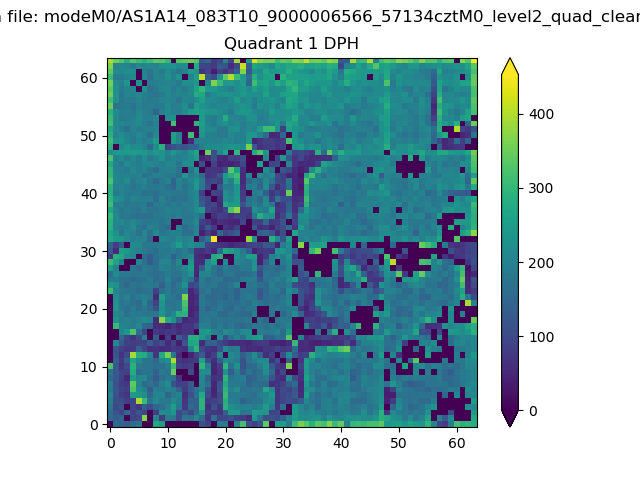 |
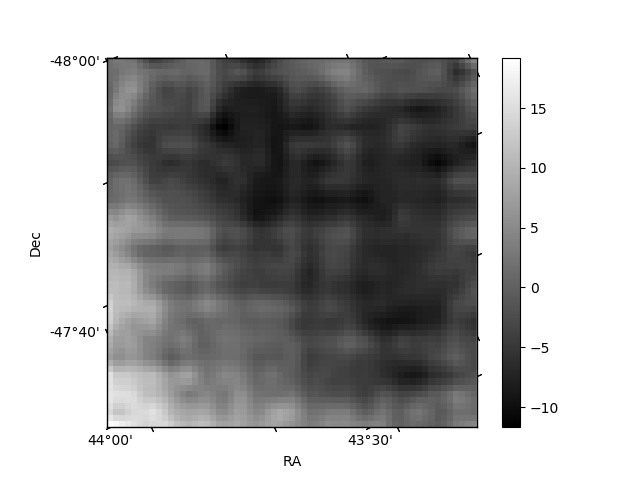
Quadrant B |
|---|---|---|---|
| Quadrant D | 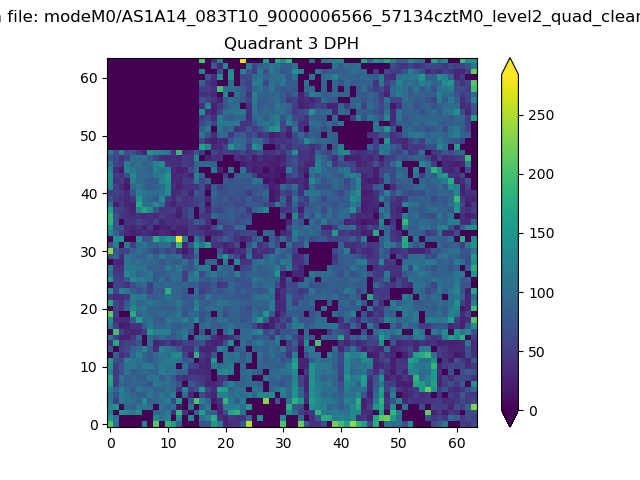 |
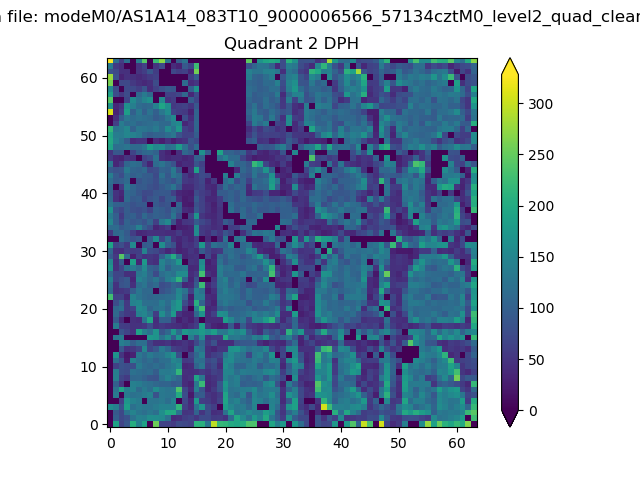 |
Quadrant C |
| Plot type | Count rate plots | Images |
|---|---|---|
| Comparison with Poisson distribution Blue bars denote a histogram of data divided into 1 sec bins. Red curve is a Poisson curve with rate = median count rate of data. |
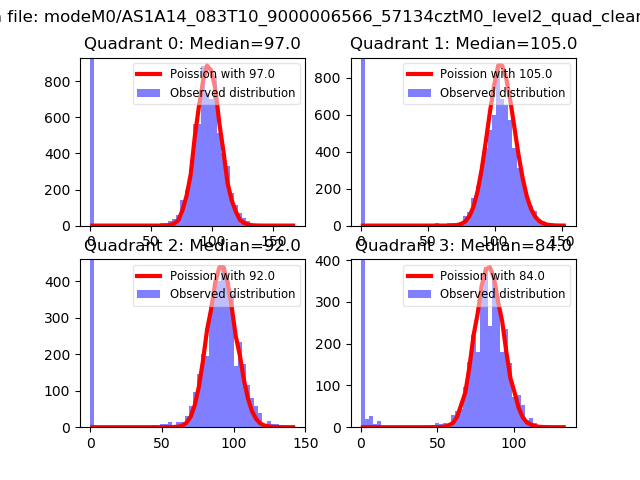 |
 |
| Quadrant-wise count rates Data is divided into 100 sec bins |
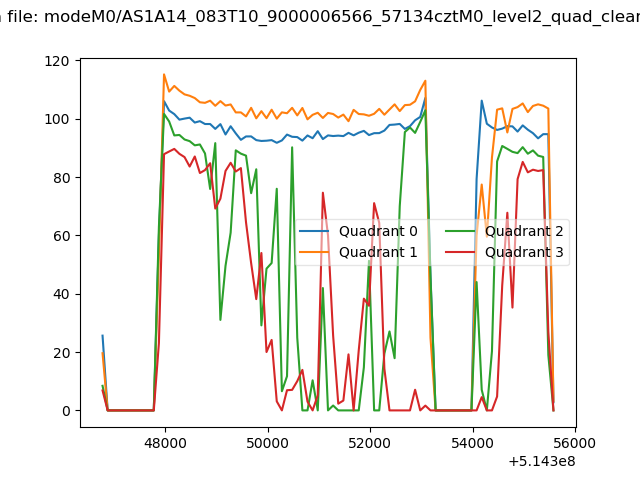 |
|
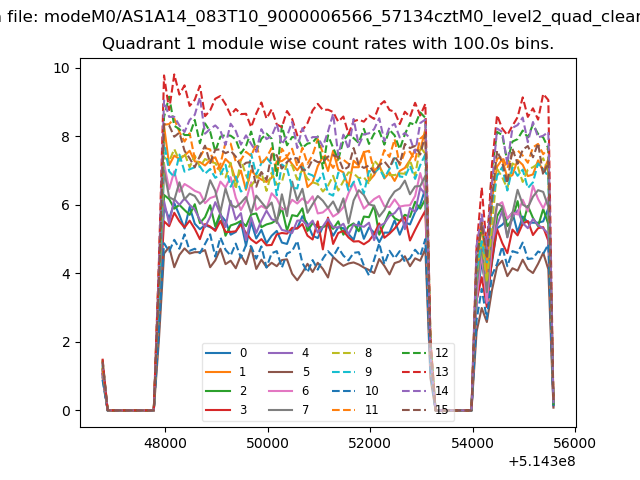
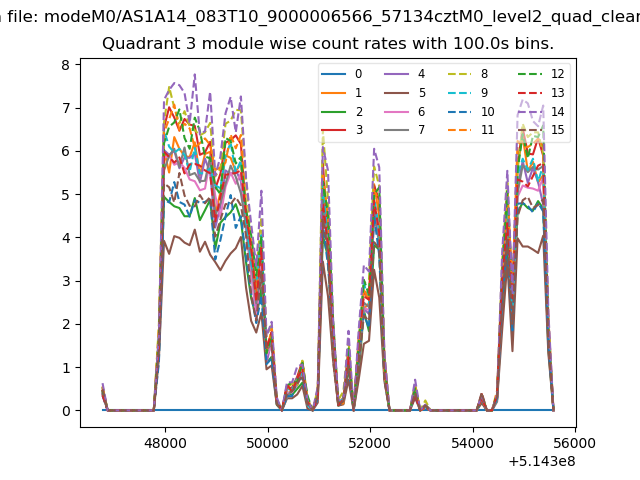
| Module-wise count rates for Quadrant A Data is divided into 100 sec bins |
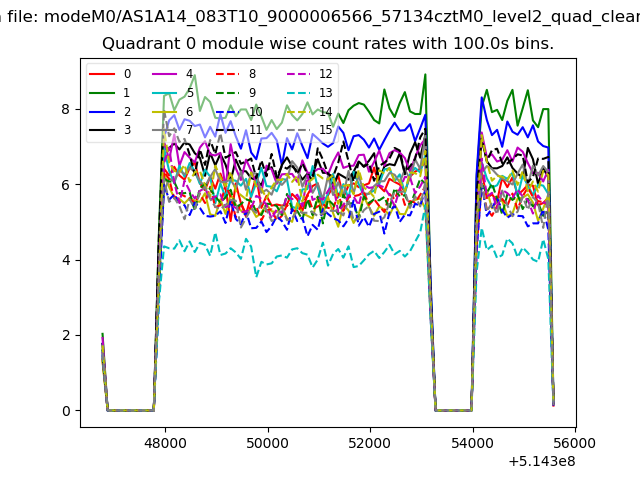 |
 |
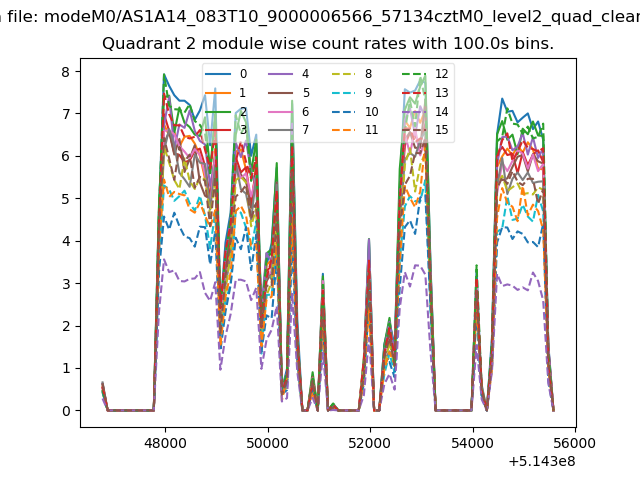
| Module-wise count rates for Quadrant B Data is divided into 100 sec bins |
 |
 |
| Module-wise count rates for Quadrant C Data is divided into 100 sec bins |
 |
 |
| Module-wise count rates for Quadrant D Data is divided into 100 sec bins |
 |
 |
| Parameter | Plot |
|---|---|
| CZT HV Monitor | 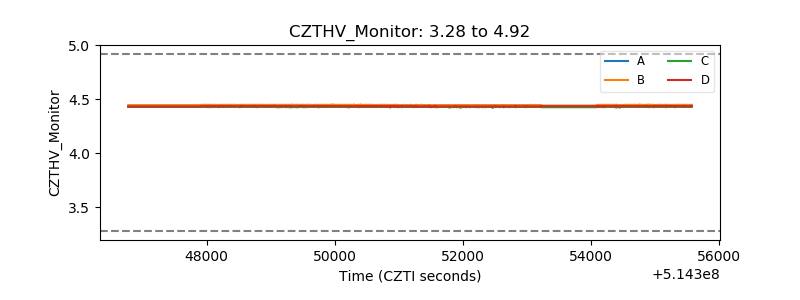 |
| D_VDD | 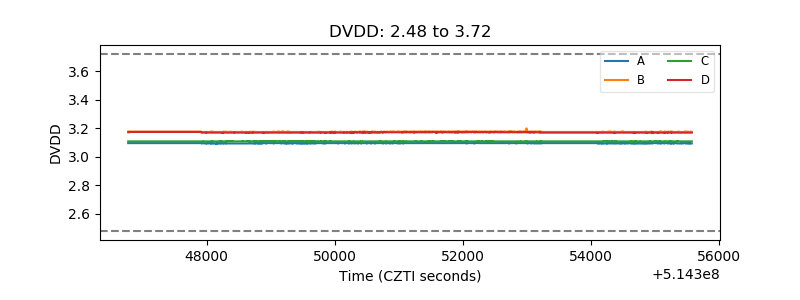 |
| Temperature 1 | 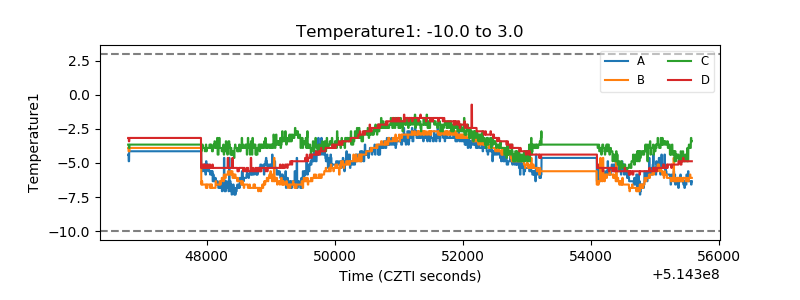 |
| Veto HV Monitor | 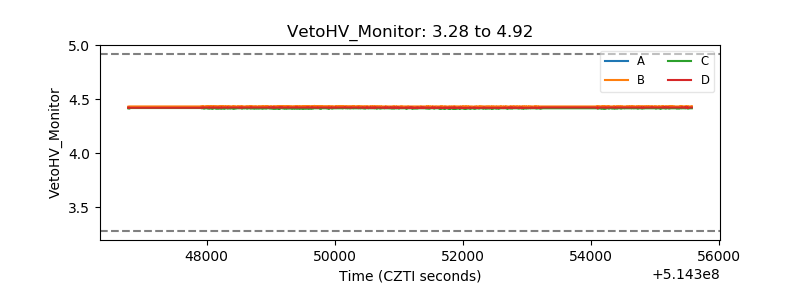 |
| Veto LLD | 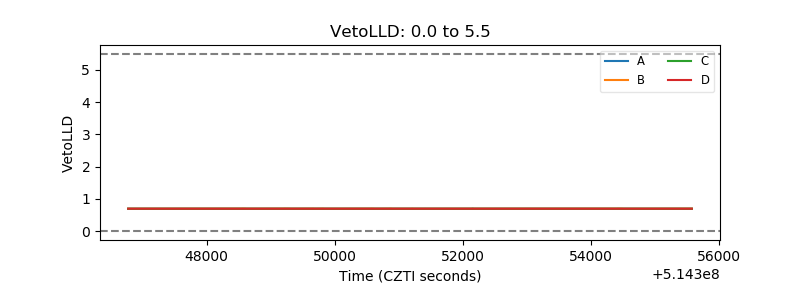 |
| Alpha Counter | 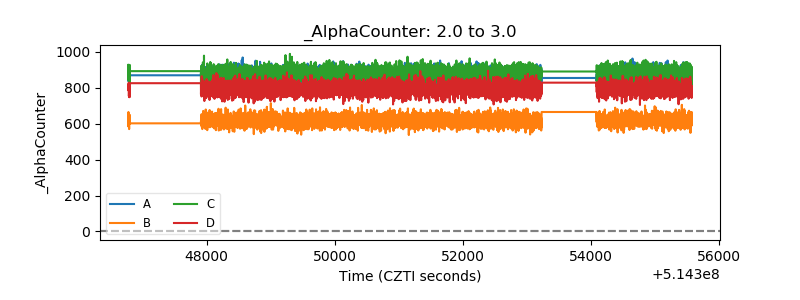 |
| _CPM_Rate | 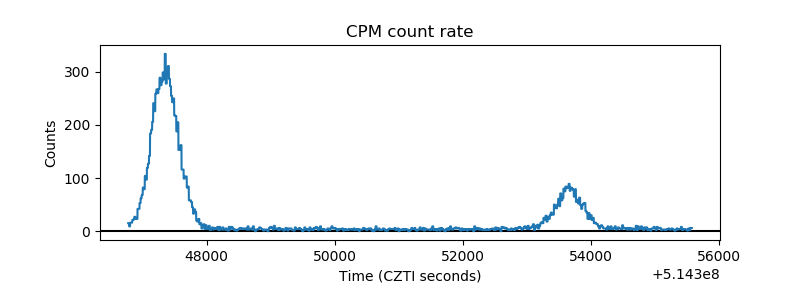 |
| CZT Counter | 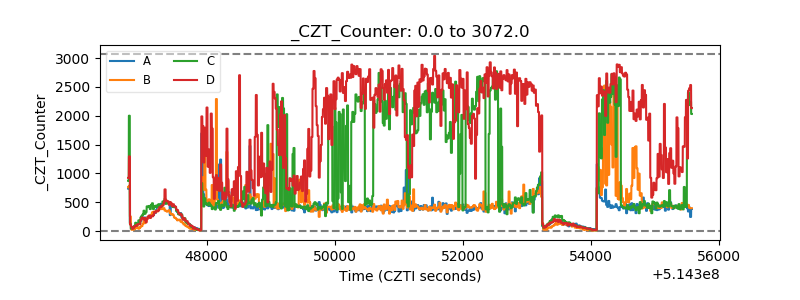 |
| +2.5 Volts monitor |  |
| +5 Volts monitor |  |
| _ROLL_ROT | 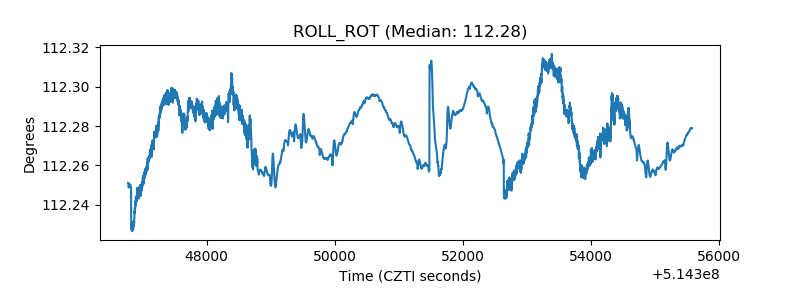 |
| _Roll_DEC | 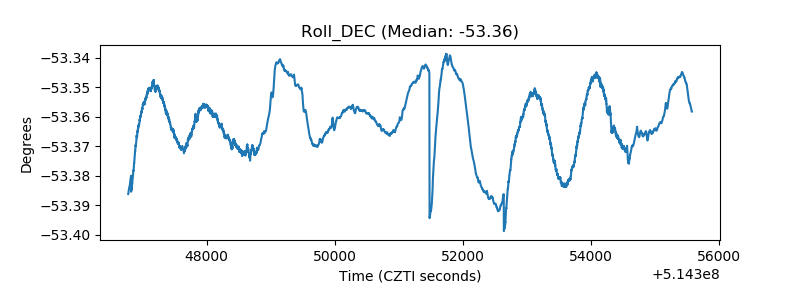 |
| _Roll_RA | 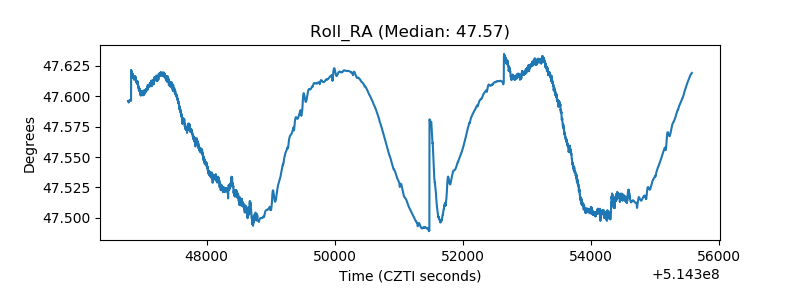 |
| Veto Counter | 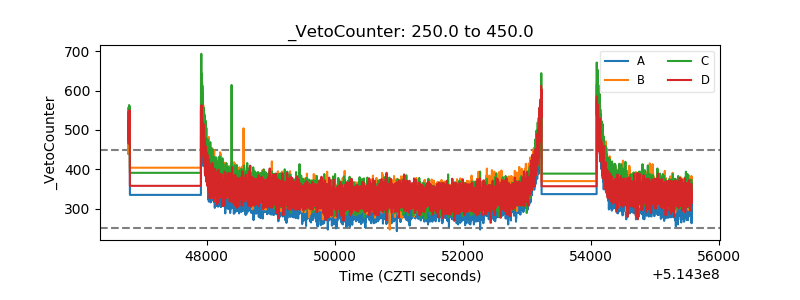 |