| Param | Original file | Final file |
|---|---|---|
| Filename | modeM0/AS1A14_083T10_9000006566_57135cztM0_level2.fits | modeM0/AS1A14_083T10_9000006566_57135cztM0_level2_quad_clean.evt |
| Size (bytes) | 817,243,200 | 90,720,000 |
| Size | 779.4 MB | 86.5 MB |
| Events in quadrant A | 4,136,285 | 678,385 |
| Events in quadrant B | 4,886,737 | 693,960 |
| Events in quadrant C | 7,613,917 | 459,770 |
| Events in quadrant D | 13,040,431 | 399,684 |
| Mode M9 | |||
|---|---|---|---|
| Quadrant | BADHDUFLAG | Total packets | Discarded packets |
| A | 0 | 7 | 0 |
| B | 0 | 8 | 0 |
| C | 0 | 8 | 0 |
| D | 0 | 8 | 0 |
| Mode M0 | |||
|---|---|---|---|
| Quadrant | BADHDUFLAG | Total packets | Discarded packets |
| A | 0 | 17844 | 2 |
| B | 0 | 19895 | 5 |
| C | 0 | 27929 | 2 |
| D | 0 | 43916 | 2 |
| Mode SS | |||
|---|---|---|---|
| Quadrant | BADHDUFLAG | Total packets | Discarded packets |
| A | 0 | 150 | 0 |
| B | 0 | 150 | 0 |
| C | 0 | 150 | 0 |
| D | 0 | 150 | 0 |
| Quadrant | Total seconds | Saturated seconds | Saturation percentage |
|---|---|---|---|
| A | 7405 | 372 | 5.023633% |
| B | 7404 | 799 | 10.791464% |
| C | 7404 | 2446 | 33.036197% |
| D | 7404 | 3000 | 40.518639% |
Noise dominated data is calculated using 1-second bins in cleaned event files. If a bin has >2000 counts, and if more than 50% of those come from <1% of pixels, then it is considered to be noise-dominated and hence unusable.
| Quadrant | # 1 sec bins | Bins with >0 counts | Bins with >2000 counts | High rate bins dominated by noise | Noise dominated (total time) | Noise dominated (detector-on time) | Marked lightcurve |
|---|---|---|---|---|---|---|---|
| A | 7750 | 7405 | 204 | 204 | 2.63% | 2.75% | 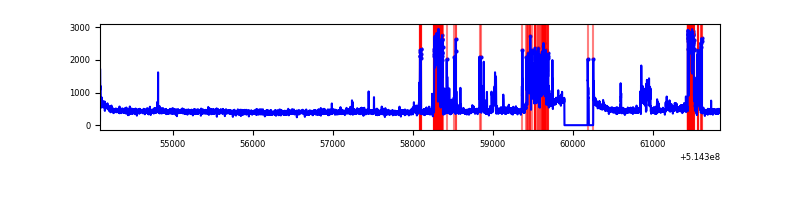 |
| B | 7749 | 7404 | 375 | 375 | 4.84% | 5.06% | 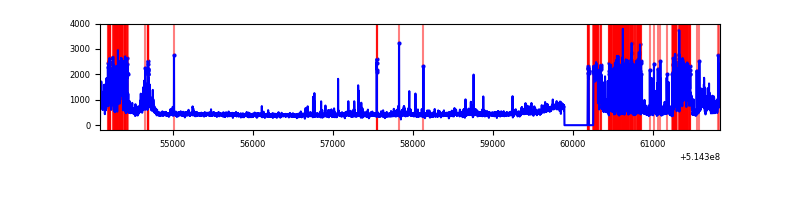 |
| C | 7749 | 7406 | 2018 | 2018 | 26.04% | 27.25% | 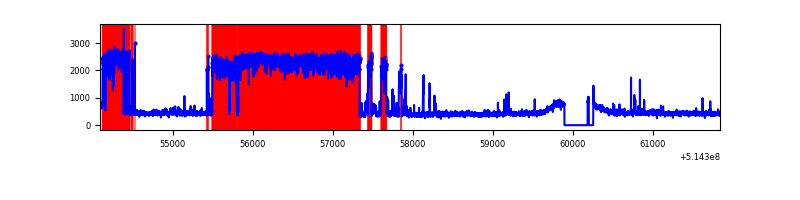 |
| D | 7749 | 7404 | 3123 | 3123 | 40.30% | 42.18% | 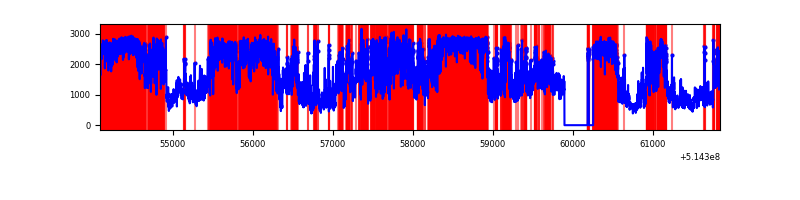 |
Top three noisy pixels from each quadrant. If the there are fewer than three noisy pixels in the level2.evt file, extra rows are filled as -1
| Pixel properties | Quadrant properties | ||||||
|---|---|---|---|---|---|---|---|
| Quadrant | DetID | PixID | Counts | Sigma | Mean | Median | Sigma |
| A | 3 | 14 | 951899 | 4799.7 | 809 | 787 | 198.2 |
| A | 5 | 113 | 33888 | 167.04 | 809 | 787 | 198.2 |
| A | 3 | 137 | 9958 | 46.28 | 809 | 787 | 198.2 |
| B | 10 | 16 | 1631873 | 9898.41 | 770 | 741 | 164.8 |
| B | 8 | 234 | 30664 | 181.58 | 770 | 741 | 164.8 |
| B | 5 | 172 | 28158 | 166.38 | 770 | 741 | 164.8 |
| C | 15 | 198 | 5000511 | 29774.4 | 622 | 616 | 167.9 |
| C | 12 | 252 | 132829 | 787.33 | 622 | 616 | 167.9 |
| C | 14 | 254 | 36144 | 211.57 | 622 | 616 | 167.9 |
| D | 15 | 142 | 9792476 | 52410.73 | 663 | 634 | 186.8 |
| D | 2 | 249 | 167920 | 895.4 | 663 | 634 | 186.8 |
| D | 8 | 240 | 114957 | 611.91 | 663 | 634 | 186.8 |
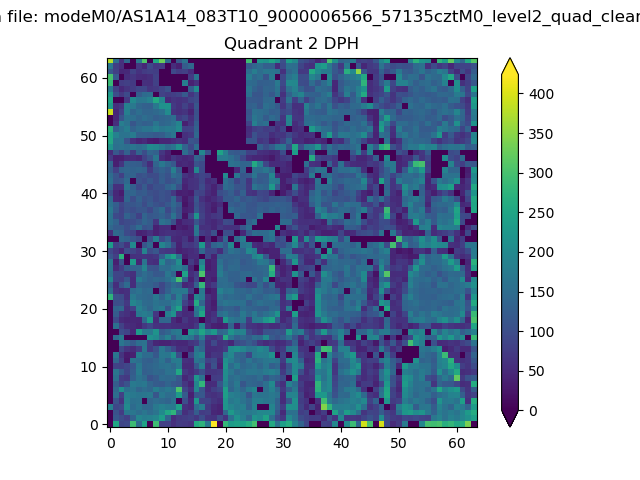
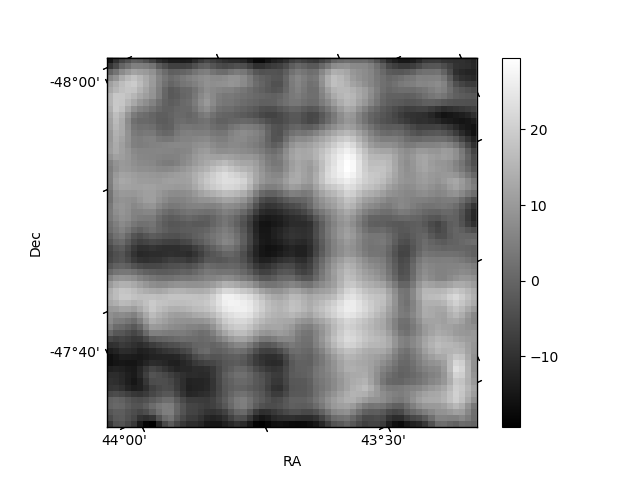
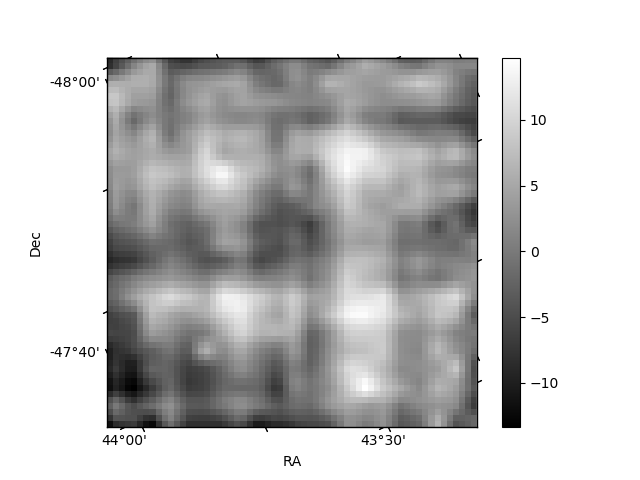
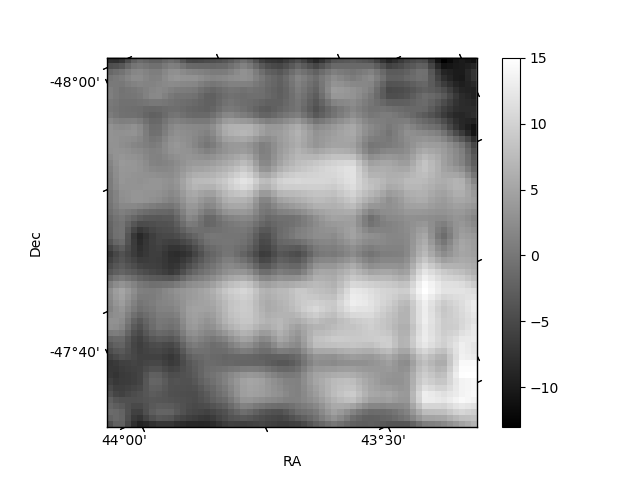
Histogram calculated using DETX and DETY for each event in the final _common_clean file
| Quadrant A | 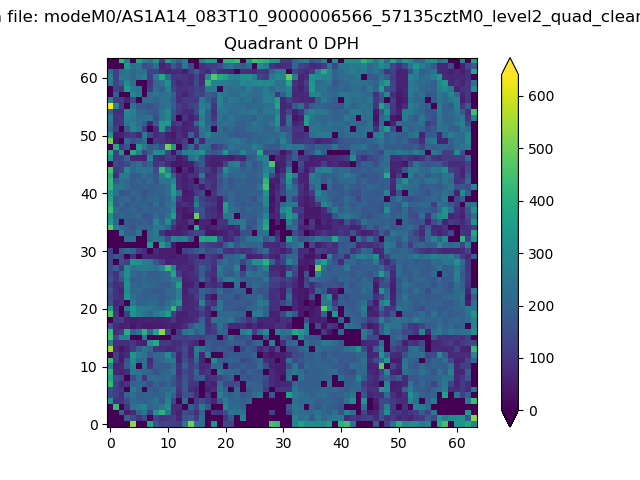 |
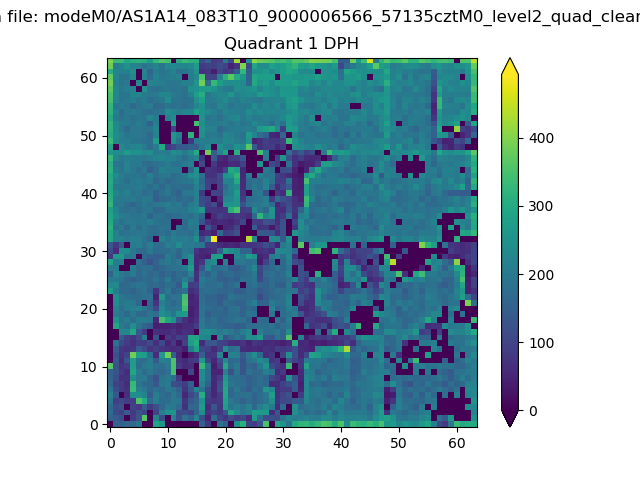 |
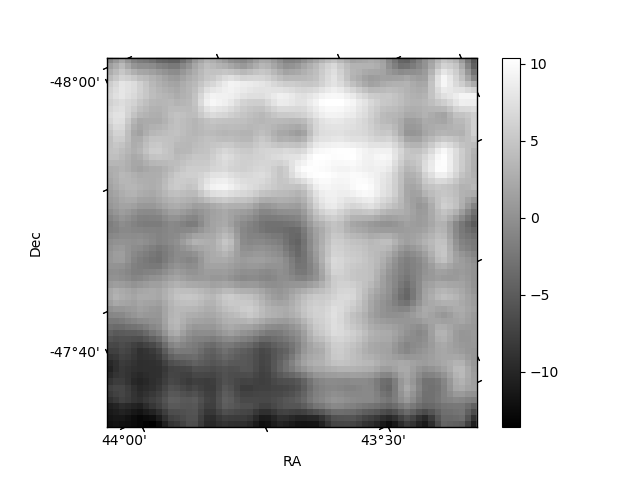
Quadrant B |
|---|---|---|---|
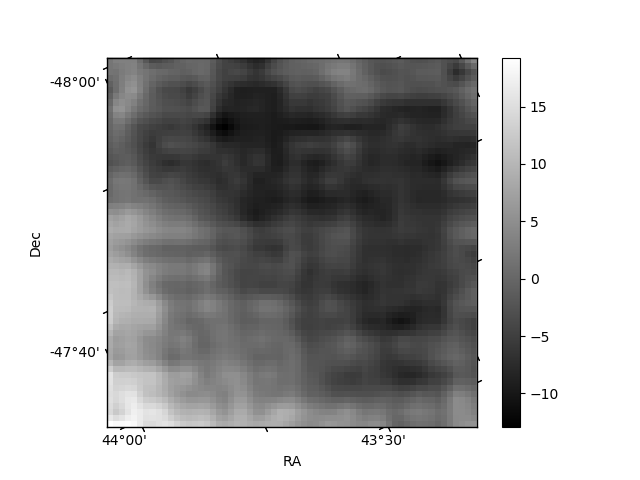
| Quadrant D | 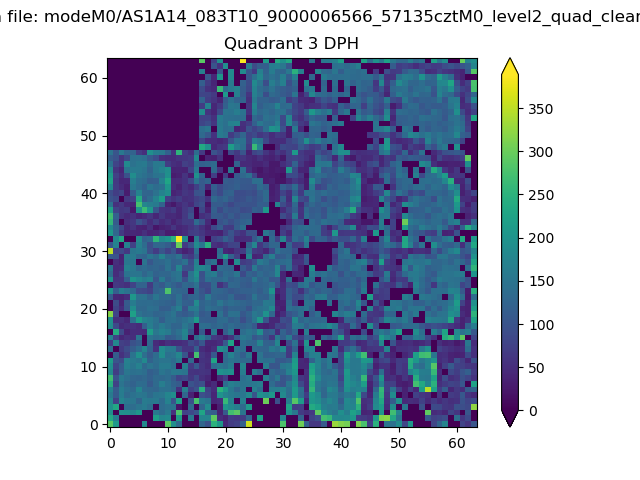 |
 |
Quadrant C |
| Plot type | Count rate plots | Images |
|---|---|---|
| Comparison with Poisson distribution Blue bars denote a histogram of data divided into 1 sec bins. Red curve is a Poisson curve with rate = median count rate of data. |
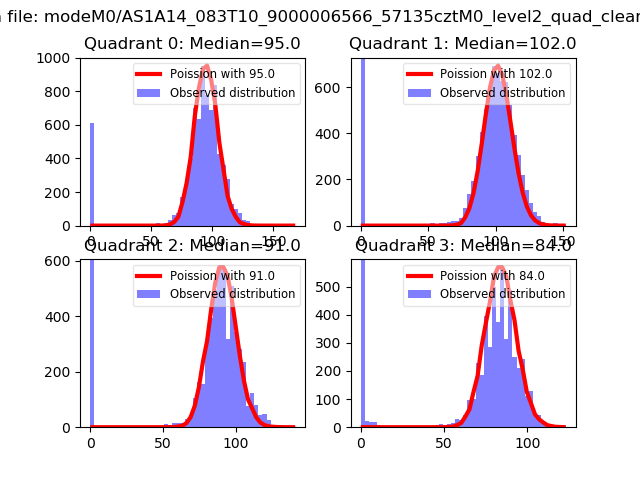 |
 |
| Quadrant-wise count rates Data is divided into 100 sec bins |
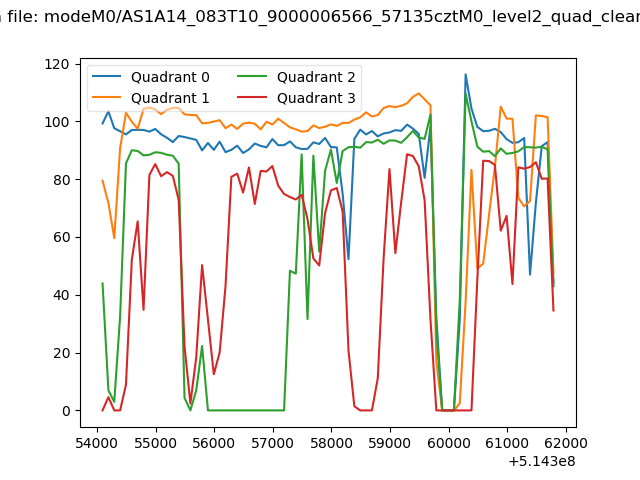 |
|
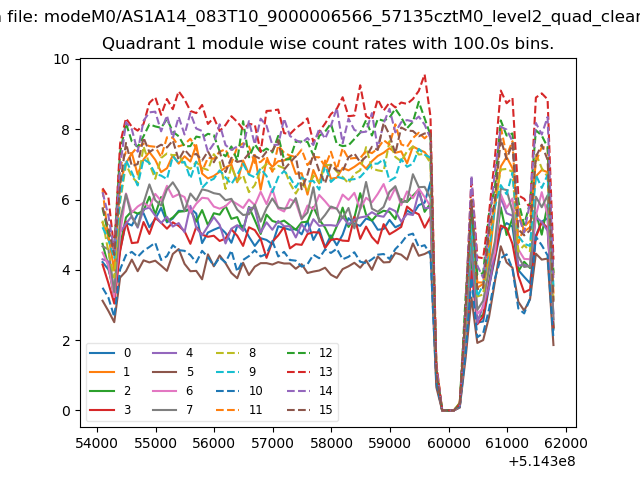
| Module-wise count rates for Quadrant A Data is divided into 100 sec bins |
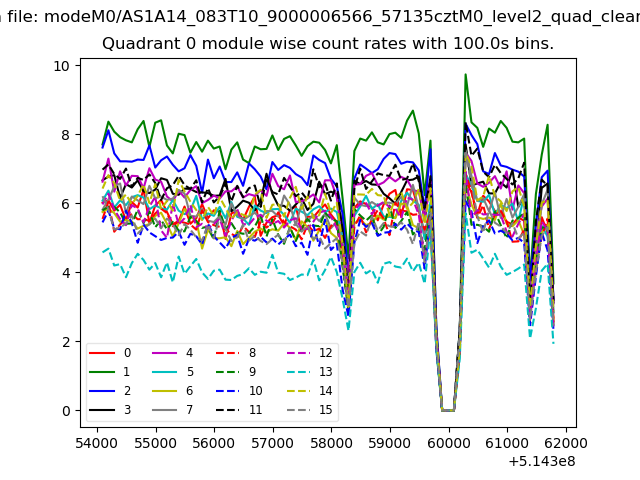 |
 |
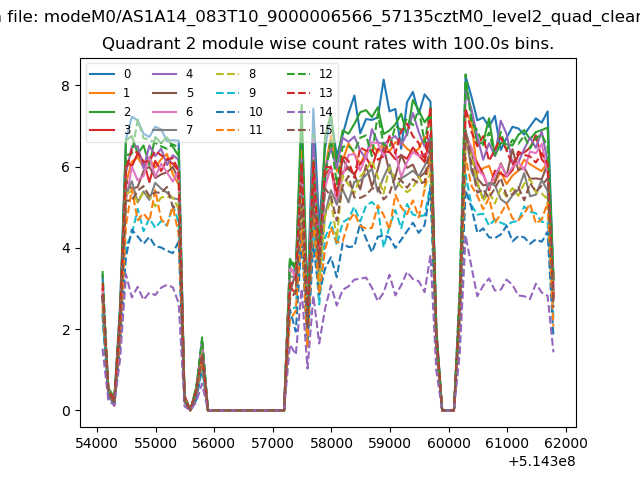
| Module-wise count rates for Quadrant B Data is divided into 100 sec bins |
 |
 |
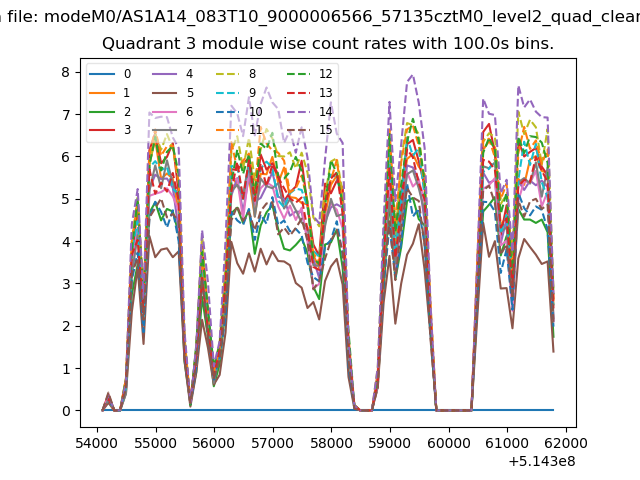
| Module-wise count rates for Quadrant C Data is divided into 100 sec bins |
 |
 |
| Module-wise count rates for Quadrant D Data is divided into 100 sec bins |
 |
 |
| Parameter | Plot |
|---|---|
| CZT HV Monitor | 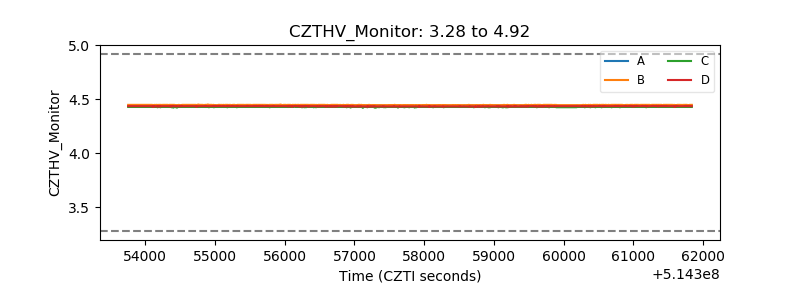 |
| D_VDD | 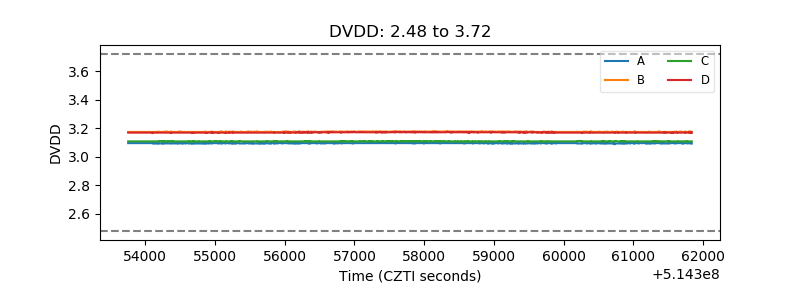 |
| Temperature 1 | 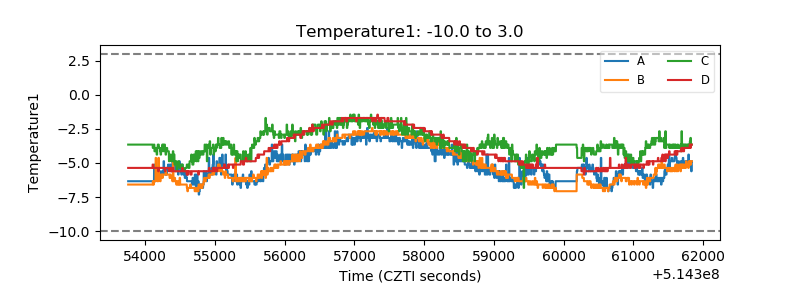 |
| Veto HV Monitor | 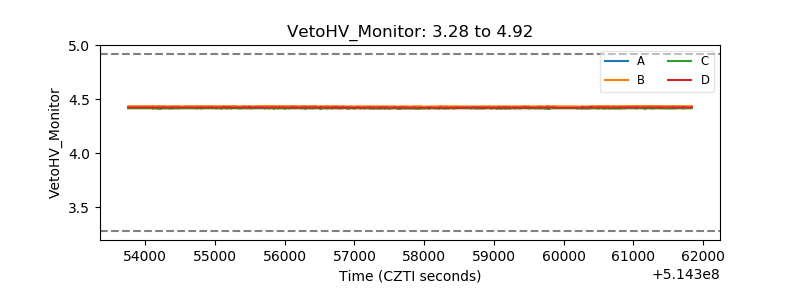 |
| Veto LLD | 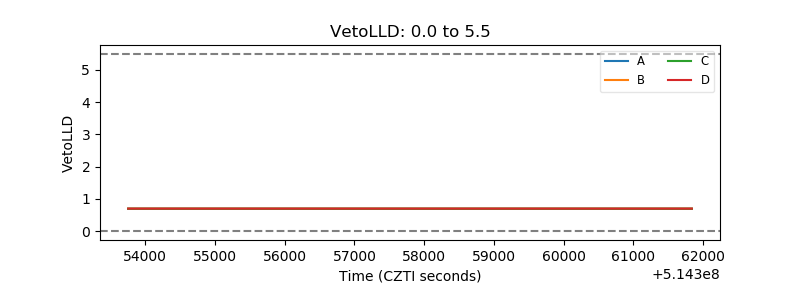 |
| Alpha Counter | 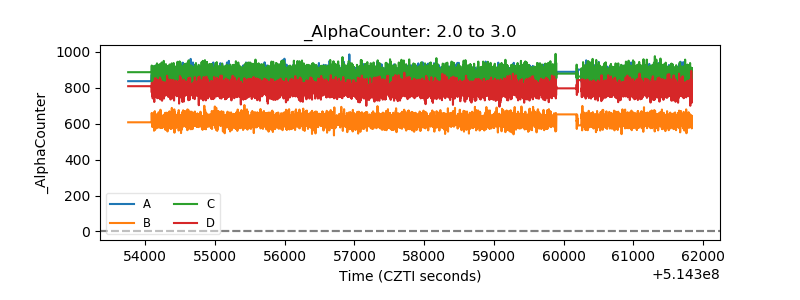 |
| _CPM_Rate | 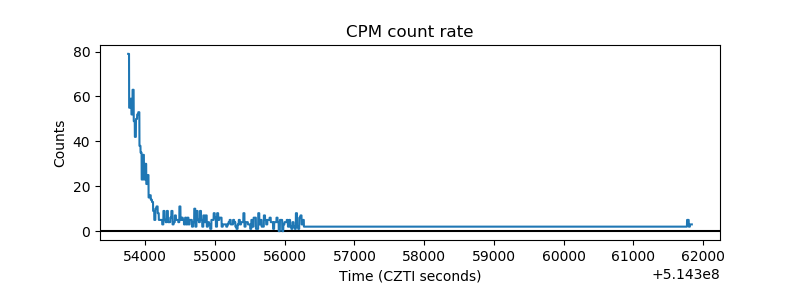 |
| CZT Counter | 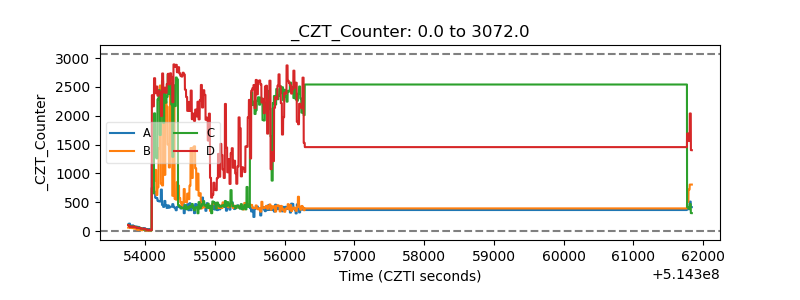 |
| +2.5 Volts monitor | 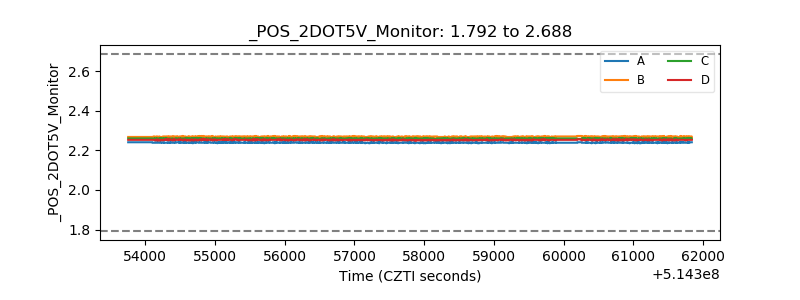 |
| +5 Volts monitor | 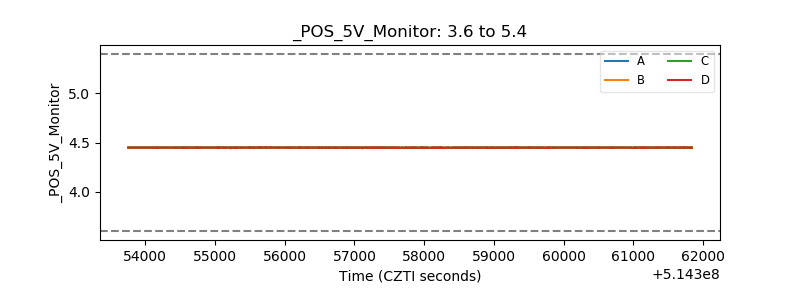 |
| _ROLL_ROT | 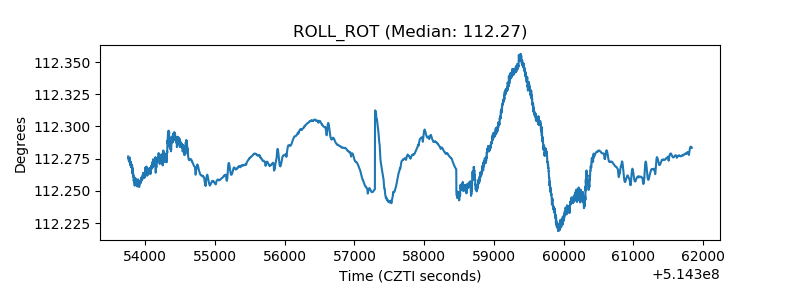 |
| _Roll_DEC | 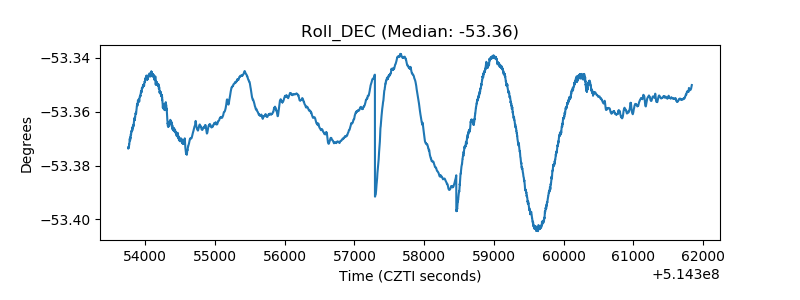 |
| _Roll_RA | 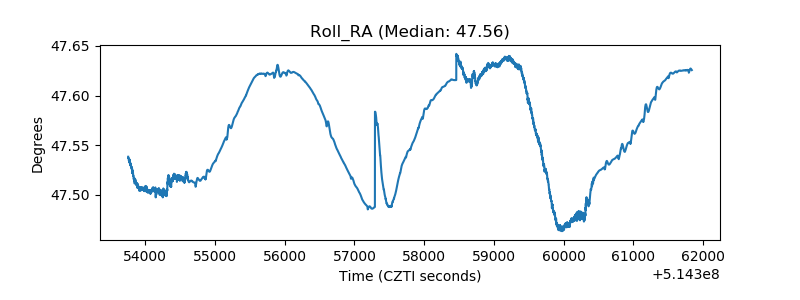 |
| Veto Counter | 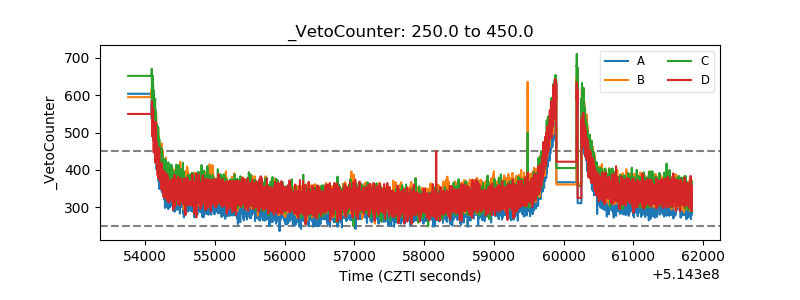 |